

Abstract
We consider a liquid containing impurities saturating a porous material; when the liquid evaporates, the impurities are deposited within the material. Applications include filtration and waterproof textiles. We present a mathematical model incorporating coupling between evaporation, accumulation and transport of the impurities, and the impact of the deposited impurities on the transport of both the suspended impurities and the liquid vapour. By simulating our model numerically, we investigate the role of temperature and repeated drying cycles on the location of the deposited impurities. Higher temperatures increase the evaporation rate so that impurities are transported further into porous material before depositing than for lower temperatures. We quantify two distinct parameter regimes in which the material clogs: i) the dry-clogging (high-temperature) regime, in which impurities are pushed far into the material before clogging, and ii) the wet-clogging (high-impurity) regime, in which liquid becomes trapped by the clogging. Clogging restricts the extent to which drying time can be reduced by increasing the temperature.
Export citation and abstract BibTeX RIS

Published by the EPLA under the terms of the Creative Commons Attribution 4.0 International License (CC-BY). Further distribution of this work must maintain attribution to the author(s) and the published article's title, journal citation, and DOI.
Introduction
As dirty liquid evaporates from within a porous material, it leaves the impurities that were suspended in the liquid behind. In many practical settings it is important to understand how and where these impurities are deposited within the porous structure. For example, between filter uses, contaminated water remains within the filter and contaminant may be deposited within the filter pores if the water subsequently evaporates [1]. Similarly, impurities accumulate within waterproof membranes (such as raincoats) as they dry after use [2–4]. These processes involve coupled evaporation, transport, and deposition, and related phenomena include the salt weathering of rock [5,6] and the coffee-ring effect [7–9]. Whatever the situation, it is necessary to understand where deposited impurities accumulate within the porous material and, especially, whether the porous material becomes clogged with impurities, as this may impact the efficacy of the filter [10,11], or the hydrophobicity or breathability properties of the waterproof clothing [4]. Wetting and drying cycles are typically repeated many times in the lifespan of a filter or membrane, and it is unclear how this affects the build-up of deposited impurities [1,11]. Typically, few aspects of the drying process can be controlled except for the temperature, which impacts the drying rate and thus the relative rates of evaporation, transport, and deposition. It is therefore crucial to understand the role that temperature plays in controlling the distribution of deposited impurities, to avoid unwanted impurity deposition profiles or material clogging.
The drying of a wet porous medium and the transport and deposition of impurities are coupled processes. As liquid evaporates, the impurities concentrate, which increases the likelihood of deposition. Furthermore, because this increase in impurity concentration occurs near the liquid surface, it reduces the vaporisation rate of the liquid [12]. The impurities may diffuse within the liquid, but may also be advected by a capillary-driven liquid flow, caused by the evaporation [13]. The transport of liquid, impurities, and vapour are also impacted by the build-up of deposited impurities, which reduce the local porosity. In order to predict the drying behaviour and the resulting deposited impurity profile within the porous material, it is necessary to understand these coupled processes of evaporation, impurity accumulation, transport, and deposition.
We consider a porous material initially saturated with water containing suspended dirt as the impurity. We present a mathematical model for dirt deposition in porous media that captures many of the coupled effects, but neglect capillary forces and liquid flows. This no-liquid-flow assumption is reasonable for sufficiently deep porous media [13], or for hydrophobic materials that suppress capillary action [14]. Our model is derived by homogenising a porescale model to give a tractable model that holds over the entire porous medium and systematically incorporates the porescale processes [15,16]. Since we neglect liquid flow and capillary effects, there is a sharp drying front between wet and dry regions of the porous medium, and the suspended dirt is only transported through the water by diffusion. We use our model to understand the role of temperature on the deposited dirt profile, and investigate the effect of repeated wetting and drying cycles.
Model statement
We study a one-dimensional porous material, residing between z = 0 (open surface) and  (impermeable surface) with two-dimensional, circular (radius r0) solid inclusions forming the pores (fig. 1). The evaporation front
  separates a fully dry region (occupied by a mixture of water vapour, density
  , and air) from a fully saturated region (occupied by suspended dirt, with volume fraction
  within the porespace, and water). The evaporation front
  moves through the porous material at a speed controlled by the transport of vapour out of the material. The suspended dirt is locally concentrated by the evaporation of water. It diffuses through the wet region, and deposits onto the walls of the microscale pores in a layer of thickness R(z,t), with deposition rate proportional to the local pore volume fraction θ. The deposited layer of dirt is left behind as the medium dries, and does not evolve while in the dry region, so that the dirt-layer thickness in the dry region,
  , only varies in space. The deposited dirt alters the porosity ϕ(R) of the material, with

As derived in the companion paper [15], our model incorporates evaporation, dirt transport, and deposition. In the dry region,  , vapour is transported by diffusion and advection due to the change in density of water as it evaporates, while the deposited dirt-layer thickness RD
does not evolve, so that
, vapour is transported by diffusion and advection due to the change in density of water as it evaporates, while the deposited dirt-layer thickness RD
does not evolve, so that


In the wet region,  , suspended dirt diffuses through the water and deposits on the solid microstructure at rate
  , linear in the volume fraction, θ, of the suspended dirt. This causes the deposited dirt-layer thickness R to increase at the same rate. Thus, in the wet region


The boundary conditions are


assuming that at z = 0 the vapour is instantaneously removed (e.g., by a fast flow of air over the surface) and no dirt passes through  . At
. At  we conserve the mass of the volatile component and the suspended dirt, which does not pass through the interface. We also assume that the vapour is in chemical equilibrium with the liquid. This means that ρ takes its saturation value
  at
at  , which depends on the suspended dirt volume fraction θ. The saturation vapour density of water vapour,
  , is around
  kg
kg  (for around
  ), but is strongly temperature-dependent [17]. We assume that the system is isothermal, but that the saturation vapour density
  is an increasing function of temperature T. Thus, we write
  in eq. (2g), and view
  as a proxy for T. While other system parameters, namely
  and k may also exhibit temperature variations, we estimate that these are less pronounced than for
  , which undergoes an order of magnitude change over the range
  . Thus, we neglect any other temperature dependence in the system. Initially (at t = 0), we assume

with θI
uniform. Like the porosity ϕ, given by (1), the effective diffusivity  (capturing the effect of the pore-structure on diffusivity), and surface area of the deposited dirt layer
  are dimensionless functions of R or RD
(in the wet and dry regions, respectively), with
are dimensionless functions of R or RD
(in the wet and dry regions, respectively), with

and  given by the solution of a cell problem [22,23], which varies monotonically from
  when R = 0 to
  when
when  . The porosity, ϕ, and effective diffusivity,
  , of the medium depend on R and, therefore, the transport of both the suspended dirt and the water vapour depend on where the dirt has previously deposited. The model parameters are listed in table 1 along with approximate values that we will use in our numerical simulations.

Fig. 1: Schematic of a drying porous medium, showing wet and dry regions separated by the moving evaporation front at  . Insets show the growing layer of deposited dirt, thickness R(z,t), on the porescale structure in the wet region, and the (non-growing) dirt layer, thickness
  in the dry region.
Download figure:
Standard imageTable 1:. Physically relevant parameter values. We assume that the dirt layer is deposited with a volume fraction  , so no water is trapped in the deposited layer. We choose k so that the deposition occurs over a similar timescale to the drying.
| Parameter | Description | Value | Reference |
| d | Interpore spacing |
 m m | [18] |
| r0 | Solid inclusion radius |

| – |
| L | Depth of porous material |
 m m | [18] |
| Dv | Diffusivity of water vapour in air |

| [19] |
| Dd | Diffusivity of suspended dirt in water |

| [19] |
| ρL | Liquid water density |

| [20] |
| ρG | Air density |

| [21] |

| Volume fraction of deposited dirt layer | 1 | – |
| k | Dirt deposition rate constant |

| – |

| Vapour saturation density |

| [17] |
Drying behaviour and the effect of temperature on drying
In our model (2), vapour is transported from the evaporation front to the surface by both diffusion and advection, with the flow being generated by the change in density of the water as it vaporises. The timescale for drying is estimated from a balance in eq. (2h), giving

We numerically simulate (2) using the method of lines with central differences for diffusive terms, and up-winding for advection. At a given temperature, the evaporation front moves fastest initially and then slows over time as the evaporation front moves further into the porous material, reducing the vapour density gradient and hence the vapour flux (fig. 2(a)). Suspended dirt is concentrated by removal of water by evaporation, accumulating near  , so the volume fraction
  of suspended dirt is largest at
  (fig. 2(b)). Dirt deposits on the microstructure at a rate proportional to the local suspended dirt volume fraction, and, therefore, deposition is fastest at the evaporation front. This, along with the temporal variation in the evaporation front speed, leads to an internal peak in the final deposited dirt thickness
  (fig. 2(c)).
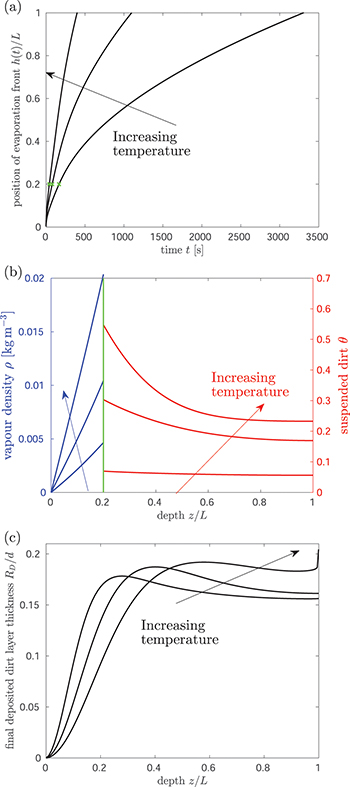
Fig. 2: The role of temperature on drying dynamics and resultant deposited dirt profile. Solutions for three temperatures, corresponding to  , are shown, and we take
  . (a) The position h(t) of the evaporation front against time. (b) The vapour density profile ρ and suspended dirt volume fraction θ in the material, at the times shown by green crosses in (a). (c) The final deposited dirt-layer profile
  once the drying is complete. Larger
  corresponding to higher temperatures result in a higher and wider peak in the deposited dirt-layer profile, further from the surface of the porous material, since evaporation at higher temperatures is faster relative to the dirt deposition, and so dirt is pushed further into the material before depositing.
Download figure:
Standard imageHigher temperatures correspond to higher values of  , thus faster evaporation, since there is a steeper gradient in ρ (fig. 2(b)). In turn, faster motion of the evaporation front leads to faster accumulation of suspended dirt relative to its deposition, seen in the increased θ-values (fig. 2(b)) (which are at the same stage
  in the drying). Therefore, for higher temperatures we observe (fig. 2(c)) that suspended dirt is pushed further into the porous medium before it deposits.
Clogging behaviours
The spatially non-uniform deposited dirt layer may lead to clogging of the porous material in certain parameter regimes. The system is said to have clogged if, at a particular time, the dirt-layer thickness R reaches its maximum possible value,  , so that —in our simple two-dimensional microscale geometry— the neighbouring circles of deposited dirt meet, and the effective diffusivity
  . When the material clogs, evaporation ceases, since the vapour cannot be transported past the point where
  . Since deposition occurs fastest at the moving interface
  , this is where clogging happens (if it occurs). Clogging is not specific to our choice of microscale geometry: for any given pore geometry there is a maximum dirt-layer thickness at which the porespace ceases to be a connected domain.
There are two distinct clogging mechanisms inherent to the model (2):
- Wet-clogging (fig. 3(a)) when
 while h is small, where water is trapped within the pore-structure behind the clog point. Wet-clogging only occurs for sufficiently high initial volume fractions, θI
, of the dirt, and for sufficiently fast dirt deposition relative to evaporation.
while h is small, where water is trapped within the pore-structure behind the clog point. Wet-clogging only occurs for sufficiently high initial volume fractions, θI
, of the dirt, and for sufficiently fast dirt deposition relative to evaporation. - Dry-clogging (fig. 3(b)) occurs when the rate of dirt deposition is sufficiently slow relative to evaporation, so that suspended dirt is pushed ahead of the evaporation front, accumulating until θ is close to 1. As, the evaporation slows considerably (if there were no dirt deposition, the system would approach θ = 1 in infinite time [15]). Since the evaporation is slow, deposition becomes significant, and R grows to . A negligible volume of water is trapped by dry-clogging in , since θ is close to 1. (The highest temperature situation shown in fig. 2 operates very close to the dry-clogging limit, since we see in fig. 2(c) that there is a very rapid increase in RD
near to .)


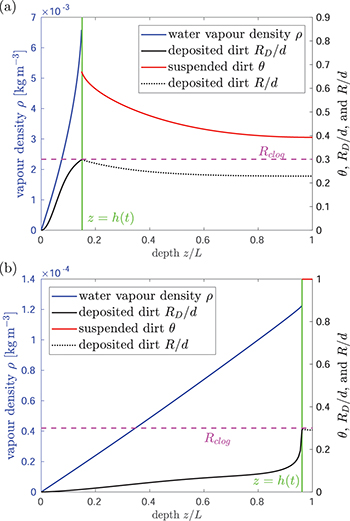
Fig. 3: Two distinct clogging mechanisms inherent to (2). (a) Wet-clogging, with  , where the deposited dirt-layer thickness reaches its maximum
  while the suspended dirt volume fraction θ< 1 and water is trapped within the material when evaporation ceases. (b) Dry-clogging, with
  , where dirt deposition is slow relative to evaporation, and accumulation results in
  as the system clogs.
Download figure:
Standard imageIn practical applications, it may be important to dry material quickly, which is achievable by increasing the temperature, but it is important to avoid clogging in order to maintain filter functionality or the breathability of waterproof clothing. We quantify the parameter regimes for which the material clogs by considering the final position,  , of the evaporation front (i.e., its position when the evaporation ceases) as a function of both the initial dirt volume fraction θI
and the saturation vapour density
, of the evaporation front (i.e., its position when the evaporation ceases) as a function of both the initial dirt volume fraction θI
and the saturation vapour density  (which we assume monotonically increases with temperature) (fig. 4(a)). If the evaporation front reaches the end of the domain,
  and there is no clogging. We observe that
  if both the initial dirt volume fraction θI
is sufficiently small, and
if both the initial dirt volume fraction θI
is sufficiently small, and  (or temperature) is sufficiently low. There is a critical initial dirt volume fraction,
  , around 0.6 above which we see wet-clogging, with
  significantly below L. We see that
  is largely independent of temperature for most values of
  (or temperature). However, at very low temperatures, we are able to dry fully with slightly higher dirt loads without wet-clogging. This is because, by drying slowly at low temperature, the dirt deposition is spatially uniform to a first approximation, only minimally affected by suspended dirt accumulation at the evaporation front. An upper bound on
  is estimated by supposing dirt deposition is uniform (the limit of infinitely slow evaporation), giving

for the parameter values used in fig. 4. In practice, we see that wet-clogging occurs for θI below this upper bound due to the non-uniform dirt deposition profile due to evaporation.

Fig. 4: The effect of temperature and initial dirt level on clogging and drying time. (a) Colour shows the final position of the evaporation front  , varying the initial suspended dirt volume fraction, θI
, and the saturation vapour density,
, varying the initial suspended dirt volume fraction, θI
, and the saturation vapour density,  . We see wet-clogging above a critical θI
, which is largely independent of
. We see wet-clogging above a critical θI
, which is largely independent of  . Dry-clogging is observed as
  is increased: the black lines are the curves
  (solid line), 0.98 (dashed line), and 0.95 (dotted line). (b) End time
  as a function of the saturation vapour density
  for various θI
(chosen so there is no wet-clogging). The drying time is inversely proportional to the saturation density at low
for various θI
(chosen so there is no wet-clogging). The drying time is inversely proportional to the saturation density at low  , but drying is limited by suspended dirt diffusion at higher temperatures (higher
  ).
).
Download figure:
Standard imageFor  is close to L. However, at larger
  we see
  decrease below L as dry-clogging begins: the solid, dashed and dotted black contours show where
  is 1%, 2% and 5%, respectively, away from the end of the domain. Generally, at higher temperatures (greater
  ), deposition is slower relative to evaporation, pushing the system towards dry-clogging. These contours are not horizontal due to the dependence of the deposition and evaporation rates (via eq. (2g)) on θ: for a fixed temperature (or
  ) the dirt deposition rate is proportional to θ. Thus for smaller θI
(with slower deposition rate) dry-clogging is less prominent. Meanwhile, for large θ, evaporation is slowed due to suspended dirt accumulation at
) the dirt deposition rate is proportional to θ. Thus for smaller θI
(with slower deposition rate) dry-clogging is less prominent. Meanwhile, for large θ, evaporation is slowed due to suspended dirt accumulation at  , again reducing the dry-clogging effect.
The time  at which drying completes (i.e., h reaches
  ) also depends on both temperature (via
  ) and θI
(fig. 4(b)). Here we consider only
) and θI
(fig. 4(b)). Here we consider only  so that there is no wet-clogging. At low temperatures (small
  ) the drying time is seen to be inversely proportional to
  . However, as the temperature or
  increases, we see that the drying time does not continue to decrease. Instead, the evaporation becomes limited by the diffusive transport of suspended dirt away from the evaporation front, which occurs over a timescale of around
  s. The dependence of the drying time on θI
is relatively small: we observe faster drying at higher dirt volume fractions since there is less water in the system to evaporate.
s. The dependence of the drying time on θI
is relatively small: we observe faster drying at higher dirt volume fractions since there is less water in the system to evaporate.
Overall, to minimise drying time we have seen that we should dry at higher temperatures. However, beyond a certain point the drying rate is limited by suspended dirt diffusion away from the evaporating interface and so increasingly higher temperatures yield limiting returns. Furthermore, at higher temperatures dry-clogging begins to take effect, creating a region of blocked filter that compromises its future functionality.
Multiple drying cycles
We also investigate the effect of multiple repeated wetting and drying cycles. Starting with R = 0 everywhere, we simulate drying a material, initially saturated with a  dirt solution, until
  (no clogging occurs for these parameter values). We then take the final deposited dirt profile
  and restart the model with this as the initial deposited dirt profile, and with
  again, and repeat for many cycles. The internal peak in
  is accentuated with each repeated cycle (fig. 5(a)). This is because the local porosity ϕ and effective diffusivity
  depend on the previous cycles' dirt deposition. (Subsequent additional wetting and drying cycles would eventually lead to wet-clogging.)
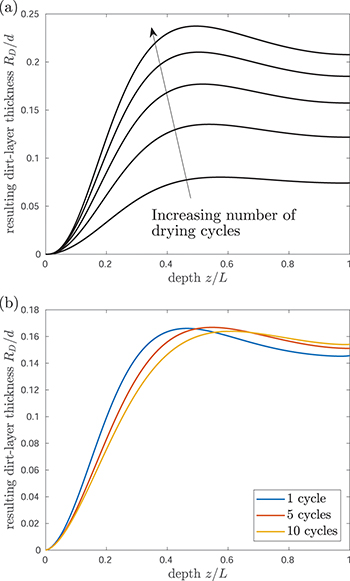
Fig. 5: Multiple repeated wetting and drying cycles. (a) Resulting dirt deposition profiles after each of five successive drying cycles, with the same initial dirt level  for each cycle. The arrow moves from the first drying cycle to the last. (b) Resultant dirt deposition profiles for different numbers of repeated drying cycles: here the same total amount of dirt is deposited, but over a different number of drying cycles.
Download figure:
Standard imageWe also compare the resulting deposited dirt profiles when the same total amount of dirt,  per unit cross-sectional area, has been deposited, but over a different number of these repeated wetting/drying cycles (fig. 5(b)): at the start of each drying cycle we impose
  , where N is the number of drying cycles (
 , and 10 in fig. 5(b). The more cycles we take to deposit the dirt, the further into the porous material the dirt is pushed before depositing, with a peak RD
deeper into the porous material (fig. 5(b)). This is because, since the deposition rate is proportional to θ, for larger N (more cycles) θ is smaller and, therefore, the deposition rate is slower during each cycle, while the evaporation rate remains roughly the same for different N. This suggests that clogging due to accumulation over many cycles is likely to occur deeper within the porous material than over a single cycle.
, and 10 in fig. 5(b). The more cycles we take to deposit the dirt, the further into the porous material the dirt is pushed before depositing, with a peak RD
deeper into the porous material (fig. 5(b)). This is because, since the deposition rate is proportional to θ, for larger N (more cycles) θ is smaller and, therefore, the deposition rate is slower during each cycle, while the evaporation rate remains roughly the same for different N. This suggests that clogging due to accumulation over many cycles is likely to occur deeper within the porous material than over a single cycle.
Conclusion
Our model captures the nonlinear coupled relationships between evaporation, vapour transport, dirt accumulation, transport, and deposition, as a dirt–water mixture is dried in a porous material. Both the drying dynamics and resulting distribution of deposited dirt through the porous material are seen to depend on the temperature of the drying. Furthermore, we identify parameter regimes in which the porous medium clogs. In particular, we see that higher temperatures result (as expected) in faster drying, albeit with limited returns, as at sufficiently high temperatures the drying becomes limited by the transport of suspended dirt away from the evaporation front. Furthermore, too high a temperature results in the dry-clogging of the material, by which the porespace at the end of the medium is fully clogged with dirt. The fastest drying that can be achieved is therefore at the highest temperature for which dry-clogging does not occur. These results are expected to be valuable in the filtration and waterproof textiles industries for optimisation of filter membrane cleaning and drying procedures in order to maximise filter lifespan and functionality.
Acknowledgments
The authors thank U. Beuscher and V. Venkateshwaran (W.L. Gore & Associates, Inc.), L. Hetherington (Defra), G. Anderson (Beko), and S. Tarkuç (Arçelik) for useful discussions. EKL is grateful for funding from the Industrial Fund of the InFoMM CDT. IMG is grateful to the Royal Society for funding through a University Research Fellowship. The authors are additionally grateful to the anonymous reviewers for their helpful comments, which improved the quality of the paper. The authors have no conflicts of interest to disclose.
Data availability: The data that support the findings of this study are openly available at the following URL/DOI: 10.5281/zenodo.10931344.