

Abstract
The dependence of the magnetic moment of the perovskite manganites La1−xSrxMnO3 on the Sr doping level, x, is fitted using an oxygen 2p itinerant electron model for magnetic oxides (i.e., the IEO model), which is similar to the O 2p hole model proposed by Alexandrov et al. (Phys. Rev. Lett., 96 (2006) 117003). According to this IEO model, the itinerant electrons in these manganites are oxygen 2p electrons (or 2p holes) rather than 3d electrons, as assumed in the double-exchange interaction model. Furthermore, the proposed IEO model describes the process by which the itinerant electrons transit along the O2−–Mn2+–O2−–Mn3+–O1− ion chains in La1−xSrxMnO3 (x < 0.15), wherein a 2p hole is present in the outer orbit of the O1− anion and the magnetic moment of the Mn3+ cation is opposite to that of the Mn2+ cation.
Export citation and abstract BibTeX RIS

Published by the EPLA under the terms of the Creative Commons Attribution 3.0 License (CC-BY). Further distribution of this work must maintain attribution to the author(s) and the published article's title, journal citation, and DOI.
Corrections were made to this article on 21 January 2018. The OA status of this article was amended.
Introduction
The manganites  with an ABO3 perovskite structure, where R and T are rare-earth and alkaline-earth ions, respectively, have been studied extensively owing to their rich physics, which is related to their colossal magnetoresistance, and their potential applications in magnetic devices [1–12]. It is assumed that the spin structure and electronic transport properties of
  manganites are correlated via the double-exchange (DE) mechanism [13] (in which the hopping of eg electrons between the Mn3+ and Mn4+ cations is mediated by oxygen anions). It is also believed that the antiferromagnetic spin structure of RMnO3 is correlated via the magnetic superexchange (SE) interaction between the Mn3+ cations and is mediated by oxygen anions. However, no one has been able to explain the dependence of the observed magnetic moment,
  , on the T doping level, x, in the case of these manganites. This is a challenging problem that has puzzled both experimentalists and theorists for many years and was the focus of the present investigation.
In order to explain the electrical-transport properties of such ferromagnetic manganite materials (including  ), Alexandrov et al. [14] proposed an O 2p hole model on the basis of the experimental results of a number of electron energy-loss spectroscopy (EELS), X-ray absorption spectroscopy (XAS), and nuclear magnetic resonance (NMR) studies that showed unambiguously that the current carriers are oxygen p holes and not d electrons [15–18]. The fact that p holes were observed was used to confirm the so-called current-carrier collapse (CCDC) model, which was used to describe the electrical-transport characteristics of perovskite manganites [14]. Following these reports, there have been several investigations on the electrical-transport characteristics of these materials. Grenier et al. [19] observed the superstructures associated with the oxygen 2p states in two prototypical manganites through X-ray diffraction analysis at the oxygen K edge. Mizoroki et al. [20] carried out magnetic Compton scattering measurements on polycrystalline samples of the perovskite manganites La1−xSrxMnO3 and found that the doped holes predominantly enter the O 2p states in the lightly doped region. Xu et al. [21] modeled the temperature dependence of the electrical resistivity of perovskite manganites Nd0.5Ca0.5−xSrxMnO3.
Given that p holes exist in the outer orbits of the O1− ions, this suggested that O1− ions are present in these oxides, in addition to O2− ions. The fact that O1− ions as well as O2− ions are present in these oxides has further been confirmed through density functional theory (DFT) calculations and several experimental studies.
For the perovskite oxide BaTiO3, Cohen et al. [22,23] calculated the valence electron density of states (DOS) using DFT; their results indicated that the average valences of Ba, Ti, and O are +2, +2.89, and −1.63, respectively, rather than +2, +4, and −2, as was assumed in the conventional view. These values suggest that only Ti2+ and Ti3+ cations are present in BaTiO3, with Ti4+ cations being absent. As an approximation, if the value of the oxide ionicity, fi, is taken to be half of the average valence of the oxygen anions,  , BaTiO3's ionicity can be estimated to be
  . We note that this approximate result is in good qualitative agreement with the results of other ionicity studies [24–26].
Dupin et al. [27] proposed that some O ions in several oxides are O1− ions, based on the X-ray photoelectron spectra (XPS), and calculated the average net charges of the oxygen ions,  . In particular, they determined that the average net charges of TiO2, ZrO2, CoO, CaO, and SrO are −1.15, −1.18, −1.05, −1.78, and −1.85, respectively. Here, the average net charge,
  , can be understood as the average valence of the oxygen ions,
  . Since the conventional valence of O is considered to be −2, these reduced values also implied that O1− anions must also be present in these oxides, in addition to O2− anions. Moreover, the average valences of Ti and Zr in TiO2 and ZrO2 were determined to be +2.30 and +2.36, respectively, rather than +4 in the conventional view, and these values also suggest that no tetravalent cations are present in these oxides. Thus, it can be concluded that only divalent and trivalent Ti and Zr cations are present in TiO2 and ZrO2.
Following Dupin et al. in a recent work, we found that the average valences of the O ions in polycrystalline bulk samples of BaTiO3 [28] and SrTiO3 [29] were −1.55 and −1.62, respectively; both these values are close to that (−1.63) calculated by Cohen et al. for BaTiO3 [22,23]. In addition, we obtained a very interesting result: the estimated ionicity, fi (i.e., half the average oxygen valency,  ) decreased approximately linearly with an increase in the cation second ionization energy, V2i [28], which is in very close agreement to the results reported by Phillips [24]. In similar studies, both Guo et al. [30] and Raddy et al. [31] reported the ionicities of several other dioxide materials. Based on these results, one may determine the qualitative relation fi < 0.75 when the fourth ionization energy
  . This relation also suggests the absence of quadrivalent cations when
  . The variation in the ionicity with the ionization energy of the cations can be understood as follows: it is difficult to remove an electron with a high ionization energy from its cation. In addition, our group performed XPS analysis on two SrTiO3 samples subjected to argon ion etching for different durations [29]. We found that the absolute values of the average valences of O and Ti ions in the two samples increased and decreased, respectively, with an increase in the etching time; this was due to the fact that the O/Ti ion content ratio decreased with an increase in the etching time.
Thus, given that the fourth ionization energy of a Mn cation is 51.2 eV, as suggested by previous studies, and by assuming that no Mn4+ cations were present in the La1−xSrxMnO3 (0.05 ≤ x ≤ 0.40) samples studied in this work, we could explain their magnetic structure and fit the dependence of their magnetic moments on the Sr doping level using an O 2p itinerant electron model similar to the O 2p hole model proposed by Alexandrov et al. [14].
Experiment and results
Powder samples of La1−xSrxMnO3 with Sr contents of  were prepared using the sol-gel method [32–34]. The detailed experimental procedures were as follows. First, La2O3 was thermally treated at 1073 K for 3 h to remove H2O and CO2. Next, stoichiometric quantities of La2O3, Sr(NO3)2, and Mn(NO3)2 were dissolved in a dilute HNO3 solution, and suitable amounts of citric acid and ethylene glycol were added as complexing agents until a completely homogeneous transparent solution was obtained. This solution was subjected to slow evaporation at 363 K in a water bath until a highly viscous gel was formed. This gel was subsequently heated at 473 K for 24 h until it was completely dry. Second, after grinding, the obtained powder was subjected to further heat treatment. In our heating procedure, the temperature was first increased in steps of 25 K from 473 to 673 K, with the temperature held for 30 min at each step. Following this, the temperature was further increased in steps of 10 K from 673 to 773 K, with the temperature also held for 30 min at each step. The powder was then thermally treated at 773 K for 10 h before being gradually cooled during furnace cooling. At this point, the powder samples had already formed the ABO3 perovskite structure, but owing to the small diameter of the crystallites, which affected our analysis of the intrinsic magnetism, they required further thermal treatment [10]. Thus, after the samples were calcined at 873 K for 5 h and 1073 K for 10 h, in sequence, the powders were then compressed into pellets measuring 13 mm in diameter and 2 mm in thickness to promote contact at the grain boundaries before they were calcined for 10 h at a temperature of 1273 K. Finally, the sample powders obtained by grinding the sintered pellets were calcined once more at a temperature of 1273 K for 10 h to obtain the polycrystalline powders of La1−xSrxMnO3 studied in this work. It is worth noting that each thermal treatment was performed in a muffle furnace.
X-ray powder diffraction (XRD) patterns were analysed using the X'Pert HighScore Plus software suite (PANalytical), and these patterns are shown in fig. 1 for a range of Sr doping levels, x. All the samples were found to consist of a single ABO3 perovskite phase with the space group  , and the volume-averaged diameters of the crystallites in each sample were estimated based on the Scherrer equation. In every case, these diameters were found to be greater than or close to 100 nm. Thus, it was assumed that the surface effects would be very weak [10].
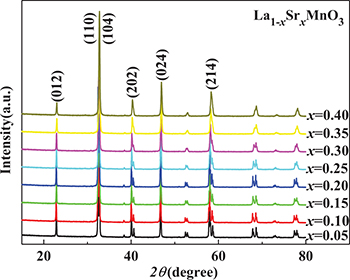
Fig. 1: (Colour online) XRD patterns of the La1−xSrxMnO3 samples.
Download figure:
Standard imageNext, Rietveld fittings of the XRD patterns of the samples were performed. The fitting results for the lattice parameters, a and c, the crystal cell volume, v, the B–O (Mn–O) bond length,  , and the B–O–B (Mn–O–Mn) bond angle, θ, are shown in fig. 2. As the doping level, x, increases, a number of distinctive features are observed: i) there is a characteristic doping level,
  , such that when x < 0.15, the magnitude of the Mn–O bond length,
  , changes only slightly, while it undergoes a more significant reduction with an increase in x when x > 0.15; ii) there is another characteristic doping level,
  , for the lattice constant a and the crystal cell volume v, such that both a and v change only slightly when x < 0.20, while both of them decrease with an increase in x when x > 0.20; and iii) the Mn–O–Mn bond angle, θ, increases gradually with an increase in x. We would like to note that these dependences of the crystal structure parameters on the doping level, x, are related to each sample's magnetic moment, as shown below.
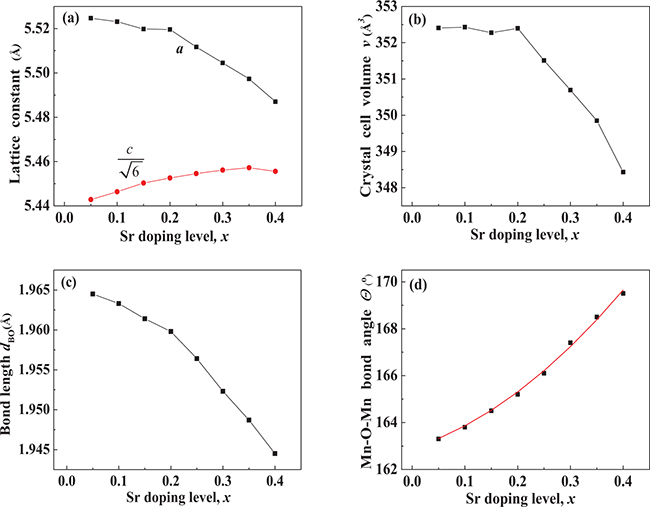
Fig. 2: (Colour online) Dependence on Sr doping level, x, of (a) lattice parameters a and c, (b) cell volume v, (c) Mn-O bond length  , and (d) Mn–O–Mn bond angles Θ.
Download figure:
Standard imageIn order to estimate the average valences of the ions in the samples, we measured the O 1s photoelectron spectra of the samples La1−xSrxMnO3 (x = 0.05 and 0.15) using an XPS system (PHI5000 Versa Probe) with a monochromatic Al–Kα radiation (1486.6 eV) source. The C 1s binding energy (284.8 eV) of a carbon contaminant was used for calibration in order to compensate for the charging effects. The computer program XPSPEAK (Version 4.1) was used to fit the narrow-scan spectra after Shirley-type background subtraction. The narrow-scan spectra of the O 1s peaks were fitted using symmetric Gaussian-Lorentzian product functions.
Figures 3(a) and (b) show the O 1s spectra of the samples La1−xSrxMnO3 (x = 0.05 and 0.15). It can be seen that the O 1s spectra can be fitted using three peaks with different binding energies (BEs). According to the interpretation suggested by Dupin et al. [27] and Wu et al. [28,29], the lowest BE peak can be assigned to O2− ions, the middle peak to O1− ions, and the highest peak to  , that is, the oxygen chemically adsorbed on the surface of the sample. Setting
  , where
  and
and  represent the content ratio and peak area ratio of the O1− and O2− anions, respectively, and requiring that
  , we get

The average valence,  , of the oxygen anions can be obtained as follows:

Thus, the  for the samples with
  and 0.15 were determined to be −1.65 and −1.77, respectively. These values are close to the average valence (−1.63) of oxygen in BaTiO3 as calculated by Cohen [22,23]. Additionally, the ionicities,
  , of the two samples were determined to be 0.825 and 0.885, respectively. Although it is difficult to accurately measure the valences of the ions in an oxide using XPS owing to the effect of the oxygen content of the test sample [29], it could be confirmed that the absolute values of the valences of the cations and anions were lower than the conventional values.

Fig. 3: (Colour online) Fitting results of O 1s XPS spectra of (a) La0.95Sr0.05MnO3 and (b) La0.85Sr0.15MnO3. Points and curves represent the observed and fitted results, respectively.
Download figure:
Standard imageThe magnetic hysteresis of each La1−xSrxMnO3 sample was measured at 10 K. The resulting specific saturation magnetizations,  , and magnetic moments,
  , per formula are listed in table 1. The Curie temperatures,
  , of the samples have a slight difference with those reported by Urushibara [5], as can be seen from table 1. This difference is attributed to the fact that their single crystal samples were grown by alternative means to that used in this work (i.e., their samples were grown using the floating-zone (FZ) method). It can also be observed that
  increases rapidly with an increase in x when
  but decreases slowly for
  . The maximum observed value,
  , occurs when
  . We would like to note that this observed trend in
  is very similar to those reported by Urushibara [5] and Jonker [35]; these are also shown in table 1 and fig. 4 for comparison. In fig. 4, the points represent the experimental results while the curve represents the fit obtained from the analysis presented in the following section.
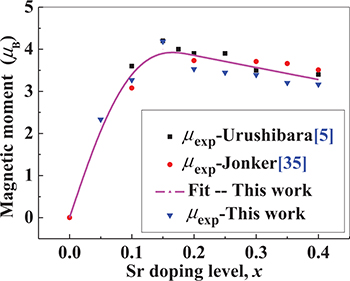
Fig. 4: (Colour online) Fitted (curve) dependence on Sr doping level, x, of magnetic moments of La1−xSrxMnO3 samples and results observed in this work ( ), as well as data reported by Urushibara (
 ) [5], and Jonker (
 ) [35].
Download figure:
Standard imageTable 1:.
Specific saturation magnetization ( ) values of La1−xSrxMnO3 samples measured at 10 K.
  is the magnetic moment per formula of the samples at 10 K and
  is the Curie temperature of the samples. Values of
  and
and  reported by Urushibara [5] and Jonker [35] are also listed.
| Sr content |  (A · m2/kg) (A · m2/kg) |
Magnetic moment  (μB/formula) (μB/formula) |
 (K) (K) |
|||
|---|---|---|---|---|---|---|
| x | This work | This work | Urushibara [5] | Jonker [35] | This work | Urushibara [5] |
| 0.00 | – | – | – | 0.00 | – | – |
| 0.05 | 54.45 | 2.33 | – | – | 107.7 | – |
| 0.10 | 77.20 | 3.27 | 3.6 | 3.08 | 168.3 | 145 |
| 0.15 | 99.91 | 4.19 | 4.2 | – | 216.5 | 238 |
| 0.20 | 85.15 | 3.53 | 3.9 | 3.73 | 292.7 | 309 |
| 0.25 | 84.09 | 3.45 | 3.9 | – | 313.7 | 342 |
| 0.30 | 83.72 | 3.39 | 3.5 | 3.71 | 337.2 | 369 |
| 0.35 | 79.95 | 3.21 | – | 3.66 | 350.4 | – |
| 0.40 | 79.88 | 3.17 | 3.4 | 3.51 | 348.9 | 371 |
Discussion
In keeping with previous reports [14–31] and the experimental results shown in fig. 3, we assumed that both O1− anions and O2− anions were present in the tested oxides and that there were no tetravalent Mn4+ cations in the samples. Therefore, an O 2p hole must be present in the outer orbit of the O1− anions, while the O2− anions must have a full outer electron shell with 8 electrons. Given the similarity of the test system to the O 2p hole model [14–18], we analyzed the magnetic ordering in these materials using an O 2p itinerant electron model for magnetic oxides (IEO model) that was recently proposed by our group [36]. We would like to mention that this IEO model has already been used to fit the dependence of the magnetic moment on the doping level for several series of spinel ferrites [37–46] and perovskite manganites [47,48].
The IEO model is based on the following three postulates [36]: i) O1− anions are present in oxides and there are 2p holes in the outer orbits of these O1− anions; ii) the two O 2p electrons in the outer orbit of an O2− anion (which have opposite spin directions) become itinerant electrons in the two different sublattices (the A or B sites); and iii) the magnetic ordering in the B sublattice of the ABO3 perovskite manganites La1−xSrxMnO3 is dependent on the number of 3d electrons, nd (including both the local and the itinerant 3d electrons of the Mn cations) and is subject to the constraints arising from Hund's rules [49].
Thus, there is a certain probability that a 2p electron of an O2− anion can hop to a 2p hole in an adjacent O1− anion (while maintaining a constant spin direction) in a process mediated by the valence electrons of the cations. This hopping process can, of course, also be understood as a 2p hole hopping in the opposite direction. Moreover, since we know that a maximum of five electrons can have their spins aligned in one direction in the 3d subshell of transition metal atoms, when an itinerant electron hops to a Mn3+ cation  , the spin direction of this itinerant electron must be parallel to the spin direction of the local 3d electrons (majority spins). However, when an itinerant electron hops to a Mn2+ cation
  , the spin direction of this itinerant electron must be antiparallel to the spin direction of the local 3d electrons. Therefore, the directions of the magnetic moments of the Mn2+ cations at the B sites must be antiparallel to those of the Mn3+ cations, because the spin direction of the itinerant electron remains constant during the hopping process. Thus, according to the IEO model, the direction of the magnetic moment of the Mn2+ cations in LaMnO3 is opposite to that of the magnetic moment of the Mn3+ cations.
As can be seen from fig. 4, Urushibara et al. [5] and Jonker [35] observed that the maximum magnetic moment  occurred at doping levels of
  and 0.20, respectively. According to our own experimental results, the maximum magnetic moment value was obtained at
  . In order to fit the observed maximum magnetic moments, we assumed that the valence of all Mn cations is
  when
when  . In other words, we assumed that the ionicity of the Mn cations,
  , is 1.00.
As is well known, the Mn cations in LaMnO3 have an antiferromagnetic structure [1–3,5,35]. As the ratio of the magnetic moments of the Mn2+ and Mn3+ cations is 5/4 and since the total magnetic moment of the sample is zero [35], one can readily determine that the content ratio of the Mn2+ and Mn3+ cations is 4/5. Therefore, the ionicity of the Mn cations may be estimated from

where the denominator 3 is attributable to the fact that the ionicity of Mn is 1.0 when the valence of Mn in this oxide is 3.0.
Then, in order to fit the observed trend in the sample magnetic moments as a function of x when  (as shown in table 1 and fig. 4), we assumed that the ionicity of the Mn cations varied as

By applying the conditions  and
and  , we could then easily calculate the fitting parameters and obtain a fit:

Using eq. (4), the contents of the Mn2+ and Mn3+ cations, M2 and M3, could also be obtained:

Based on these expressions, the magnetic moment of the samples could then be obtained as follows:

In order to explain the fact that the magnetic moments decrease with an increase in x when x > 0.15, we assumed that the samples have a canted ferromagnetic structure and that the angle between the magnetic moments of the Mn3+ cations is greater than zero when x > 0.15. We also assumed that the magnetic moments vary linearly with x as shown below:

where the parameter 0.72 was obtained by fitting the model with the data presented in table 1. As was mentioned earlier, fig. 4 shows the measured and calculated dependencies of the magnetic moments of La1−xSrxMnO3 on the Sr doping level, x, where the solid curve represents the fitted result obtained using eqs. (6) and (7). The different points represent the magnetic moments observed in this work ( ), those reported by Urushibara (
 ) [5], and those observed by Jonker (
 ) [35] (see also table 1). One can see that our fitted curve is in very good agreement with the average value of the observed results. The observed magnetic moments in the three sets of samples for the same composition have slightly different values due to the different methods used to prepare the samples. The first set of samples we considered were single crystals that were grown using the FZ method by Urushibara et al. [5]. The second set of samples were polycrystalline powders that were prepared using a ceramic technique with a maximum thermal treatment temperature of 1450 °C by Jonker et al. [35]. The third set of samples we considered were the polycrystalline powders studied in this work, which were prepared using the sol-gel method with a maximum thermal treatment temperature of 1000 °C.
Finally, the average angle ϕ between the magnetic moments of the Mn3+ cations could also be obtained from eq. (7) and is given by

where the angle ϕ is expressed in degrees. A simple calculation shows that, at the highest level of doping considered, that is, at  , the canting angle is significantly larger than zero, i.e.,
  . We would like to note that our assumption regarding the canted magnetic structure of the Mn cations has been confirmed by magnetoresistance experiments performed on Pr0.6Sr0.4MnO3 [47].
Conclusion
Following the oxygen 2p hole model proposed by Alexandrov et al., we could successfully explain the magnetic structures of the perovskite manganites La1−xSrxMnO3 using an oxygen 2p itinerant electron model. On the basis of previous ionicity investigations and XPS analyses, we assumed that only Mn2+ and Mn3+ cations were present in the tested samples, with tetravalent Mn4+ cations being absent. We found that, when the Sr doping level, x, is in the range  , the content ratio of the Mn2+ and Mn3+ cations decreases from 4/5
  to 0
to 0  , resulting in the magnetic moments increasing from 0 (
 ) to
) to  (
( ). This behavior is due to the magnetic moment direction of the Mn2+ cations being opposite to that of the Mn3+ cations. When
  , the magnetic moment of the sample reaches its maximum value and all the Mn cations are assumed to be Mn3+ cations. For higher Sr doping levels, i.e., for
  , the samples are assumed to have a canted ferromagnetic structure and the angle between the Mn3+ cation magnetic moments is assumed to be greater than zero. This increase in the canting angle causes the magnetic moment of the samples to decrease with the increase in the Sr content. The analysis reported here highlights the suitability of the IEO model in elucidating the magnetic ordering of La1−xSrxMnO3 and in fitting the dependence of the magnetic moments of the La1−xSrxMnO3 samples measured at 10 K on the Sr doping level, x.
Acknowledgments
This work was supported by the Natural Science Foundation of Hebei Province (Grant No. A2015205111), the National Natural Science Foundation of China under Contract No. NSF-11174069, and the Young Scholar Science Foundation of the Education Department of Hebei Province (QN2016015). The authors wish to thank Dr Norm Davison for helpful discussions.