


Abstract
It is likely that multiple genes contribute to immunoglobulin (Ig)E production. Co-stimulatory molecules are crucial for the cross-talk between antigen presenting cells and T-lymphocytes which drives the IgE response.
We evaluated gene–gene interactions of haplotype tagging polymorphisms in a pathway of 24 co-stimulatory genes in relation to serum IgE levels. We assessed this at ages 1–2 yrs and 6–8 yrs in 3,062 Dutch children from a pooled data set of three birth cohorts: PIAMA (Prevention and Incidence Asthma and Mite Allergy), PREVASC (Prevention of Asthma in Children) and KOALA (Child, parents and health: lifestyle and genetic constitution).
Single- and multi-locus associations with serum IgE levels (3rd versus 1st tertile) were evaluated by Chi-squared tests and the multifactor dimensionality reduction (MDR) method in the following co-stimulatory genes: VTCN1, TNFRSF4, TNFRSF18, TNFRSF14, TNFSF18, TNFSF4, CD28, CTLA4, ICOS, PDCD1, BTLA, CD80, CD86, HLA-G, CD274, PDCD1LG2, CD276, LILRA4, LILRB1, LILRB2, LILRB4, CD40, ICOSLG, and CD40LG. We found multiple statistically significant single-locus (S) and multi-locus (M) associations for the genes VTCN1SM, TNFSF18SM, TNFSF4S, CD28S, CTLA4M, ICOSS, BTLAM, CD80M, CD86SM, CD274SM, PDCD1LG2M, LILRA4SM, LILRB4M, and CD40SM with serum IgE. Two-locus interactions of CD86 with VTCN1 and CD274 with LILRA4 were confirmed by logistic regression.
In conclusion, serum IgE levels are regulated by multiple gene–gene interaction effects in the co-stimulatory pathway. We suggest using research strategies that model multiple gene–gene interactions in genetic studies.
Atopic diseases such as asthma, hay fever and atopic dermatitis are complex in origin, i.e. development of these diseases results from an interplay between genetic variants and environmental factors. It is increasingly clear that genes exert only a small or even no effect on the development of atopy on their own, and that they may act synergistically 1. To identify which genes contribute to the development of atopic disease by association analyses, a research strategy should be applied that is able to combine single nucleotide polymorphisms (SNPs) in multiple genes. A promising method designed for studying multifactorial diseases by computational algorithms is the multifactor dimensionality reduction (MDR) method 2.
A core feature of atopy is the presence of increased total serum immunoglobulin (Ig)E. A key control point for IgE synthesis and regulation is the necessity for co-stimulation to activate T-lymphocytes. T-lymphocytes recognise antigens by T-cell receptors binding to the antigen presenting major histocompatibility complex (MHC) class II molecules on antigen presenting cells (APCs). Subsequent cross-talk through co-stimulatory molecules integrating various positive and negative signals is necessary for differentiation and activation of the T-lymphocytes. Activated T-lymphocytes can direct an immune response and, when directed towards a T-helper-2 response, they induce B-lymphocytes to produce IgE. Due to their pivotal role in fine tuning T-lymphocyte differentiation and activation, genes encoding co-stimulatory receptors and ligands are promising candidate genes for atopic disease. Indeed, results of previous single candidate gene studies have suggested that polymorphisms in co-stimulatory genes, i.e. CD86 3, CD40 4, CTLA4 5, HLA-G 6, ICOS 7 and PDCD1 8, may influence susceptibility to atopic disease.
We hypothesised that polymorphisms in genes encoding co-stimulatory receptors and ligands influence susceptibility to elevated IgE levels. We evaluated haplotype tagging SNPs of co-stimulatory pathway genes in relation to serum IgE levels in a combined dataset of 3,062 children participating in three Dutch birth cohorts 9 at ages 1–2 yrs and 6–8 yrs. In addition to studying the main effects of these genes, we investigated two-, three- and four-locus gene–gene interaction with respect to serum IgE levels using MDR.
SUBJECTS AND METHODS
Study population
The Allergenic study 9 includes three prospective Dutch birth cohorts of similar design, i.e. PIAMA (Prevention and Incidence Asthma and Mite Allergy) 10, PREVASC (Prevention of Asthma in Children) 11, 12 and KOALA (Child, parents and health: lifestyle and genetic constitution) 13. Genetic studies were approved by local medical ethics committees of participating institutes. All parents provided written informed consent.
IgE measurements
Total IgE levels were determined in capillary or venous blood collected at age 1 and 8 yrs in PIAMA, age 1, 2, and 6 yrs in PREVASC, and age 1 and 2 yrs in KOALA (Sanquin Research, Amsterdam, the Netherlands). Total IgE levels were measured by radioimmunoassay as described previously 14–16 and expressed as IU·mL−1 (1 IU = 2.4 ng of IgE). Total IgE measurements were clustered at age 1–2 yrs and 6–8 yrs and analysed in tertiles (see supplementary material).
SNP selection and genotyping
Haplotype tagging SNPs were selected from the HapMap database 17 or from the Innate Immunity web site 18 depending on the largest number of SNPs with a minor allele frequency of >0.1 available in each database. Additionally, the biomedical literature was screened for SNPs within the candidate genes known to have functional impact or to be associated with asthma or atopy. Genomic DNA was extracted from buccal swabs or blood using standard methods 19. DNA was amplified by using REPLI-g UltraFast technology (QiagenTM; Venlo, Benelux BV, the Netherlands). Genotyping was performed by Competitive Allele-Specific PCR using KASParTM genotyping chemistry, performed under contract by K-Biosciences (Hertfordshire, UK). The quality of genotype data was guaranteed by standards of K-Biosciences and verified by comparing the genotyping results in genomic versus amplified DNA in a subset of children.
Statistical methods
All SNPs were analysed for Hardy–Weinberg equilibrium using Chi-squared statistics (p>0.01). We used Chi-squared tests to analyse whether genotypes in this pathway were associated with elevated serum IgE levels at 1–2 yrs and at 6–8 yrs (highest versus lowest tertile) by using a co-dominant model. For SNPs with a p-value <0.10, Akaike Information Criterion was evaluated to determine the best fitting genetic model (additive, dominant or recessive). Odds ratios and 95% confidence intervals were calculated by logistic regression analysis. SNPs located on the X-chromosome were analysed in males and females separately. Calculations were performed using SPSS 14.0 statistical software (SPSS Inc., Chicago, IL, USA) and considered significant if p<0.05 (two sided).
Haplotypes were constructed from the SNPs available in each gene and frequency distributions among cases and controls were estimated by the expectation-maximisation algorithm. Differences in these frequency distributions were evaluated by a log-likelihood ratio test (in house software). Since the haplotype tagging SNP selection uses multi-marker predictors to capture all information of the gene (i.e. aggressive tagging), we also analysed SNPs that were captured by multiple SNPs by constructing haplotypes.
Gene–gene interactions were analysed using MDR (version 1.0.0). The MDR approach has been described previously 20 (see online supplementary material). The significance of the average prediction error was calculated using the MDR permutation test and a p-value <0.05 was considered significant. Logistic regression analyses were performed to confirm significant two-way interaction results from MDR analyses, if the interaction term was significant (in a multiplicative model) the best fitting genetic model, e.g. dominant or recessive, was analysed.
RESULTS
Study population
In total, 3,062 children were genotyped and 2,927 Dutch children were selected for genetic analyses (table 1⇓). Children who were not from Dutch origin (5.7%) were excluded from further analyses because inclusion of non-Caucasians may result in spurious genetic effects due to population stratification. Cut-off values determined by tertiles of serum IgE (see online supplementary material) identified 503 cases and 541 controls at age 1–2 yrs, and 307 cases and 308 controls at age 6–8 yrs.
Characteristics of participating children in the Allergenic birth cohort
SNP selection and genotyping
145 SNPs of the following 24 genes relevant to co-stimulation were selected for genotyping (fig. 1⇓; table E2 in the supplementary material): VTCN1 (also named B7-H4/B7x); TNFRSF4 (OX40); TNFRSF18 (GITR); TNFRSF14 (HVEM); TNFSF18 (GITRL); TNFSF4 (OX40L); CD28; CTLA4; ICOS; PDCD1 (PD-1); BTLA; CD80 (B7-1); CD86 (B7-2); HLA-G; CD274 (B7-H1/PD-L1); PDCD1LG2 (PD2L); CD276 (B7-H3); LILRA4 (ILT7); LILRB1 (ILT2); LILRB2 (ILT4); LILRB4 (ILT3); CD40; ICOSLG; and CD40LG (CD40L). Five SNPs failed amplification; one SNP was monomorphic (rs7602383, ICOS). Genotypes for three SNPs, rs1181390 (CD28), rs9848900 (CD86) and rs7565639 (PDCD1), deviated from Hardy–Weinberg equilibrium in controls (at 1–2 yrs and/or at 6–8 yrs of age) and were not considered for further analyses leaving 136 SNPs for SNP and haplotype analysis. MDR analyses were performed with all 136 SNPs and a selection of 54 SNPs, after exclusion of 80 SNPs that were in linkage disequilibrium (LD; D'>0.8) with one or more SNPs (table E2 in the supplementary material).
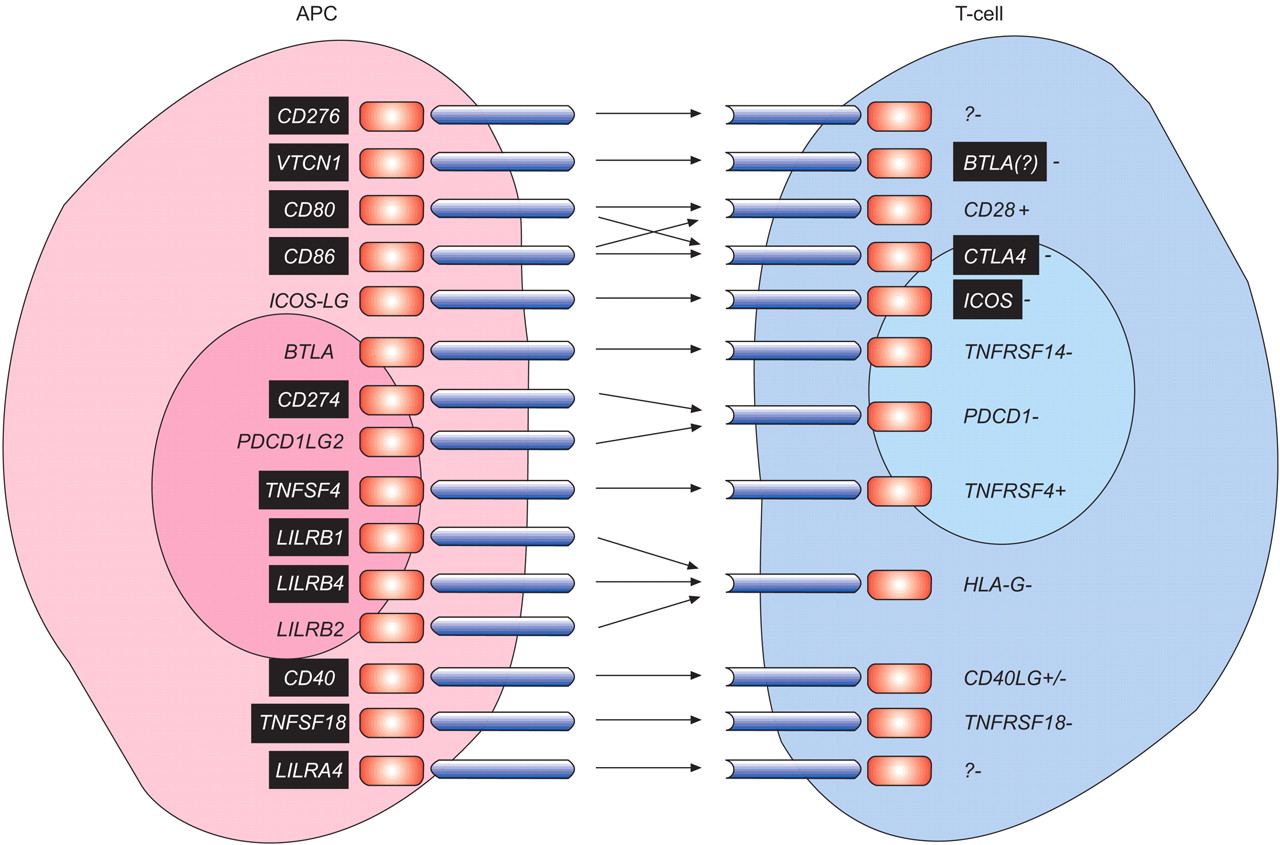
Hypothetical scheme of co-stimulatory receptor and ligand pairs evaluated in this study. The genes in back boxes indicate those that show association with serum immunoglobulin E. APC: antigen presenting cell; CD: cluster of differentiation; VTCN1: V-set domain containing T-cell activation inhibitor 1; ICOS-LG: inducible T-cell co-stimulator ligand; BTLA: B- and T-lymphocyte attenuator; PDCD1LG2: programmed cell death 1 ligand 2; TNFSF4: tumour necrosis factor (TNF) (ligand) superfamily, member 4; LILRB1: leukocyte immunoglobulin-like receptor (LILR) subfamily B (with TM and ITIM domains), member 1; LILRB4: LILR subfamily B (with TM and ITIM domains), member 4; LILRB2: LILR subfamily B (with TM and ITIM domains), member 2; TNFSF18: TNF (ligand) superfamily, member 18; LILRA4: LILR subfamily A (with TM domain), member 4; CTLA4: cytotoxic T-lymphocyte-associated antigen 4; ICOS: inducible T-cell co-stimulator; TNFRSF14: TNF receptor superfamily, member 14; PDCD1: programmed cell death 1; TNFRSF4: TNF receptor superfamily, member 4; HLA-G: HLA-G histocompatibility antigen class I-G; CD40LG : CD40 antigen ligand; TNFRSF18: TNF receptor superfamily, member 18; ?: receptor unknown; -: inhibitory signalling effect; +: positive signalling effect. Adapted from 21, 22.
Single SNP analysis
A total of eight SNPs in four genes were significantly associated with serum IgE at age 1–2 yrs at either the allele or genotype level, and 13 SNPs in seven genes at age 6–8 yrs (p<0.05; table 2⇓ and 3⇓). SNPs in CD40 and LILRA4 were associated with IgE in both age groups, but with different SNPs, i.e. rs3746821 and rs3745419 at age 1–2 yrs and rs3765459 and rs2241384 at age 6–8 yrs. Interestingly, the associated SNPs in both genes showed high LD (D' = 0.8 and r2 = 0.03 for both SNP combinations). None of the single SNP associations remained significant when corrected for multiple comparisons using false discovery rate (data not shown).
Single nucleotide polymorphisms significantly associated with increased serum immunoglobulin E at allele and genotype level at 1–2 yrs*
Single nucleotide polymorphisms significantly associated with increased serum immunoglobulin E at allele and genotype level at 6–8 yrs*
Haplotype analysis
We constructed haplotypes combining all tagging SNPs for each gene and haplotype that captured non-genotyped SNPs (table E3 in the supplementary material). One CD86 haplotype was significantly more prevalent in cases than controls at age 1–2 yrs (10% versus 6%, p = 0.01). This CD86 haplotype contains the haplotype that was constructed of rs2681415 and rs2681411 to tag the non-genotyped SNPs rs9872438 and rs2681408. The combined minor alleles of these SNPs were significantly more prevalent in cases compared with controls at age 1–2 yrs (12% versus 7%, p = 0.0002). Another haplotype, consisting of two minor alleles for ICOSLG rs2070561 and rs3746963, was less prevalent among cases compared with controls at age 6–8 yrs (16% versus 22%, p = 0.04).
MDR analysis
Table 4⇓ shows the best multi-locus models for elevated serum IgE detected by MDR when considering one, two, three, and four loci in all co-stimulatory genes. At age 1–2 yrs, the prediction error of each model was statistically significant (p = 0.03, p = 0.02, p = 0.02, and p = 0.02, respectively) based on 1,000 permutations. At 6–8 yrs, the two-, three-, and four-locus models showed statistical significance (p = 0.04, p = 0.02 and p = 0.01, respectively). At both ages, multiple synergistic interactions between SNPs were observed, as indicated by the red and orange colour in the dendrograms (fig. 2⇓).

Interaction dendrogram visualising the information gain (entropy based) associated with considering single nucleotide polymorphism (SNP) interactions in the co-stimulatory pathway at a) 1–2 yrs and b) 6–8 yrs of age. The colour of the line connecting pairs of SNPs indicates the degree of synergy (positive information gain), i.e. the SNPs combined provide a different (stronger or weaker) effect, or redundancy (negative information gain). The shorter the line the stronger the interaction. CD: cluster of differentiation; VTCN1: V-set domain containing T-cell activation inhibitor 1; BTLA: B- and T-lymphocyte attenuator; CTLA4: cytotoxic T-lymphocyte-associated antigen 4; LILRB4: LILR subfamily B (with TM and ITIM domains), member 4; LILRA4: LILR subfamily A (with TM domain), member 4; ICOS: inducible T-cell co-stimulator; TNFSF18: tumour necrosis factor (ligand) superfamily, member 18.
Results of multifactor dimensionality reduction analysis evaluating all co-stimulatory genes
The gene–gene interaction effects of the best two-locus models were confirmed by conventional logistic regression analysis. At age 1–2 yrs, the best two-locus model, i.e. rs10804556 (CD86) and rs12030415 (VTCN1), showed a dendrogram without synergistic effect (fig. 2a⇑). The information gain (entropy based) calculated for this pair of SNPs indicated redundancy, which may be interpreted as the two SNPs acting in parallel redundant ways to increase IgE. Logistic regression revealed that individuals with minor alleles of each SNP had an increased risk to develop an elevated serum IgE level, and this risk did not further increase in individuals having the minor alleles of both SNPs. A borderline statistically significant interaction existed between the SNPs in logistic regression analysis (p-value for interaction 0.058; fig. 3a⇓). At age 6–8 yrs, the dendrogram showing the relationship between rs4143815 (CD274) and rs2241384 (LILRA4) indicated synergistic interaction (fig. 2b⇑). Logistic regression revealed that individuals carrying one or two minor alleles of either SNP had a decreased risk to develop elevated serum IgE. In contrast, this decreased risk was not observed in individuals having one or two minor alleles of both SNPs, as indicated by a statistically significant interaction (p = 0.004 for interaction; fig. 3b⇓).

Two-locus associations between co-stimulatory molecules by logistic regression. a) The best two-locus model at 1–2 yrs of age. b) The best two-locus model at 6–8 yrs of age. Ig: immunoglobulin; CD: cluster of differentiation; VTCN1: V-set domain containing T-cell activation inhibitor 1; LILRA4: LILR subfamily A (with TM domain), member 4. #: p = 0.058 for interaction; ¶: p = 0.0001; +: p = 0.02; §: p = 0.002; ƒ: p = 0.004 for interaction; ##: p = 0.004; ¶¶: p = 0.0009; ++: p = 0.07.
Integrating analytical strategies
Table 5⇓ shows a summary of the single SNP, the multi-locus and the haplotype associations of the co-stimulatory pathway with IgE at age 1–2 and 6–8 yrs. When considering associations at a gene level, three genes, i.e. CD86, CD274 and LILRA4, showed significant associations with serum IgE at both ages 1–2 yrs and at 6–8 yrs. Three genes, i.e. BTLA, CTLA4 and VTCN1, showed association at 1–2 yrs of age, but not at 6–8 yrs. Another five genes, i.e. CD276, ICOS, LILRB4, TNFSF4 and TNFSF18, showed association at 6–8 yrs, but not at 1–2 yrs.
Summary of single and multi-locus associations in the co-stimulatory pathway at ages 1–2 yrs and 6–8 yrs
Interestingly, 12 SNPs, in the genes BTLA, CD40, CD80, CD86, CD274, CD276, CTLA4, LILRA4, LILRB4 and VTCN1 associated in multi-locus models and did not associate with IgE in the single SNP or haplotype analyses. Thus, multi-locus analyses by MDR identified gene variations that associated with elevated serum IgE without having a main effect.
DISCUSSION
This study evaluated single SNPs, haplotypes and multi-locus associations of haplotype tagging SNPs in a pathway of co-stimulatory genes and their association with the predisposition to elevated serum IgE levels at ages 1–2 and 6–8 yrs. We expand current knowledge by showing that within a biological pathway multiple gene combinations contribute to serum IgE levels. We found multiple multi-locus associations which showed statistical significance. One-, two-, three- and four-loci models were found to better predict the presence of elevated serum IgE than would be expected by chance. Some polymorphisms were not significantly associated when tested in a single SNP analysis, yet they were significantly associated in the multi-locus models. This stresses the importance of applying research strategies that model multiple interactions in genetic association studies.
It has been well established that multiple genes are involved in the predisposition to elevated serum IgE 1, 23–25. In comparison to other studies that used the MDR approach in atopic disease, we found many statistically significant multi-locus models 23–25. This is most likely because we evaluated genes in a biological pathway, whereas previous studies selected genes based on earlier reported associations with atopic disease.
Some of the evaluated genes have previously been described to associate with atopic phenotypes in single gene association studies, i.e. CD86 3, CD40 4, CTLA4 5, 26, HLA-G 6, ICOS 7 and PDCD1 8, yet other genes were found not to be associated with atopy such as CD28 5 and LILRB4 27. A summary of these association studies is presented in table E4 of the supplementary material. Herein, we confirm the main effects of the genes CD86, CD40 and ICOS with respect to serum IgE levels. In addition, we showed that LILRB4, which did not appear to have a main effect on IgE levels in single gene association studies 5, 27, does affect IgE levels in interaction with other gene polymorphisms. Although we did not find main effects for CTLA4, HLA-G and PDCD1, our results are not in contradiction with previous studies because the associated atopic phenotypes were different, e.g. specific IgE to grass pollen (PDCD1) or asthma and airway hyperresponsiveness (HLA-G), or the studies evaluated different subgroups of individuals, such as females (CTLA4) or an adult asthma population (CTLA4).
IgE production is known to increase during childhood and the influence of certain genes may be age specific 28. Therefore, we tested associations with IgE at two different age groups. The single- and multi-locus models were different between the age groups 1–2 and 6–8 yrs, suggesting that genes in this pathway indeed have age-specific effects on IgE development. However, in our unbiased approach, by applying MDR analysis, only the best models for each data set are given by MDR. Since multiple loci in this pathway may be associated with IgE development, these loci may compete with each other causing different results in each age group. Therefore, we conclude that MDR is not suitable for comparison between data sets in different age groups.
Of the interactions identified, MDR indicated that the type of interaction in most of the models was synergistic. The negative gene–gene interactions in the logistic regression of the two-locus models suggest that polymorphisms of these genes counteract each other's effect. This seems to be biologically plausible because, by counteracting effects of small genetic variations, the immune system would prevent itself from derailment by small genetic changes. Furthermore, biological interpretation of multi-locus models is rather speculative, but current data provide a first suggestion that activation of allergen-specific T-lymphocyte responses can take place by modifying co-stimulatory signals. Thus the genes under study are probably important homeostatic regulators of T-lymphocyte activation and subsequent IgE production.
Our results support the hypothesis that multiple gene–gene interactions are involved in IgE regulation by fine-tuning of lymphocyte responses. Activation of T-lymphocytes requires, besides T-cell receptor-MHCII/peptide complex recognition, additional secondary signals provided by co-stimulatory molecules expressed on APCs. The interaction between CD28 on T-lymphocytes and its two ligands B7-1 (CD80) and B7-2 (CD86) on APCs is considered to be the master co-stimulatory pathway for optimal T-cell responses 29. CD86 is constitutively expressed on APCs at low levels and rapidly upregulated upon stimulation, whereas CD80 is inducible and expressed later than CD86. In contrast to the stimulatory signals provided by CD28, interaction of CD80 or CD86 with the CD28 homolog CTLA-4 induces signals that downregulate T-cell activation. CTLA-4 is constitutively only expressed on CD4+CD25+ regulatory T-lymphocytes and is induced on activated T-lymphocytes, and CTLA-4 signalling plays an important role in regulating the intensity of allergic disease 30.
The strengths of our study are its large sample size and prospective follow-up, which enabled us to evaluate the influence of co-stimulatory pathway polymorphisms in two age groups that represent different stages of the developing immune system in early childhood and primary school age. The successful identification of important genetic mechanisms in the development of childhood atopy has previously been published in the Allergenic cohort 9, thus showing its high potential for genetic studies. Furthermore, the selection of haplotype tagging SNPs has made it very unlikely that we have missed important signals from genes.
To fully appreciate our results we should also consider some potential limitations to our study. First, environmental influences were not considered in our analyses. Several studies have shown that environmental influences can be of great importance in the development of atopy and we recommend considering these in future research. As a result of recruitment strategies, our study represents a selected population with a relatively high number of children with atopic parents and our results may not be fully representative of the general population. Secondly, the proportion of the cohorts that participated in each age group was variable, i.e. in age group 1–2 yrs all cohorts contributed to the IgE measurements whereas at age 6–8 yrs only IgE measurements of PREVASC and PIAMA could be evaluated. As a result, age groups may have been subject to different selection effects or variable environmental exposures and may, therefore, not be completely comparable. Therefore, it is important to note that several genes were associated with IgE at 1–2 yrs as well as 6–8 yrs, internally replicating our results.
None of the single SNP associations remained significant when corrected for multiple comparisons using false discovery rate. However, due to linkage disequilibrium between the evaluated single SNPs, the statistical tests performed are not completely independent and correction may be overly conservative. We tested the best models obtained from MDR analysis for significance based on 1,000 permutations. To assess if our results in the pooled cohorts at age 1–2 and 6–8 yrs were valid, we investigated whether we could replicate the observed two-way interaction in our separate cohorts. Indeed, we found a similar and significant interaction in two different cohorts at age 1–2 yrs in logistic regression analyses, with p-values for interaction being 0.008 and 0.03 for the PREVASC and KOALA cohort, respectively. We were unable to replicate the borderline significant interaction we observed in the full cohort at age 6–8yrs in the two separate cohorts. This interaction was observed in the PIAMA (n = 437) but not the PREVASC cohort that contained lower numbers of individuals (n = 130).
The SNPs found to be associated in this study were based on haplotype selection; hence their functional role is not clear. Furthermore, MDR is a new technique that can be considered as an unbiased data-mining approach. Thus, this study can be viewed as hypothesis generating. The selected important genes in the co-stimulatory pathway can now guide replication studies and functional analyses. This may ultimately lead to novel targets for early prevention of atopy development.
In conclusion, serum IgE levels are regulated by multiple gene–gene interaction effects of many genes in the co-stimulatory pathway. The genetic interactions we observed occur in a biologically plausible way. Our results implicate that investigation of genetic contribution to complex traits will not be possible without analytical approaches that consider effects of multiple interacting loci in one gene as well as in multiple genes.
Support statement
This study was financially supported by Zon-MW (grant number 912-03-031; the Hague, The Netherlands). G.H. Koppelman is supported by a Zon-Mw VENI grant (number 91656091).
Statement of interest
None declared.
Acknowledgments
The authors would like to thank the children and parents of the PIAMA, PREVASC and KOALA study for their participation. In addition, we acknowledge the field workers, secretaries and scientific collaborators dedicated to the PIAMA, PREVASC and KOALA cohorts, M. Bruinrnberg (Dept of Genetics, University Medical Center Groningen, University of Groningen, Gronigen, The Netherlands) for his advice on DNA isolation, processing and genotyping, I. Nolte (Dept of Epidemiology, University Medical Center Groningen, University of Groningen) for her advice on haplotype analyses, and A. van Oosterhout (Laboratory of Allergology and Pulmonology. Dept of Medical Biology and Pathology, University Medical Center Groningen, University of Groningen) for his advice on gene selection. We thank J.H. Moore (Dartmouth Medical School, Hanover, NH, USA) for his helpful comments to our questions with respect to MDR analyses.
Footnotes
-
This article has supplementary material accessible from www.erj.ersjournals.com
- Received February 4, 2009.
- Accepted June 11, 2009.
- © ERS Journals Ltd
References


