


Abstract
Glioblastoma multiforme (GBM) is a severe brain malignancy with limited treatment and dismal prognosis. The tumor suppressor PTEN, a major inhibitor of the phosphatidylinositol-3-OH kinase (PI3K)/Akt pathway, is frequently deleted in GBM tumors. PTEN antagonizes PI3K by dephosphorylating PI3K phosphoinositide substrates at the plasma membrane. The PTEN binding adapter protein NHERF1/EBP50 is overexpressed in GBM but its effects on tumorigenesis have yet to be determined. Here, we show that NHERF1 is localized to the plasma membrane in normal astrocytes and to the cytoplasm of GBM tumor cells. This cytoplasmic shift paralleled an altered membrane distribution of wild-type PTEN with consecutive Akt activation. Membrane re-targeting of NHERF1 in GBM cells recruited PTEN to the membrane and suppressed Akt activation and cell proliferation. Conversely, NHERF1 depletion in GBM cells with membrane-localized NHERF1 increased cell proliferation and Akt activation. Our findings define a tumor suppressor role for NHERF1 at the plasma membrane, and reveal a novel mechanism for PI3K/Akt activation through PTEN inactivation caused by a loss of membrane-localized NHERF1. Cancer Res; 70(17); 6697–703. ©2010 AACR.
Introduction
Glioblastoma multiforme (GBM), the most aggressive and frequent glioma form, may arise de novo, or secondary to the progression of lower grade astrocytomas (1). GBM is refractory to conventional treatment and has a 12- to 15-month median survival. The pathways amenable to targeted therapy are being uncovered in GBM, and one such pathway is the phosphatidylinositol-3-OH kinase (PI3K)/Akt. The PTEN tumor suppressor, the major inhibitor of the pathway, directly antagonizes PI3K by dephosphorylating phosphatidylinositol 3,4,5-trisphosphate (2), which then recruits Akt and unmasks its kinase domain through a conformational change (3). This allows Akt activation by Thr308 and Ser473 phosphorylation (4, 5). PTEN contains a phosphatase domain, a phospholipid-binding C2 domain, and a tail-region ending in a PDZ (PSD-95/Disc-large/ZO-1)–binding motif (6, 7). Through this motif, PTEN could bind and be recruited at the plasma membrane (PM) by PDZ domain proteins, including NHERF1/EBP50 (Na+/H+ exchanger regulatory factor/ezrin-radixin-moesin–binding phosphoprotein 50), Par-3, and membrane-associated guanylate kinase with inverted orientation proteins (8–10). NHERF1, an adaptor protein localized at the PM in physiologic conditions, consists of two tandem PDZ domains, of which PDZ1 binds to PTEN PDZ motif, and a COOH-terminal ezrin-radixin-moesin–binding region.
PTEN inactivation has been shown to occur by mutation and loss of heterozygosity in ∼20% to 40% of GBM tumors (11, 12) and in 77% of GBM cell lines (13). Recently, NHERF1 was reported to be overexpressed in GBM as well as being involved in GBM invasiveness (14). However, no mechanistic explanation was presented regarding the role of NHERF1 in GBM. We show that NHERF1, which is normally expressed at the PM in astrocytes, had shifted cytoplasmic expression in the majority of GBM tumors and cell lines. Mechanistically, this shift impairs PTEN recruitment at the PM and results in Akt activation. We thus reveal PTEN regulation in GBM by membrane-localized NHERF1, which cancer cells frequently evade by loss of membrane NHERF1.
Materials and Methods
Immunofluorescence and tissue microarray analysis
The protocol for immunofluorescence was described (15). The GBM tissue microarray processing is described in the Supplementary material.
Tumor fractionation
Frozen GBM tumor samples of ∼3 cm diameter were dissected in regions that were pretriturated with an 18-gauge needle in hypotonic buffer [10 mmol/L HEPES (pH 7.5), 10 mmol/L KCl, and 3 mmol/L MgCl2] and clarified at 600 × g for 30 seconds. The material from the supernatant was fractionated as described (16).
Cells, retroviral infections, protein analysis, proliferation assays, plasmids, and short hairpin RNAs
GBM cells, grown in DMEM supplemented with 10% fetal bovine serum, were obtained as follows: LN18, LN229, LN308, LN428 (Dr. Erwin van Meir, Department of Neurosurgery, Emory University, Atlanta, GA; 2004), U87-MG (American Type Culture Collection, 1998), U251-MG, U373-MG, D54 (Dr. T.J. Liu, Department of Neuro-Oncology, University of Texas M.D. Anderson Cancer Center, Houston, TX; 2003), and A172 (Dr. Brian Varnum, Inflammation Department, Amgen, Inc., Thousand Oaks, CA; 1998). They were tested and authenticated in October 2009 by the Cell Line Fingerprinting Core of the Brain Tumor Center at M.D. Anderson Cancer Center using short tandem repeat profiling with GenomeLab Human STR Primer Set (Beckman Coulter). The protocols for retroviral infection, cell lysis, Western blotting, and cellular fractionation were described (7, 8). The proliferation assay, antibodies, plasmids, and short hairpin RNAs are described in the Supplementary material.
Results
Membrane to cytoplasm redistribution of NHERF1 in GBM tumors
To explore the function of NHERF1 in GBM, we examined NHERF1 and PTEN expression in tissue microarrays containing normal adjacent brain, grade 3 anaplastic astrocytoma (AA), and grade 4 GBM samples (Fig. 1A). In normal brain, NHERF1 staining was mainly associated with the membrane of cells. We confirmed that these cells are astrocytes by double staining for NHERF1 and glial fibrillary acidic protein, a marker for astrocytes (Fig. 1B). NHERF1 localized especially to the membrane in astrocytic processes (Fig. 1A and B). In tumors, we observed two patterns of NHERF1 staining: reactive astrocyte–like, in which cells presented both cytoplasmic and membrane staining, and cytoplasmic-like, in which NHERF1 localized to the cytoplasm of tumor cells (Fig. 1A). The reactive astrocyte–like pattern was rare, being slightly more elevated in AA (18%) than in GBM (8.1%; Fig. 1A, top graph), indicating loss of membrane NHERF1 in the vast majority of GBM. PTEN costaining appeared mainly in the cytoplasm of cells in 35.3% AA and 59.5% GBM (Fig. 1A, bottom graph), perhaps indicating a tendency to upregulate PTEN in GBM. To correlate NHERF1 subcellular distribution with Akt activation, we fractionated various regions from frozen GBM tumors (Fig. 1C). NHERF1 was either lost or had predominant cytoplasmic distribution in the majority of the regions (Fig. 1D). Most importantly, the phosphorylated Akt levels inversely correlated with NHERF1 membrane levels (r = −0.917), suggesting that loss of membrane NHERF1 contributes to Akt activation.
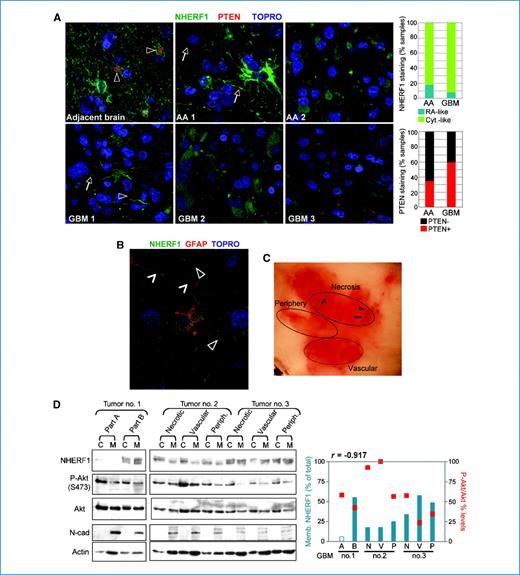
Cytoplasmic NHERF1 expression in GBM tumors. A, tissue microarray confocal microscopy (×400) with the indicated antibodies. NHERF1 localization in perivascular astrocytic processes (arrowheads) and membrane (arrows). Depending on NHERF1 localization, the AA (n = 17) and GBM (n = 37) samples were scored as reactive astrocyte (RA)–like (AA1 and GBM1) and cytoplasmic (Cyt.)–like (AA2 and GBM2). Tumors were considered PTEN-positive (GBM3) if at least two PTEN-positive cells were present in a field. B, confocal microscopy (×600) of normal brain shows NHERF1 membrane localization in astrocytic processes (open arrowheads), including those surrounding brain capillaries (closed arrowheads). C, photograph of a frozen GBM tumor divided into regions containing either necrotic (arrowheads), vascularized, or peripheral tissue. D, Western blot analysis with indicated antibodies of cytoplasmic (C) and membrane (M) fractions prepared from various tumor regions. Tumor no. 1, with unclear regional distinction, was divided into parts A and B. N-cadherin (N-cad) is a membrane fractionation marker. The graph shows the correlation between NHERF1 membrane levels (blue bars) and Akt Ser473 phosphorylation (red squares). r = −0.917, Pearson correlation coefficient for the seven samples with detectable NHERF1 levels. ImageJ program was used for densitometric analysis: NHERF1 cytoplasmic and membrane levels normalized to actin, were summed, and the membrane (Memb.) fraction (%) was calculated from the sum; P-Akt cytoplasmic levels were normalized to total Akt levels (P-Akt/Akt).
Cytoplasmic NHERF1 expression in GBM tumors. A, tissue microarray confocal microscopy (×400) with the indicated antibodies. NHERF1 localization in perivascular astrocytic processes (arrowheads) and membrane (arrows). Depending on NHERF1 localization, the AA (n = 17) and GBM (n = 37) samples were scored as reactive astrocyte (RA)–like (AA1 and GBM1) and cytoplasmic (Cyt.)–like (AA2 and GBM2). Tumors were considered PTEN-positive (GBM3) if at least two PTEN-positive cells were present in a field. B, confocal microscopy (×600) of normal brain shows NHERF1 membrane localization in astrocytic processes (open arrowheads), including those surrounding brain capillaries (closed arrowheads). C, photograph of a frozen GBM tumor divided into regions containing either necrotic (arrowheads), vascularized, or peripheral tissue. D, Western blot analysis with indicated antibodies of cytoplasmic (C) and membrane (M) fractions prepared from various tumor regions. Tumor no. 1, with unclear regional distinction, was divided into parts A and B. N-cadherin (N-cad) is a membrane fractionation marker. The graph shows the correlation between NHERF1 membrane levels (blue bars) and Akt Ser473 phosphorylation (red squares). r = −0.917, Pearson correlation coefficient for the seven samples with detectable NHERF1 levels. ImageJ program was used for densitometric analysis: NHERF1 cytoplasmic and membrane levels normalized to actin, were summed, and the membrane (Memb.) fraction (%) was calculated from the sum; P-Akt cytoplasmic levels were normalized to total Akt levels (P-Akt/Akt).
NHERF1 cytoplasmic localization in PTEN-positive GBM cells correlates with Akt activation and altered PTEN membrane localization
We investigated the subcellular distribution of NHERF1 in a panel of GBM cell lines and observed that depending on PTEN status, distinct patterns of NHERF1 intracellular localization were apparent (Fig. 2A). In PTEN-negative cell lines, NHERF1 was localized in both cytoplasmic and membrane compartments. In PTEN-positive cell lines, NHERF1 was either predominantly expressed in the cytoplasm, in LN18 and LN428 cells, or in the membrane, in LN229 cells.

NHERF1 cytoplasmic shift correlates with defective Akt suppression in PTEN-positive GBM cells. A, NHERF1 membrane-cytoplasmic fractionation in GBM cell lines. Erk2 and N-cadherin are cytoplasmic and membrane fractionation markers, respectively. Membrane (M) and cytoplasmic (C) distributions (%) were calculated as in Fig. 1D. The corresponding PTEN status and Akt activation levels are indicated. B, Western blot of protein extracts from three PTEN-positive and three PTEN-negative GBM cell lines. PTEN levels normalized to actin (blue squares) were superimposed on P-Akt S473/Akt levels (red bars). C, deconvolution microscopy (×400) showing endogenous PTEN reaching the PM only in LN229 cells. U87 cells were used as PTEN-negative controls.
NHERF1 cytoplasmic shift correlates with defective Akt suppression in PTEN-positive GBM cells. A, NHERF1 membrane-cytoplasmic fractionation in GBM cell lines. Erk2 and N-cadherin are cytoplasmic and membrane fractionation markers, respectively. Membrane (M) and cytoplasmic (C) distributions (%) were calculated as in Fig. 1D. The corresponding PTEN status and Akt activation levels are indicated. B, Western blot of protein extracts from three PTEN-positive and three PTEN-negative GBM cell lines. PTEN levels normalized to actin (blue squares) were superimposed on P-Akt S473/Akt levels (red bars). C, deconvolution microscopy (×400) showing endogenous PTEN reaching the PM only in LN229 cells. U87 cells were used as PTEN-negative controls.
Similarly to GBM tumors, in PTEN-positive cells, NHERF1 membrane levels were inversely correlated with phosphorylated Akt levels (Fig. 2B). In cells with cytoplasmic NHERF1, Akt activation was also translated to downstream effectors, such as p70S6K. Because NHERF1 associates with PTEN (8), these results suggested that PTEN is fully active at the PM to suppress Akt only in LN229 cells that express membrane NHERF1. Analysis of endogenous PTEN revealed cytoplasmic staining reaching the PM in LN229 cells and restricted perinuclear staining in LN18 and LN428 cells (Fig. 2C), supporting defective PTEN membrane recruitment in cells with cytoplasmic NHERF1. Indeed, the expression of membrane-targeted Myr-PTEN in LN18 cells completely suppressed Akt activation and strongly inhibited proliferation in comparison with wild-type PTEN, indicating the presence of a PTEN membrane recruitment deficit in these cells (Supplementary Figure).
NHERF1 membrane expression redistributes PTEN to the membrane and suppresses Akt and GBM cell proliferation
To show that NHERF1 membrane expression has suppressive effects on Akt activation and cell growth, we reconstituted LN18 and LN428 cells that express cytoplasmic NHERF1 with a membrane-targeted Myr-NHERF1 form. We confirmed that Myr-NHERF1 displayed PM localization, whereas control overexpressed NHERF1 had diffuse localization in all cell compartments (Fig. 3A). Coexpression of Myr-NHERF1 with wild-type PTEN redistributed PTEN to the PM (Fig. 3B), indicating PTEN membrane recruitment by membrane-localized NHERF1. We next examined whether the observed PTEN membrane recruitment is followed by Akt suppression. In both cell lines, Myr-NHERF1 reduced phosphorylated Akt levels (Fig. 3C). Overexpressed control NHERF1 determined a less pronounced effect, most likely due to partial membrane localization. The variable Akt suppression following Myr-NHERF1 expression might result from differences in endogenous PTEN recruitment due to PTEN tail-region phosphorylation that inhibits NHERF1 binding (8). Consistent with the effects on Akt, Myr-NHERF1 specifically decreased proliferation in LN18 and LN428 cells, whereas it had no effect in LN229 cells that expressed endogenous membrane-localized NHERF1 (Fig. 3D). These data suggested a growth suppressor function for NHERF1 at the membrane through Akt suppression.

Membrane-localized NHERF1 recruits PTEN at the PM and suppresses Akt and cell growth. A, immunofluorescence (×400) of LN18 and LN428 cells stably overexpressing wild-type NHERF1 and Myr-NHERF1. Arrowheads, NHERF1 PM localization. B, deconvolution microscopy (×400) of LN18 cells coexpressing Myc-tagged wild-type PTEN and either vector or Myr-NHERF1. C, Western blot of lysates from LN18 and LN428 cells overexpressing wild-type NHERF1 and Myr-NHERF1. P-Akt/Akt values were plotted as a percentage from the basal values of vector control cells. D, MTT proliferation assay of LN18, LN428, and LN229 cells expressing vector, wild-type NHERF1, and Myr-NHERF1. Experiments were repeated twice with similar results. Points, mean from experiments performed in triplicate; bars, SEM (*, P < 0.05).
Membrane-localized NHERF1 recruits PTEN at the PM and suppresses Akt and cell growth. A, immunofluorescence (×400) of LN18 and LN428 cells stably overexpressing wild-type NHERF1 and Myr-NHERF1. Arrowheads, NHERF1 PM localization. B, deconvolution microscopy (×400) of LN18 cells coexpressing Myc-tagged wild-type PTEN and either vector or Myr-NHERF1. C, Western blot of lysates from LN18 and LN428 cells overexpressing wild-type NHERF1 and Myr-NHERF1. P-Akt/Akt values were plotted as a percentage from the basal values of vector control cells. D, MTT proliferation assay of LN18, LN428, and LN229 cells expressing vector, wild-type NHERF1, and Myr-NHERF1. Experiments were repeated twice with similar results. Points, mean from experiments performed in triplicate; bars, SEM (*, P < 0.05).
Depletion of membrane-localized NHERF1 increases cell growth and Akt activation
In reciprocal experiments, we depleted NHERF1 from LN229 cells that express membrane-localized NHERF1 and from control LN18 cells that express cytoplasmic NHERF1 (Fig. 4A). Cell proliferation was significantly increased by NHERF1 depletion from LN229 but not from LN18 cells, suggesting that NHERF1 acts as a tumor suppressor at the membrane and its cytoplasmic shift might have the same effect on cell proliferation as its depletion. NHERF1 depletion in LN229 cells led to a 2-fold Akt activation in both basal and stimulated conditions (Fig. 4B), confirming that membrane NHERF1 depletion activates Akt in GBM cells. However, Akt activation following NHERF1 depletion seemed moderate. To assess how well endogenous PTEN suppresses Akt, we also depleted PTEN in the same cells (Fig. 4C). Efficient PTEN knockdown resulted in a similar 2-fold Akt activation (Fig. 4C), indicating comparable patterns of Akt activation in cells lacking either PTEN or membrane NHERF1.

Knockdown of membrane-localized NHERF1 increases proliferation and Akt activation. A, the percentage of depletion (% dep.) is indicated for knockdown NHERF1 levels normalized to glyceraldehyde-3-phosphate dehydrogenase (GAPDH). The proliferation of vector-control and NHERF1-depleted cells was performed with two different NHERF1 short hairpin RNAs (sh4) and repeated three times with similar results. Points, mean from experiments performed in triplicate; bars, SEM (**, P < 0.01). B, time course stimulation of NHERF1-depleted and control cells with 10% fetal bovine serum. Columns, mean P-Akt/Akt values from two experiments; bars, SEM (*, 0.0047< P < 0.032). C, time course stimulation of PTEN-depleted and control cells as in (B). Columns, mean P-Akt/Akt values calculated from three experiments; bars, SEM (*, 0.0016 < P < 0.016). D, model depicting NHERF1 regulation of PTEN in normal and transformed cells. Dotted line, less efficient Akt suppression by PTEN in the absence of membrane NHERF1.
Knockdown of membrane-localized NHERF1 increases proliferation and Akt activation. A, the percentage of depletion (% dep.) is indicated for knockdown NHERF1 levels normalized to glyceraldehyde-3-phosphate dehydrogenase (GAPDH). The proliferation of vector-control and NHERF1-depleted cells was performed with two different NHERF1 short hairpin RNAs (sh4) and repeated three times with similar results. Points, mean from experiments performed in triplicate; bars, SEM (**, P < 0.01). B, time course stimulation of NHERF1-depleted and control cells with 10% fetal bovine serum. Columns, mean P-Akt/Akt values from two experiments; bars, SEM (*, 0.0047< P < 0.032). C, time course stimulation of PTEN-depleted and control cells as in (B). Columns, mean P-Akt/Akt values calculated from three experiments; bars, SEM (*, 0.0016 < P < 0.016). D, model depicting NHERF1 regulation of PTEN in normal and transformed cells. Dotted line, less efficient Akt suppression by PTEN in the absence of membrane NHERF1.
Discussion
The PI3K/Akt pathway has become an important target for anticancer therapy because of its constitutive activation in a wide variety of cancers. PTEN is the pathway suppressor most frequently altered in cancers. In particular, PTEN-inactivating mutations occur at a high rate in GBM (11, 12), leading to PI3K/Akt pathway activation. We show that PTEN may be additionally inactivated in GBM by mislocalization of NHERF1, a PTEN-binding adapter protein (8). NHERF1 has PM localization in normal cells (17), including astrocytes. Remarkably, NHERF1 is shifted to the cytoplasm in the majority of GBM tumors and cell lines, and we show that the oncogenic effect of NHERF1 membrane loss is due to PTEN displacement from the membrane with consecutive Akt activation (Fig. 4D). Interestingly, in overexpression experiments, the PDZ motif of PTEN is dispensable for GBM growth suppression (7). Thus, the interaction between PTEN and NHERF1 might not be the only factor involved in PTEN activity. Another mechanism may arise from stochastic association-dissociation events between PTEN molecules localized in the cytoplasmic pool and the PM, depending on PTEN conformation states determined by phosphorylation (ref. 18; Fig. 4D). In this case, the presence of membrane-localized NHERF1 might act synergistically to suppress Akt by increasing PTEN association with the PM.
The NHERF1 gene locus at 17q25.1 suffers frequent allelic loss in breast and ovarian cancers, and NHERF1 mutations with loss of heterozygosity have been described in 3% of invasive breast carcinomas (19). NHERF1 loss or cytoplasmic overexpression has been observed in breast cancer cells (17), raising the possibility that NHERF1 intracellular shift might represent a more general oncogenic mechanism. Using a combination of NHERF1 membrane-targeting and membrane depletion experiments in GBM cells with cytoplasmic or membrane endogenous NHERF1, we unequivocally showed that NHERF1 behaves as a tumor suppressor when localized at the PM. Aside from the effects on the PI3K/Akt pathway, other oncogenic influences determined by NHERF1 membrane loss might arise in tumor cells from either disruption of membrane complexes or formation of aberrant cytoplasmic or nuclear complexes between mislocalized NHERF1 and other proteins, such as β-catenin (20). Indeed, β-catenin transcriptional activity is enhanced either by NHERF1 loss (16) or by NHERF1 intracellular shift (20), and other oncogenic mechanisms, perhaps related to ezrin-radixin-moesin proteins, might also be activated during NHERF1 intracellular shift.
In summary, we propose a model in which membrane-localized NHERF1 in normal cells contributes to PTEN membrane recruitment, whereas NHERF1 cytoplasmic redistribution in cancer cells alters the regulation of PTEN at the PM. This novel mechanism attributes to NHERF1 a key role in regulating the PI3K/Akt pathway and opens the avenue for establishing prospective markers of tumor progression and PI3K-targeted therapy.
Disclosure of Potential Conflicts of Interest
No potential conflicts of interest were disclosed.
Acknowledgments
Grant Support: NCI-CA107201 (M-M. Georgescu) and NCI-CA16672 for DNA sequencing.
The costs of publication of this article were defrayed in part by the payment of page charges. This article must therefore be hereby marked advertisement in accordance with 18 U.S.C. Section 1734 solely to indicate this fact.