
Abstract
The role of the applied potential to the electrodeposition process of ZnO onto flexible polymeric substrates was investigated. ZnO nanostructures were prepared on indium-tin oxide conducting flexible substrates, using the electrodeposition method at 70°C in a zinc nitrate electroplating bath for different deposition potential, Edep, which has been divided in three distinct regions named as A, B and C. Chronoamperometric analysis reveals that the nucleation growth mechanism is strongly affected by the deposition conditions. The analysis of the current–time transients indicates that the ZnO electrodeposition occurs by progressive three-dimensional nucleation with diffusion-controlled growth in region B, −1000 < Edep< −1200 mV. For −700 < Edep < −1000 mV (region A), it is assumed that the electrodeposition process is mainly controlled by the slowest kinetic electroreduction of dissolved oxygen and nitrate ions resulting a low nucleation rate. Furthermore, in region C, related to more negative applied potentials, the electrodeposition process is conditioned by the substrate stability. The kinetic parameters values obtained from the diffusion controlled model are in good accordance to the dimensionless analysis of the transients. X-ray diffraction analysis confirmed the formation of (002) textured ZnO structures prepared in regions B and C.
Export citation and abstract BibTeX RIS
ZnO crystallizes preferentially in the hexagonal wurtzite-type structure and is a wide-gap semiconductor with a direct gap around 3.4 eV and a large exciton binding energy (60 meV).1,2 It has been cited as a versatile material for a variety of technological applications, namely as sensors, photovoltaic cells, light-emitting diodes.3 A variety of ZnO nanostructures have been reported, among them the 1D ZnO arrays attracting intensive research.4 According to the literature several techniques could be used for the preparation of these structures.5–7 Electrodeposition is one of the widely used techniques due to its simplicity, low cost requirements and versatility,8,9 offering a multiple set of variables that allows the tailoring of the films according to the needs.
The nucleation and the early stages of layer growth are of fundamental and theoretical interest for the technological applications. It is well accepted that the association of different techniques, namely, chronoamperometry and ex-situ scanning electron microscopy, is very useful for the understanding of the mechanism and kinetics of the early stages of material deposition.10 The transient's analysis provides powerful information on the nucleation and growth mechanisms and kinetics,11 which can be complemented by morphological techniques. The interpretation of the current-time transients for inorganic solid deposition is developed by using different established theoretical models. Hyde and Compton reviewed the subject in 2003.12 More recently the contribution of secondary redox processes occurring simultaneously with electrodeposit nucleation and growth and its effects on the shape of the transients has been discussed.13,14 Nucleation and growth can be broadly classified into two categories: 'interfacial (or charge) controlled', in which the nucleus growth rate is limited by the rapidity with which ions can be incorporated into the new phase, and 'diffusion controlled', in which the nucleus growth is limited by the rate at which material is transported through the solution to the electrode surface. The former is favored by high concentrations and low deposition overpotentials, while the latter is favored by low concentrations and high overpotentials.12
Over the recent decades, several published works report studies concerning the ZnO eledeposition. ZnO cathodic electrodeposition is usually based on generation of a local high pH near the electrode surface which induces precipitation of Zn2+ ions present in solution.15 It has been found that the ZnO electrodeposition mechanism is affected by substrate nature, deposition temperature, zinc precursor and dissolved oxygen presence.16–23 Furthermore, to our knowledge, the study of the ZnO electrodeposition mechanism on flexible conducting substrate is still scarce or even inexistent.24
Regarding the multiple technological applications of this promising semiconductor material on flexible devices25,26 it is of greatest importance the comprehension of its formation at low temperatures since the polymeric substrates are not stable at temperatures higher than 150°C27,28 which prevents the implementation of a subsequent heat-treatment on ZnO electrodeposits.
In this work, ZnO nanostructures were prepared using the potentiostatic method in order to obtain deeper information concerning the deposition mechanism and kinetics process. Consequently, the prime aim is the study of the influence of the potential deposition in the nucleation-growth process and morphological and structural characteristics of the ZnO nanostructures in early deposition stages, on ITO/flexible substrate using zinc nitrate aqueous solution at 70°C. To further explore the systematic comprehension of the ZnO electrodeposition cyclic voltammetric, chronoamperometric and field-emission scanning electron microscopy (FEG-SEM) techniques were used.
Experimental
For the ZnO nanostructures preparation, an electroplating bath made up of 10 mM Zn(NO3)2.6H2O (Sigma-Aldrich, 98.0%), and 5 mM KCl (Sigma-Aldrich, p.a.) was used. The bath pH was 5.5. The solutions were made daily using analytical grade reagents without further purification. The electrochemical cell was a single compartment glass cell with a graphite bar as counter electrode and a commercial Ag/AgCl (saturated KCl) reference electrode. The working electrodes were indium-tin oxide, ITO (In2O3 (90%) + SnO2 (10%)) coated flexible polymeric (polyethylene terephthalate) substrates PET/ITO with 0.2 cm2 active area (Sigma-Aldrich, resistivity 60 Ω/Ł). The substrates were degreased with acetone and ethanol followed by ultrasonic cleaning for 10 min with Millipore Milli-Q ultra-pure water (18 MΩ cm). The ZnO nanostructures were prepared by application of different deposition potential for 180 s in stagnant solutions, at 70°C under aerated solution. Voltammetric studies were performed at a scan rate of 10 mV s−1 in order to establish the electrochemical behavior of the system ITO/Zn(NO3)2 under aerated and deaerated solutions at 70°C. For deaerated essays, nitrogen gas was bubbled through the solution for 15 min before the electrochemical studies. The experiments were carried in a three-electrode glass cell with a platinum spiral as counter electrode and a commercial Ag/AgCl (saturated KCl) as reference electrode. All potentials are reported with respect to this reference. For comparison the system ITO/KNO3 was also studied.
The electrochemical measurements were carried out using a Gamry potentiostat/galvanostat/ZRA REF 600, with automatic data acquisition. The transient analysis was performed through non-linear least square procedure based on Levenberg-Marquart algorithm using Origin commercial software.
The films morphology and elemental composition were investigated by field-emission scanning electron microscopy (FEG-SEM JEOL 7001F), with an electron beam voltage of 15 kV. X-ray diffraction (XRD) analysis of the electrodeposits was carried out using a Philips X-ray diffractometer (model PW 1710) with Cu Kα radiation. The diffractograms were obtained in the 2θ range of 20 to 50°, using a 0.02° step and acquisition time of 2 s/step.
Results and Discussion
Cyclic voltammetry
Figure 1 shows the cyclic voltammograms recorded for PET/ITO in Zn(NO3)2 solution with different switching potentials under deareted conditions at 70°C. For comparison purposes results obtained with KNO3 are also shown.
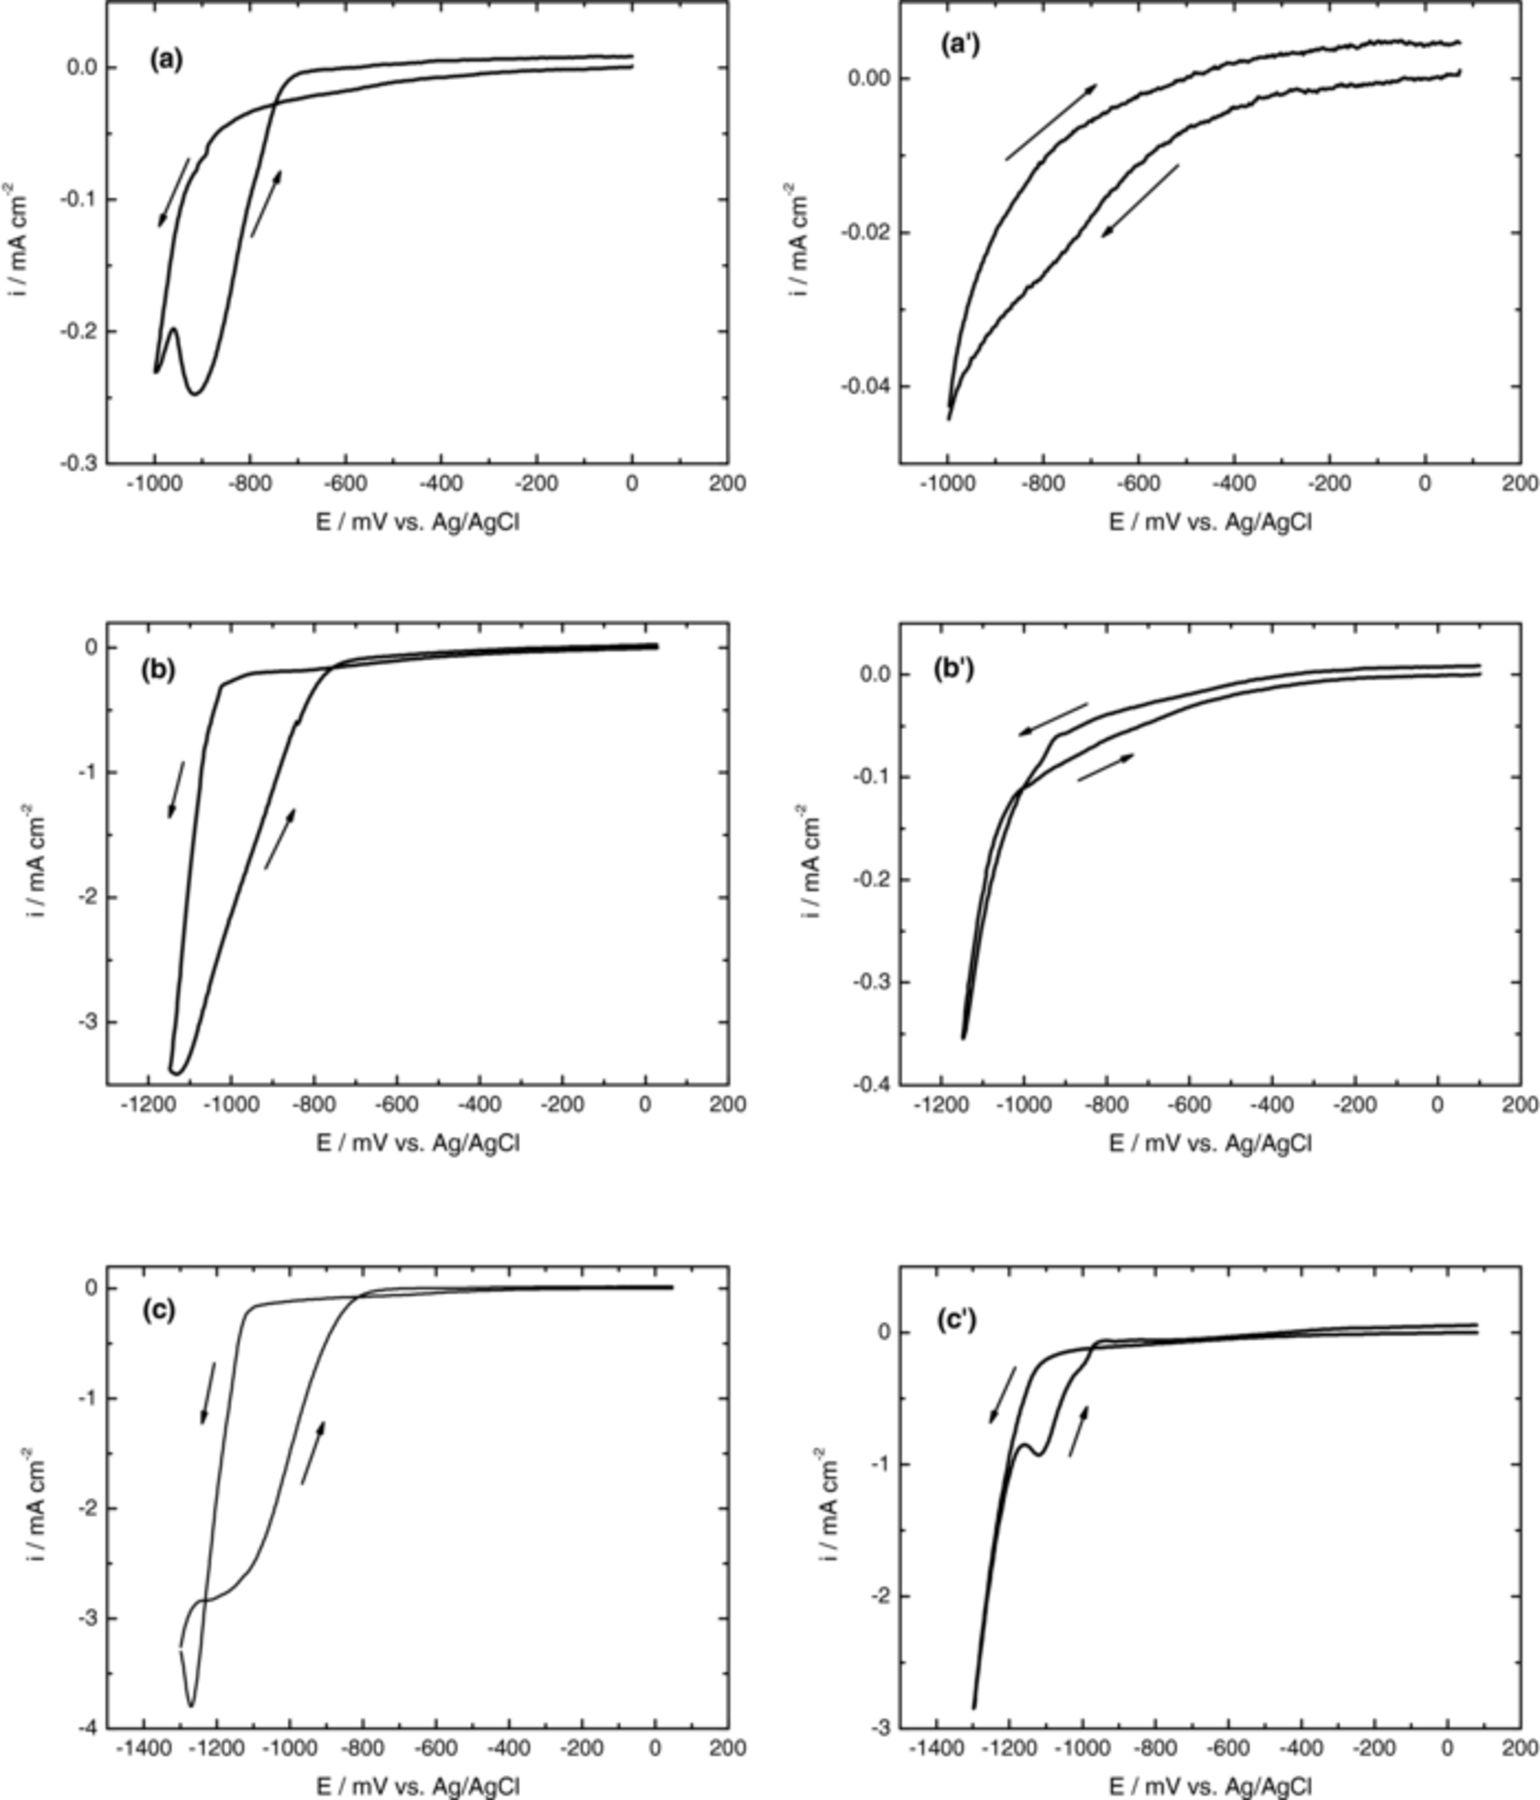
Figure 1. (a), (b) and (c) Cyclic voltammograms obtained for a PET/ITO electrode from solutions containing 10 mM Zn(NO3)2 and 5 mM KCl at 70°C. (a'), (b') and (c') Cyclic voltammograms obtained for a PET/ITO electrode from solutions containing 10 mM KNO3 and 5 mM KCl at 70°C. The potential was switched between the ocp value and (a), (a') −1000; (b), (b') −1150 and (c), (c') −1300 mV. Scan rate 10 mVs−1. Before each experiment, the solutions were deaerated with N2 for 15 min.
The voltammograms main feature is the abrupt increase of cathodic current density for potentials more negative than c.a. −800 mV. This behavior was attributed to the reduction of NO3− ions with formation of OH− ions which is promoted by the presence of Zn2+ in solution as can be seen when the curves obtained in absence and presence of zinc ions are compared. The beneficial effect of Zn2+ ions in the nitrate ions reduction process has been previously reported in literature.23,29 One reason for this trend could be related to the Zn2+ adsorption on the substrate surface which increases the surface conductivity. Moreover, some authors assumed that the increase of current after −1000 mV vs. SCE can be due to the Zn2+ reduction to Zn metallic.30 In this potential region the hydrogen evolution might also occurs however no evidence was shown. In addition, the cyclic voltammogram recorded for the system PET/ITO/Zn(NO3)2 with the most negative switching potential limit, Figure 1c, presents a well defined peak, suggesting that nitrate ions reduction is diffusion controlled which was confirmed by the linear relationship between i and v1/2. Upon the sweep reversal, current crossover occurs for the solution composed by Zn(NO3)2 indicating the formation of stable growth centers, at the substrate surface,31 Figures 1a, 1b and 1c. The current loop, completely observed in Figure 1c, indicates that ZnO deposition occurs preferential onto ZnO structures than to the ITO substrate.
In the anodic region it is not observed any peak or shoulder which points out to the absent formation of metallic zinc. This aspect reinforces the assumption that the current crossover observed is due to the formation of Zn(OH)2 with subsequent formation and growth of ZnO nucleus. In addition, Khajavi et al.29 reported that the reduction of Zn2+ ions occurs for cathodic switching potentials more negative than −1500 mV vs. SCE, which is in accordance to results obtained by us for room temperature ZnO electrodeposition onto Glass substrate/FTO.32
As already indicated the voltammetric behavior of system PET/ITO/KNO3 is quite different from the system PET/ITO/Zn(NO3)2, showing in general smaller current density values, Fig 1a'), b') and c'). For expanded potential range, figures 1b') and c'), it is also observed a crossover current at −1000 mV. To explain this unexpected result the reduction of metallic components of ITO, namely Sn (IV) or In (III) was considered.
To prove this hypothesis, a multicycling study with PET/ITO/KNO3 system was performed. After 5 cycles recorded between 100 and −1300 mV, it is visible the formation of a dark film on the substrate. According to the data obtained by X-ray diffraction, this film is composed by metallic indium (JCPDS file 5–642), as can be seen in the Fig 2. In conclusion, the current crossover observed in PET/ITO/KNO3 system was attributed to the reduction of indium oxide (ITO) to metallic indium. Surprisingly other authors assumed that potentials more negative than −1.4 V promote the electrochemical reduction of Sn(IV)33 without mention the stability of In2O3.
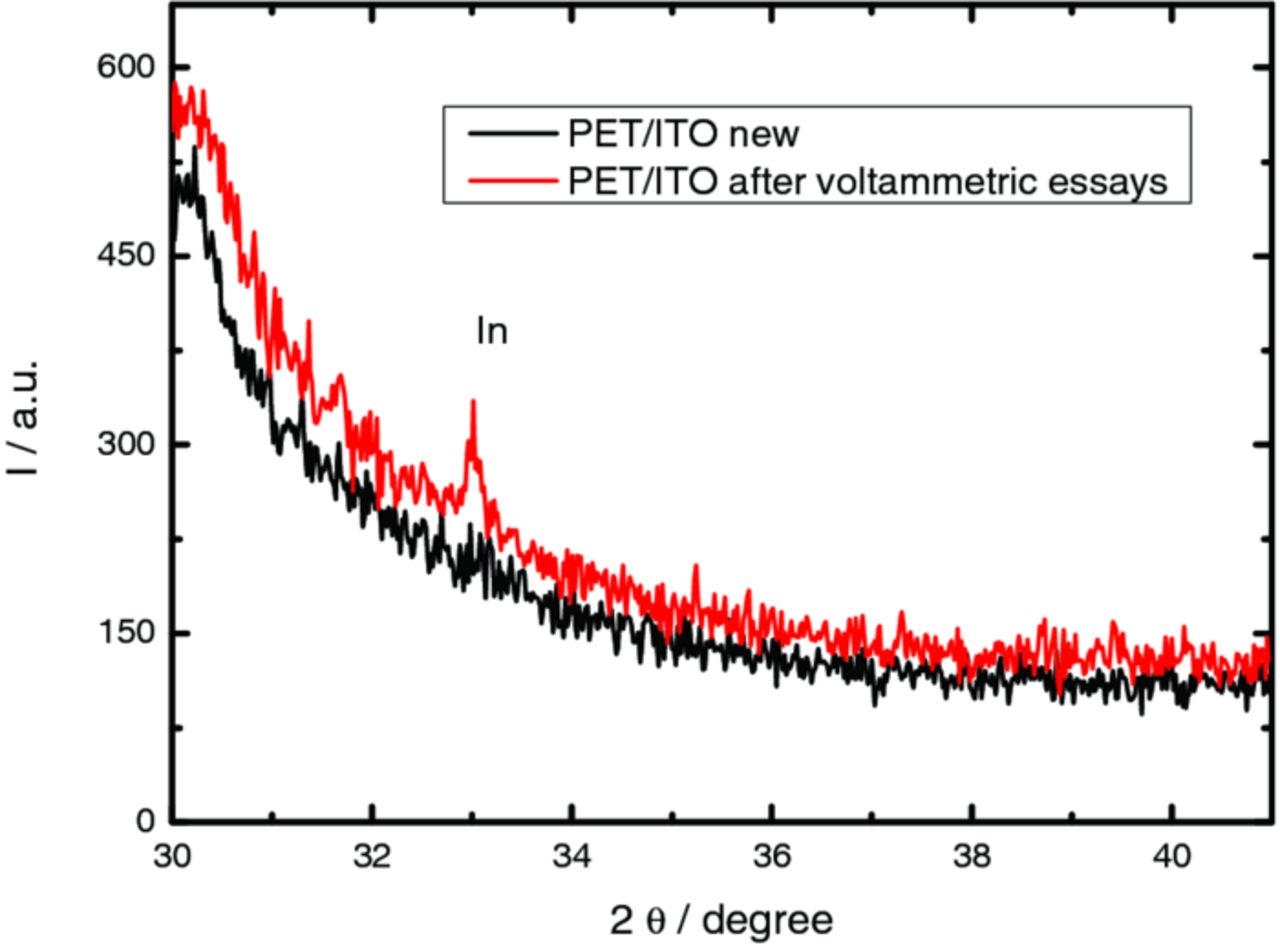
Figure 2. XRD diffraction patterns obtained for a new PET/ITO electrode and a PET/ITO electrode after being voltammetric cycled in KNO3 solution.
Under aereted conditions an additional cathodic shoulder is observed with system ITO/Zn(NO3)2 as well as ITO/KNO3 between −400 and −1000 mV, Figure 3a and 3b, related to the dissolved oxygen reduction, Eq. 1. Both curves report low cathodic current values suggesting that the reduction rate of dissolved oxygen is slow due to the weak solubility of O2 as well as to its low diffusion rate in solution.3
![Equation ([1])](https://content.cld.iop.org/journals/1945-7111/160/10/D476/revision1/jes_160_10_D476eqn1.jpg)
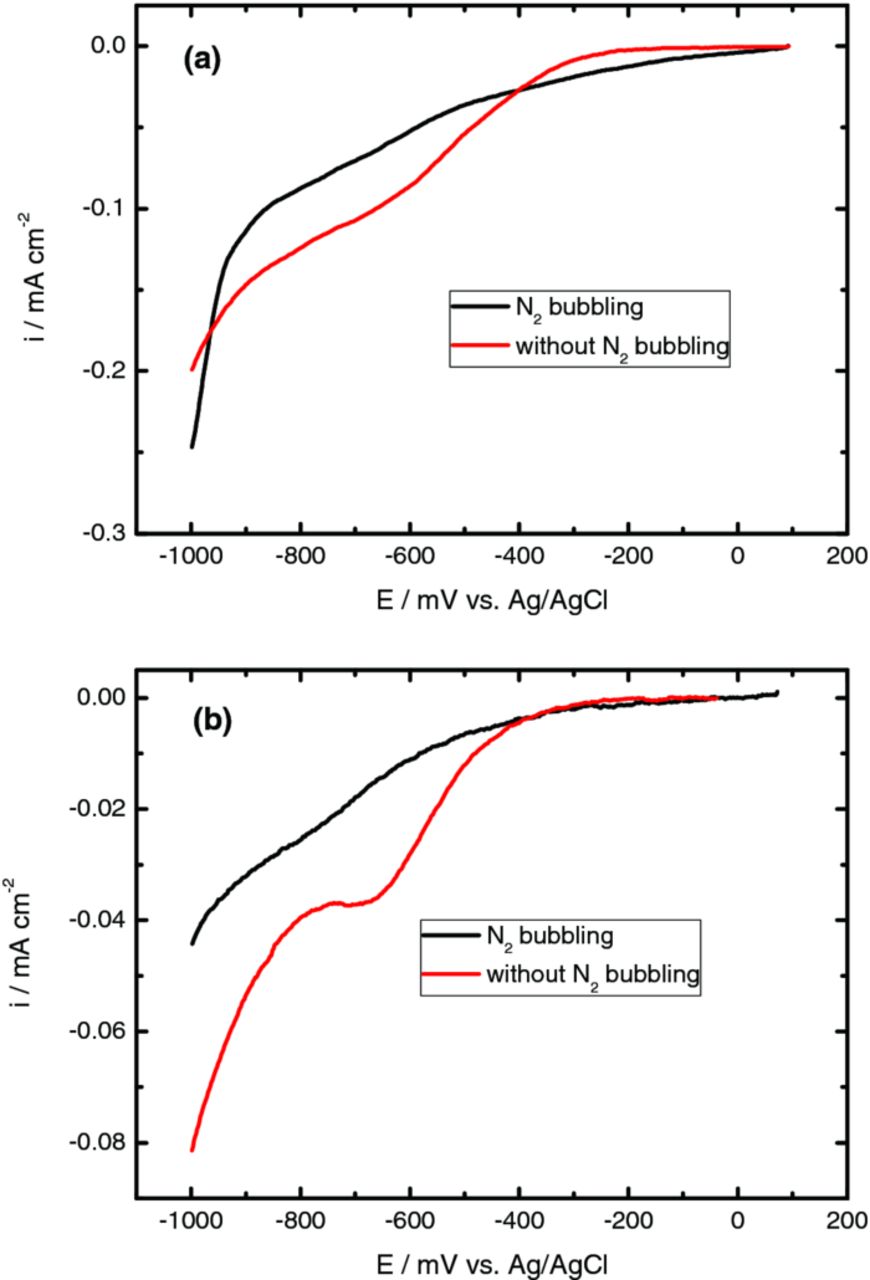
Figure 3. Cyclic voltammograms obtained for a PET/ITO electrode from solutions containing (a) 10 mM Zn(NO3)2 and 5 mM KCl and (b) 10 mM KNO3 and 5 mM KCl at 70°C, in order to test the effect of nitrogen bubbling. Scan rate 10 mVs−1.
Figure 4 shows a cyclic voltammogram recorded with PET/ITO/Zn(NO3)2 over the potential range from 100 to −1300 mV, under aereted conditions, at 70°C. The trend of this curve is very similar to that observed in Figure 1c. Based on the voltammetric data, the potential for subsequent potentiostatic studies was chosen to be located in the range: A (−700 to −1000 mV), B (−1000 to −1200 mV) and C (−1200 to −1300 mV) as assigned by X symbol, Figure 4b. For potentials more negative than −1300 mV the increase in indium content is favored and this is why this study was not done in such negative potential limits.
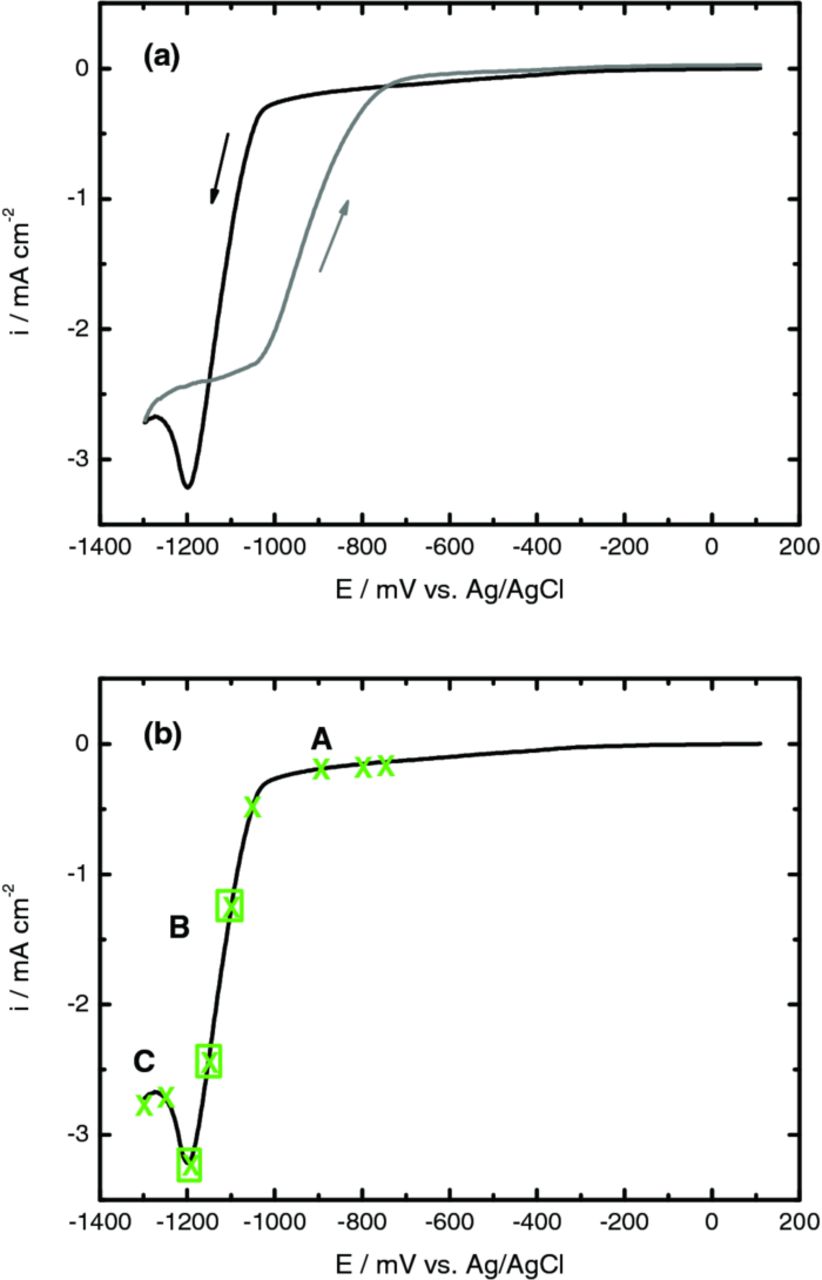
Figure 4. (a) Cyclic voltammogram obtained for a PET/ITO electrode from solution containing 10 mM Zn(NO3)2 and 5 mM KCl at 70°C, in presence of dissolved oxygen. (b) Linear voltammogram obtained for a PET/ITO electrode from solution containing 10 mM Zn(NO3)2 and 5 mM KCl, in presence of dissolved oxygen, with indication of the deposition potential region chosen for further studies: A, B and C. Scan rate 10 mVs−1.
Current transients
During the electrodeposition process, occurring through an EC mechanism, ZnO is formed by the dehydration of Zn(OH)2 which is primarily deposited, Eq. 2.16,23,34,35
![Equation ([2])](https://content.cld.iop.org/journals/1945-7111/160/10/D476/revision1/jes_160_10_D476eqn2.jpg)
For the preparation of ZnO, the ratio between the OH− generation and the Zn2+ diffusion rate to the ITO substrate is critical since it determines the formation of the growth unit, [Zn(OH)4]2−.36 According to Peulon et al., at room temperature, this species is predominant for pH values higher than 11 and, between pH of 9 and 11, Zn(OH)2 is the most significant.17
The current density–time curves for ZnO electrodeposition at different potentials are illustrated in Figures 5a-5c. These figures clearly show that the current density significantly increases as the deposition potential change from −700 to −1300 mV, indicating that much more OH− ions were produced in accordance to Eq. 3.
![Equation ([3])](https://content.cld.iop.org/journals/1945-7111/160/10/D476/revision1/jes_160_10_D476eqn3.jpg)
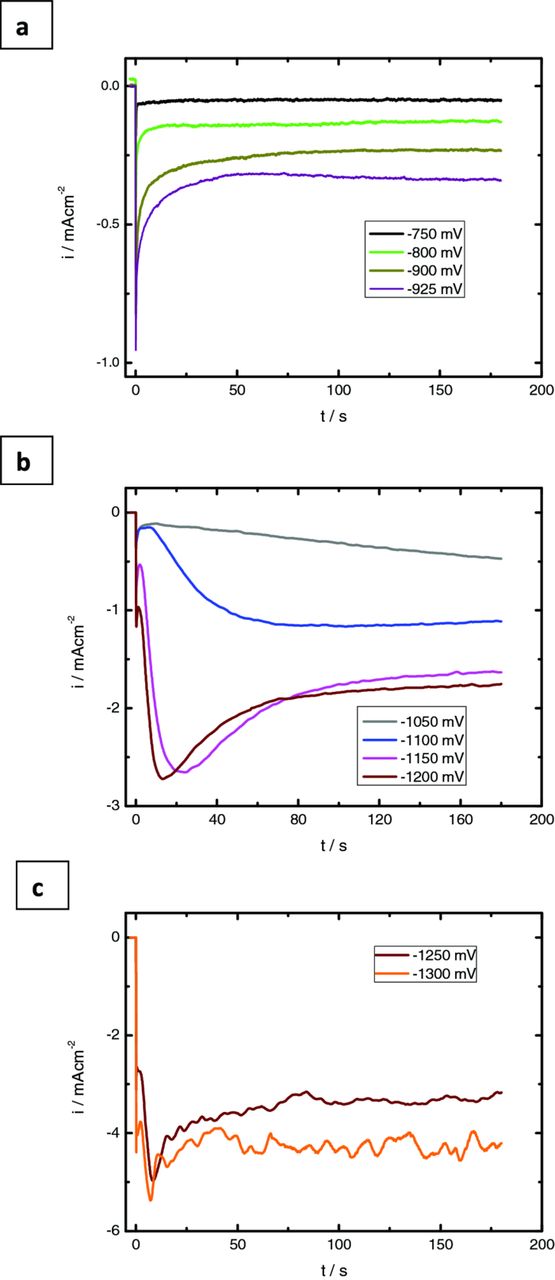
Figure 5. Potentiostatic current transients obtained for electrodeposition of ZnO from solutions containing 10 mM Zn(NO3)2 and 5 mM KCl at 70°C in potential regions A (a), B (b) and C (c).
For the transients recorded in region A, it is observed initially that the current decreases after the application of the deposition potential and then remains stabilized at an almost steady state value, Figure 5a. This current value is dependent on the potential value applied. For the curve obtained at −925 mV it is observed a slight increase in current density for times larger than 50 s. The falling current could be due to double layer charging and ion and electron transfer electrochemical reactions,37 taking place prior to and simultaneously with the formation of the new phase at the electrode surface with subsequent depletion of reactants. In this region, the formation of ZnO, is due mainly to the reduction of dissolved oxygen. It is expected that this electrochemical reaction takes place on the whole electrode surface, whereas the nucleation and growth of the new phase occurs only on a limited number of active sites.38 Conway and Bockris argued that the charge transfer is favored on the planar sites of the electrode surface rather than at steps or kinks where the nucleation and growth process is expected.39
Figure 5b shows current transients obtained in region B which present as a general trend an initially current decay followed by an increase of current due to the nucleation of the new oxide phase. Depending on the applied potential, a current maximum is observed due to the interfacial supersaturation of OH− ions that allows the ZnO chemical precipitation and consequently the electroactive surface area is maximized. After the current maximum, it is observed a subsequent decay, achieving a non-zero steady-state value, correlated to the reduction reaction of nitrate ions and/or coalescence of growing nucleus. In this potential region the position of the maximum current is shifted to shorter times with the increase of the potential due to the existence of more activated nucleation sites. The shape of these transients points to a nucleation of three-dimensional islands.39,40
The transients shown in Figure 5c are somewhat more complex than the others showing after the main current maximum several oscillations probably related to surface modifications of the substrate promoted by its metallization.
Morphological characterization
The morphology of ZnO electrodeposited nanostructures obtained at regions A-C, is shown in Figures 6–8, respectively.
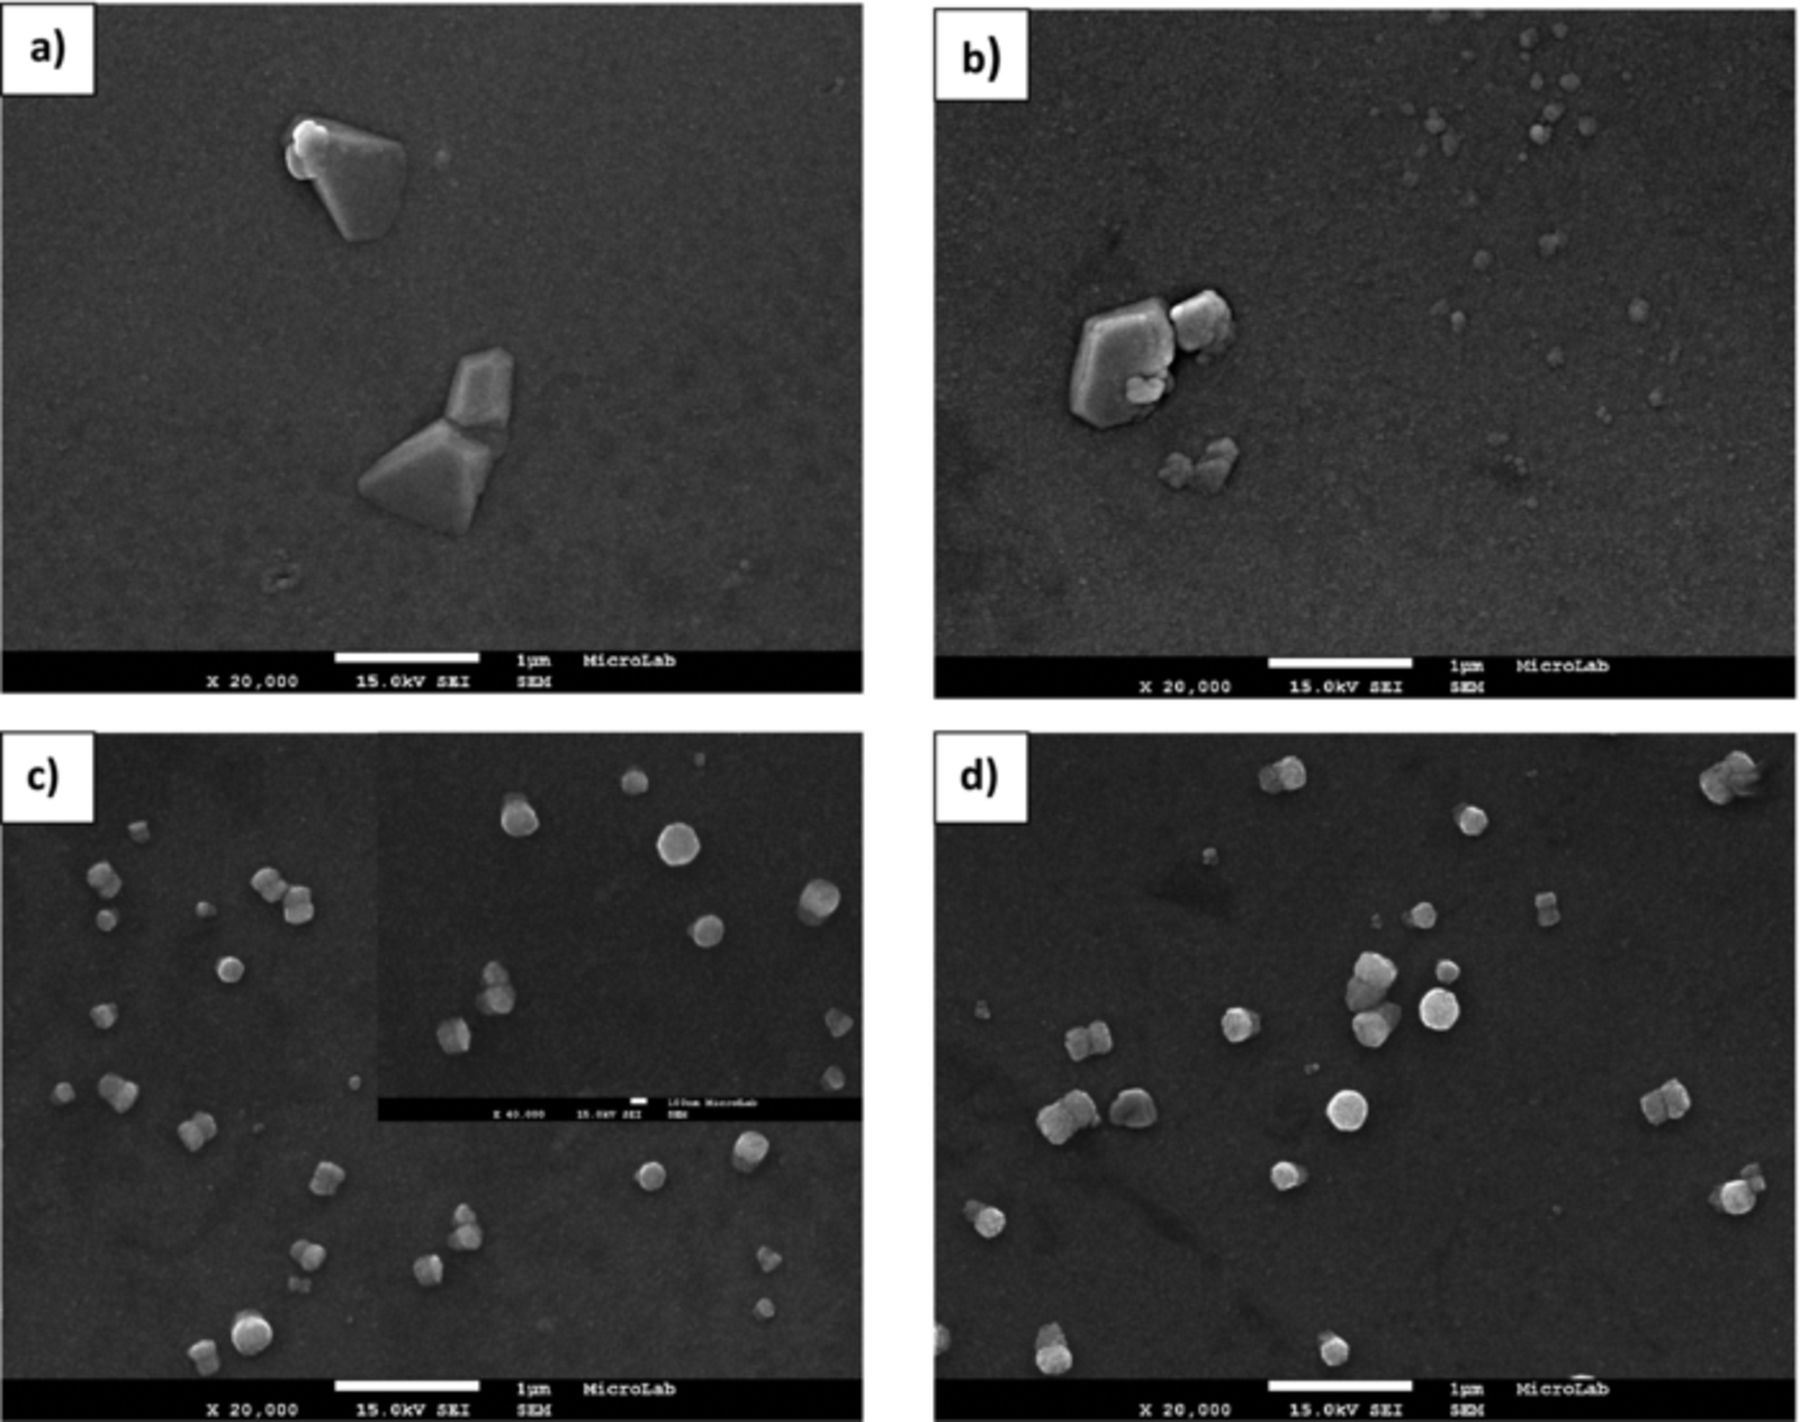
Figure 6. FEG-SEM images of ZnO nanostructures prepared on PET/ITO substrates at 70°C in region A –Deposition potential: (a) −750, (b) −800, (c) −900 and (d) −925 mV.
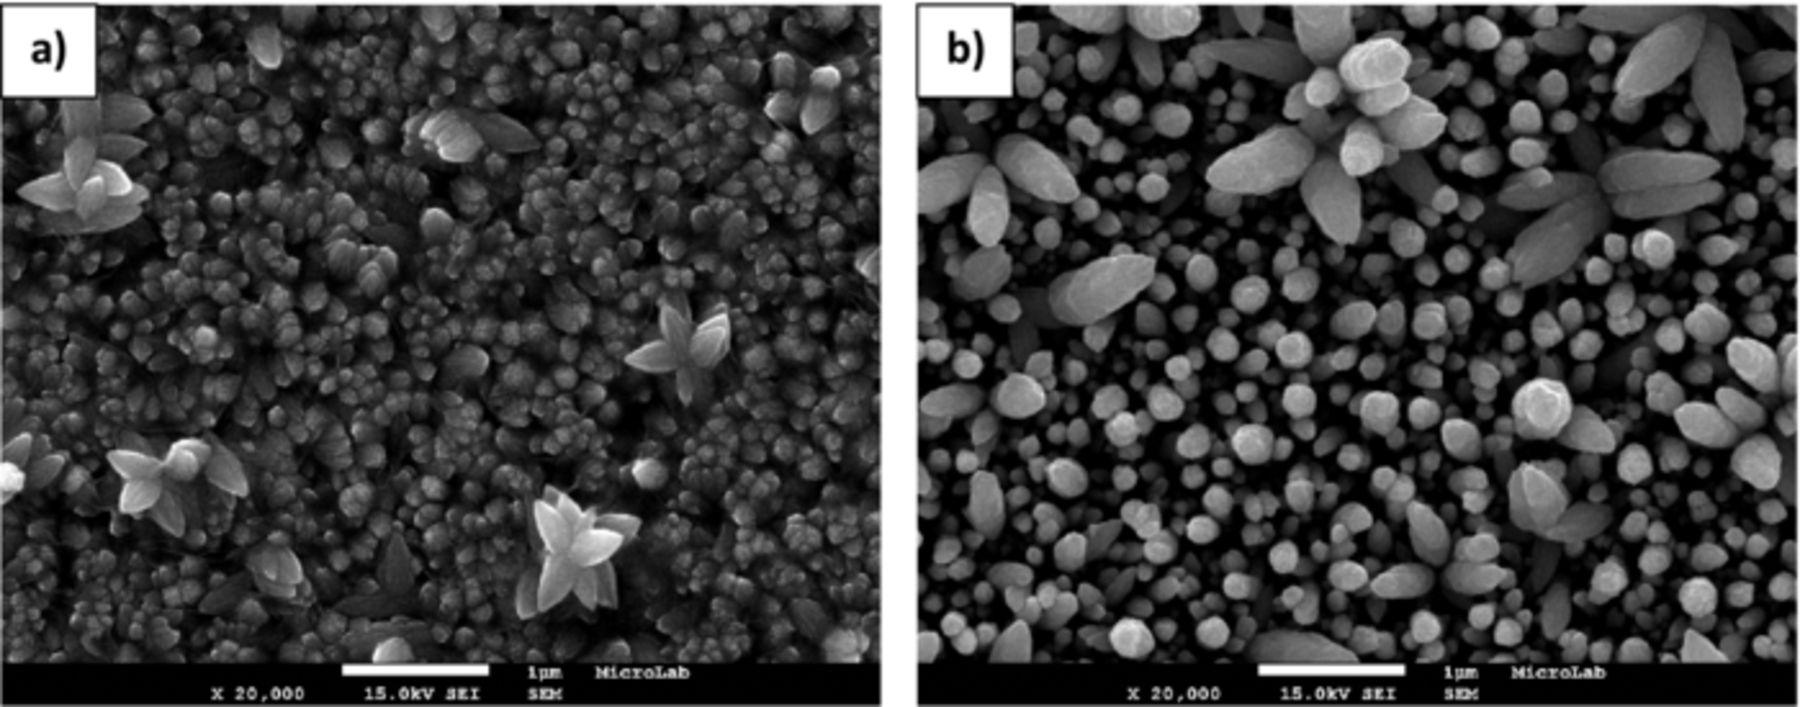
Figure 8. FEG-SEM images of ZnO nanostructures prepared on PET/ITO substrates at 70°C in region C –Deposition potential: (a) −1250 and (b) −1300 mV.
From these figures it is observed an increase of coverage of the substrate following the increase of deposition potential. As expected from chronoamperometric studies, the deposition process will be different depending on the potential values applied. For samples prepared with −750 and −800 mV, the substrate is mostly uncovered and relatively big pyramidal structures are seen randomly dispersed on the ITO surface. At these potentials, the electroreduction of oxygen and nitrate ions is kinetically slow and as consequence the nucleation rate is low.41 Otherwise the rate of surface diffusion is expected to be fast in comparison to the rate of ionic species reduction, allowing the formation of well faceted structures.42 For potentials equal and more negatives than −900 mV vertically aligned hexagonal structures with different diameter are observed pointing to a stronger anisotropic growth through c-axis. It is worth noting that these structures are perpendicularly oriented to the substrate. The large dispersion size detected point to the occurrence of a progressive nucleation process. The surface density of these structures greatly increases with deposition potential value and fully covers the substrate at −1200 mV. Another important detail to be considered is the lost of the hexagonal to circular faceted shape as the applied potential turns more negative, which is correlated to the high flux of depositing ions to the growing structures. According to Pradhan et al. that observed similar structures to those shown in Figures 7c and 7d, the 1D structures grow as hexagonal grains but lose the distinct hexagonal edge due to side-way growth.43 On the other hand, the changing ended shape of these structures from planar to conical was also verified. The conical shape occurs probably due to limited diffusion of Zn2+ ions, affecting the relative growth velocities of the different crystal faces.16,44 These results might be related to modifications on nucleation-growth regime.45
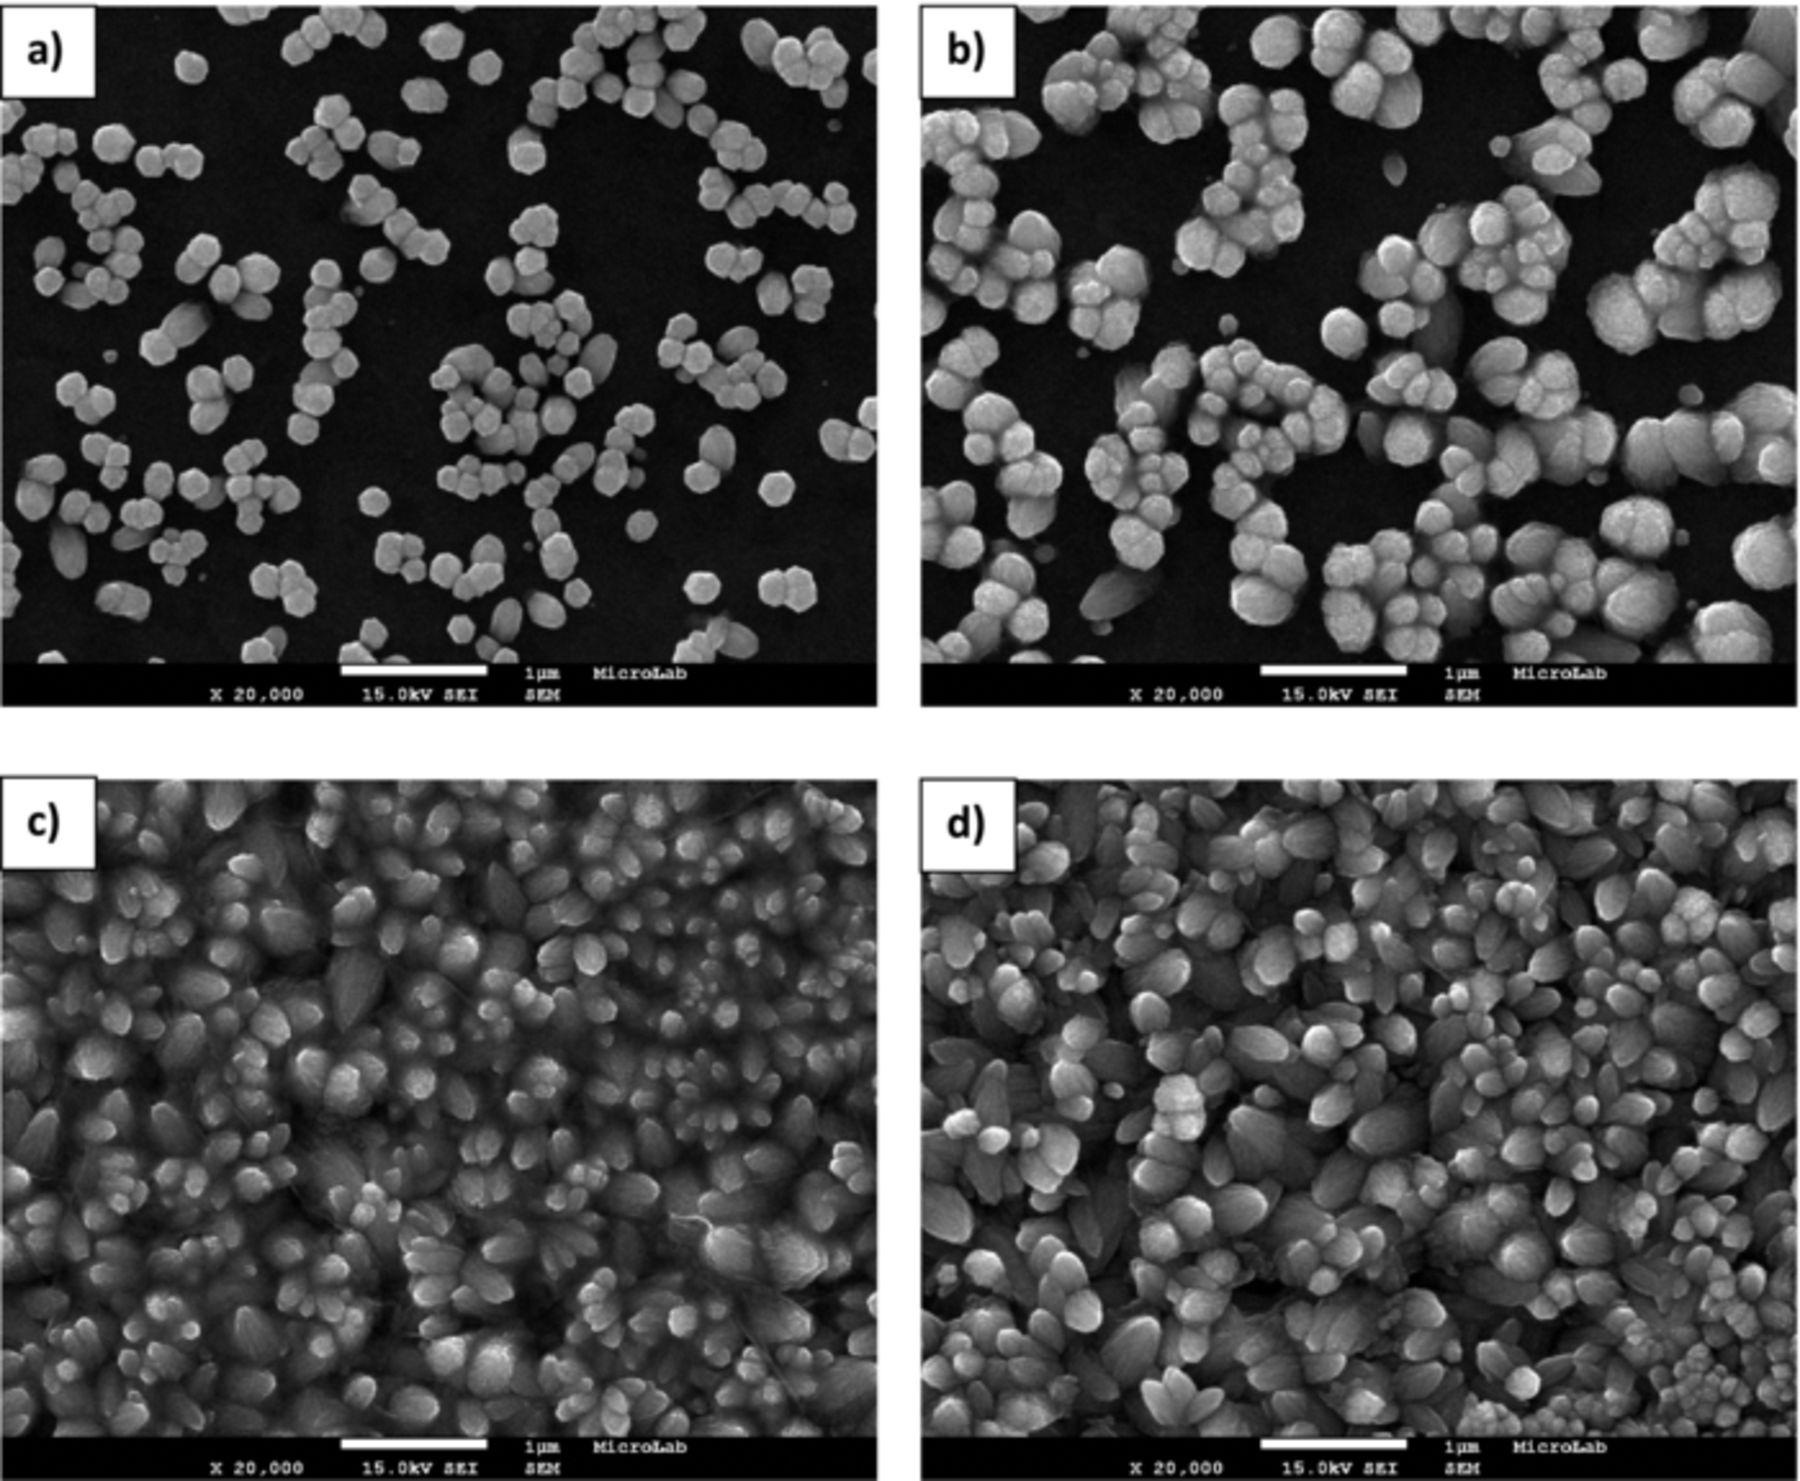
Figure 7. FEG-SEM images of ZnO nanostructures prepared on PET/ITO substrates at 70°C in region B –Deposition potential: (a) −1050, (b) −1100, (c) −1150 and (d) −1200 mV.
For the samples prepared at −1250 and −1300 mV is also observed 3D flower like structures besides the 1D structures.
Structural characterization
Figure 9 shows the X-ray patterns obtained for deposits prepared at −1100 and −1300 mV, belonging to region B and C respectively. The samples prepared in region A have no XRD signal due to their low substrate coverage.
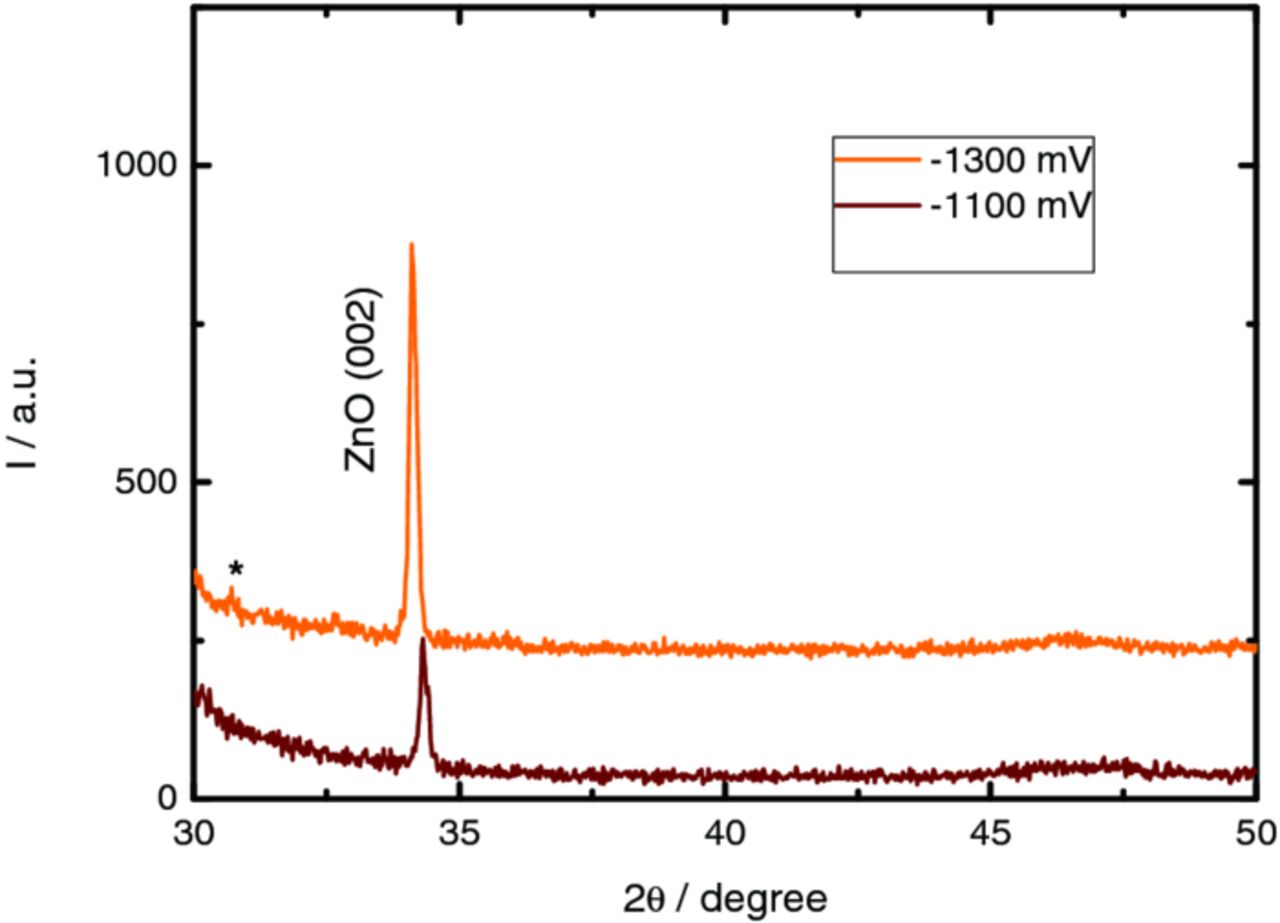
Figure 9. XRD diffraction patterns of the ZnO films prepared on PET/ITO substrate (potential regions B and C). *diffraction peak related to the metallic indium.
X-ray diffraction patterns present only one diffraction peak centered at 34° 2θ that is attributed to the (002) plane of the wurtzite structure (JCPDS file 36–1451). It is worth noting that the hexagonal ZnO structure consists on tetrahedrally coordinated Zn and O atoms with alternating layers of oxygen and zinc ions along the c-axis, forming polar faces.46,47 Additionally, the polar plane (002), which contains only corners of the coordination tetrahedron, is reported as the most reactive.19 The XRD results confirmed the formation of (002) textured ZnO structures due to its strongly anisotropic growth, which is in a good accordance to the vertically elongated-shape microstructures observed by SEM.
Nucleation-growth models
Based on the current transients and the FEG-SEM images, a mechanism for the nucleation and growth of the ZnO onto PET/ITO flexible substrates will be proposed. By SEM images it is easily shown that ZnO electrodeposition follows a three-dimensional nucleation process. The process of nucleation starts with the formation of OHads to the ITO surface. As previously refereed, the overall process is crucially dependent on the OH− generation through the reduction of dissolved atmospheric oxygen and nitrate ions that promotes its saturation near the substrate surface with consequent solid phase formation. This reaction involves the Zn2+ and OHads species with subsequent formation embryos of ZnO nuclei. For the lowest values of overpotential, the formation of adatoms and its diffusion on the substrate surface is the determining step of the deposition process. In the kinetic regime the shape of growing nucleus is conditioned by energy differences between different facets, and proceeds as layer-by-layer growth that leads to the formation of faceted structures.37 At very low overpotential the rate of formation of hydroxide ions is reduced and consequently it is established a state of quasi-equilibrium for the precipitation reaction, promoting a ZnO high structural organization as demonstrated by FEG-SEM pictures. With time increasing, the nitrate reduction occurs preferentially on the ZnO nucleus previously formed instead on the ITO surface, justifying the vertical growth of the structures and the uncovered ITO surface. Of course, following this process a depletion of Zn2+ ion concentration around growing nucleus will occur. Depending on the potential value and without solution stirring, the diffusion of species in solution will control the deposition process. This process will be more pronounced for high potential values applied. On the contrary, the kinetic growth regime should be only considered for small overpotential values.42
In comparison to the transients obtained in region A that only reflects the ion electron discharge and double-layer charging process, the transients recorded in region B present a more interesting shape and are very similar to the ones reported in the literature for metallic electrocrystalization under 3D nucleation and diffusion controlled growth.48 Nevertheless, the nucleation processes during the electrodeposition of semiconductors are expected to exhibit similar behavior.18,36 Hence, when the charge-transfer step in an electrodeposition reaction is fast, the rate of growth of nuclei is determined by diffusion of electrodepositing ions into the nucleus (diffusion in the solution).49 Considering the models already proposed for the different possible nucleation-growth processes,12 we tried to adjust the experimental curves to the theoretical models developed from mathematical expressions in order to achieve a good fitting.
Assuming in this potential range (region B), that the growth mechanism of three-dimensional (3D) ZnO is controlled by diffusion of NO3− and Zn2+ in solution simultaneously with other faradaic processes such as the oxygen and nitrate ions reduction, that occur on the growing new ZnO structures, it is possible to obtain good fittings using the total j vs t curve described by equation 4,13 Figure 10.
![Equation ([4])](https://content.cld.iop.org/journals/1945-7111/160/10/D476/revision1/jes_160_10_D476eqn4.jpg)
where P1 and P2 are related to the double-layer charging effect, correlated to the adsorption-desorption process of ions on the electrode surface:50

P3 is related to the dissolved oxygen and nitrate ions reductionP4 = N0πkD, N0 is the number density of active sites for the nucleation on the electrode surface and k = (8 πc0/ρ)1/2 (ρ electrodeposit density, for ZnO is 5.6 gcm−3) P5 = A (nucleation rate) P6 = 2FD1/2c0/π1/2, F is the Faraday's constant, D is the diffusion coefficient of depositing ions and c0 is the bulk electroactive species concentration.
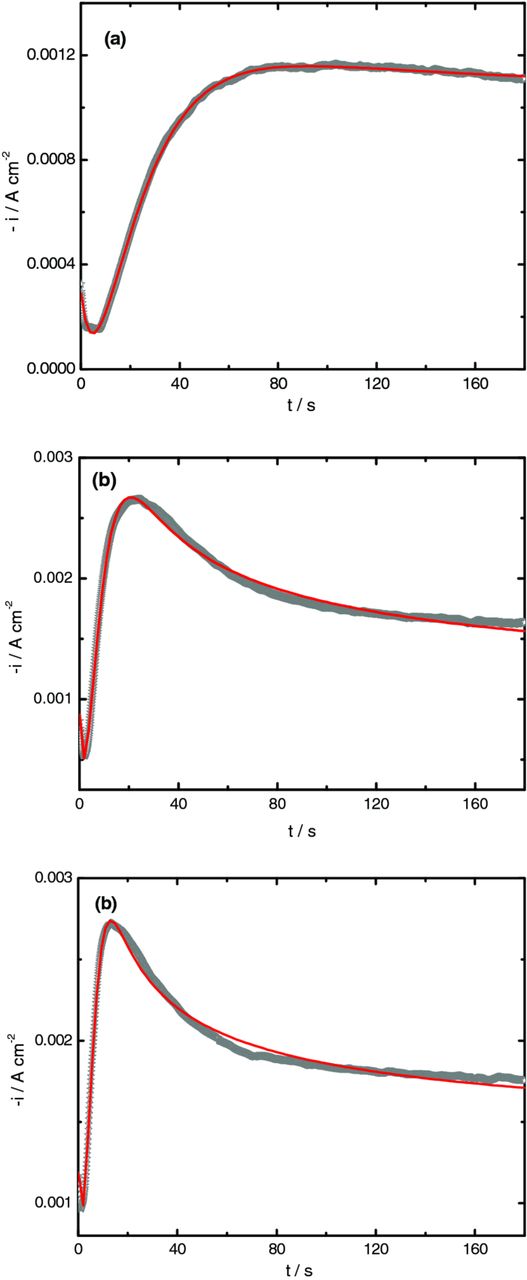
Figure 10. Comparison between the experimental transient obtained during deposition of ZnO at −1100, −1150 and −1200 mV and the theoretical ones (red solid lines) obtained from the nonlinear fitting equation 4.
The best parameters obtained from the fitting process are shown in Table I.
Table I. Fit parameters estimated from analysis of current–time transients shown in Figure 5b, according to the model described by equation 4.
| Edep / mV | P1 / A cm−2 | P2 / s−1 | P3 / A cm−2 | P4 / s−1 | P5 / s−1 | P6 / A cm−2 s1/2 |
|---|---|---|---|---|---|---|
| −1100 | 2.968 × 10⁻⁴ ± 2.449 × 10⁻⁶ | 0.294 ± 0.004 | 9.705 × 10⁻⁴ ± 2.732 × 10⁻⁶ | 0.053 ± 3.515 × 10⁻⁴ | 0.062 ± 4.254 × 10⁻⁴ | 0.002 ± 3.233 × 10⁻⁵ |
| −1150 | 9.314 × 10⁻⁴ ± 2.19 × 10⁻⁵ | 0.699 ± 0.025 | 8.633 × 10⁻⁴ ± 4.019 × 10⁻⁶ | 0.203 ± 0.005 | 0.1 ± 0.003 | 0.009 ± 3.73 × 10⁻⁵ |
| −1200 | 0.001 ± 2.186 × 10⁻⁵ | 0.435 ± 0.019 | 0.001 ± 2.76 × 10⁻⁶ | 0.598 ± 0.053 | 0.075 ± 0.008 | 0.006 ± 2.323 × 10⁻⁵ |
The P4 parameter, that reflects the number of active sites, shows a great dependence with applied potential value, increasing when the potential turns more negative. Subsequently more nucleation sites appear with potential which is in accordance to the SEM morphological study.
At constant potential, the nucleus density N(t) as function of time (t) can be expressed in terms of the first order nucleation rate equation51
![Equation ([5])](https://content.cld.iop.org/journals/1945-7111/160/10/D476/revision1/jes_160_10_D476eqn6.jpg)
where N0 is the maximum nuclei density (cm−2) and A the nuclei activation rate (s−1). For large values of A instantaneous nucleation occurs and conversely small values point to progressive nucleation. From Table I it is observed that the rate of new ZnO nuclei formation per active site is low pointing to a progressive nucleation. In addition, it is obvious the inexistence of a linear relationship between A and applied potential. Although it is verified that the number of ZnO nanorods increases with the increase of electrodeposition overpotential.
In a complementary way to evaluate the "progressive/instantaneous" character of the deposition process, the dimensionless curves developed by Scharifker-Hills model52 were plotted with the experimental curves after normalizing i and t to the maximum current and corresponding time, Figure 11.
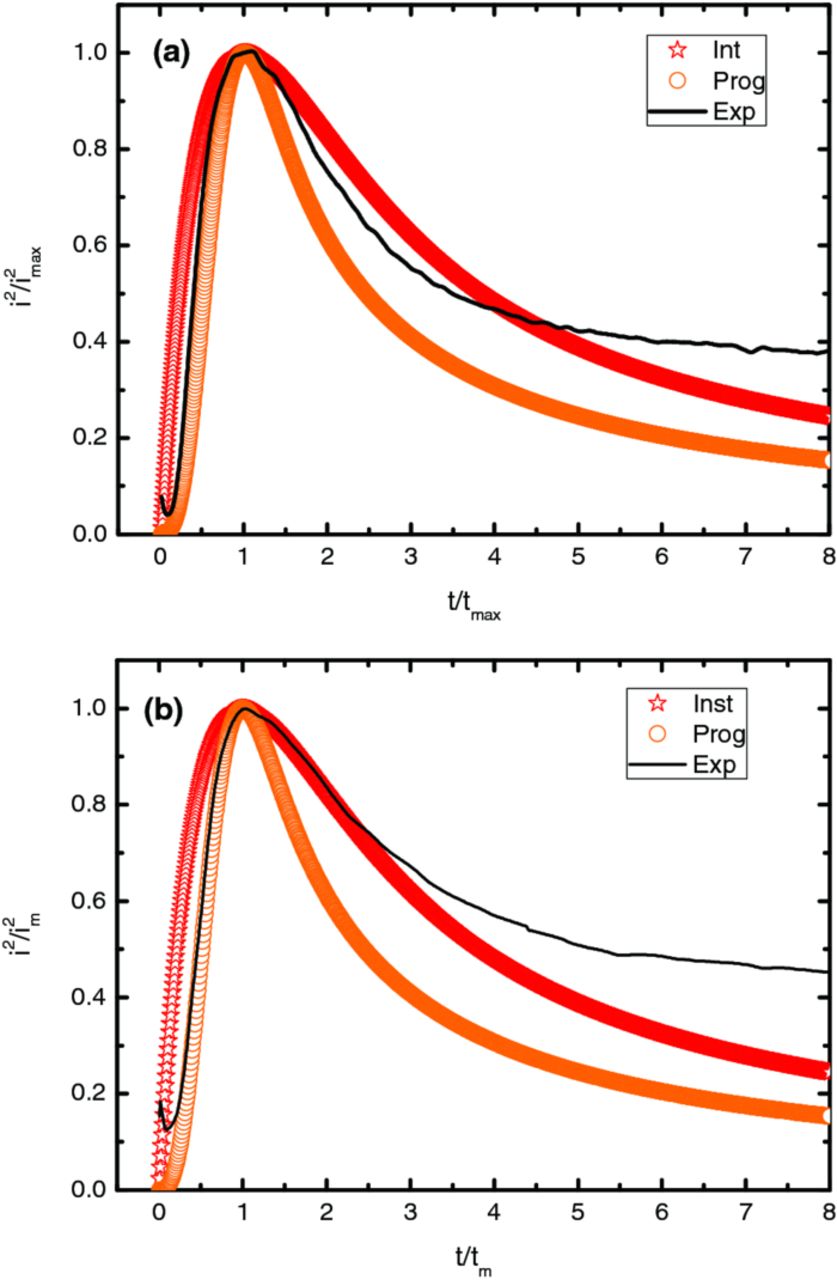
Figure 11. Theoretical and experimental dimensionless plots (i/im)2 vs t/tm for ZnO deposition onto PET/ITO substrate at (a) −1150 and (b) −1200 mV.
Instantaneous and progressive nucleation theoretical curves could be obtained using equations 6 and 7, respectively
![Equation ([6])](https://content.cld.iop.org/journals/1945-7111/160/10/D476/revision1/jes_160_10_D476eqn7.jpg)
![Equation ([7])](https://content.cld.iop.org/journals/1945-7111/160/10/D476/revision1/jes_160_10_D476eqn8.jpg)
where im and tm are the current maximum of the measured i vs. t transient and the corresponding time, respectively.12 Regarding this figure it must be concluded that the experimental curve agrees well to the progressive nucleation in the rising part of the curve but at the descending part a deviation occurs. This should be justified either by the simultaneous reduction of dissolved oxygen and nitrate ions13 or to the geometry of growing centers which are conical shape rather than hemispherical.51
For the ZnO deposition on ITO substrate, Khelladi et al.21 found that the process is in good agreement to the instantaneous nucleation and 3D diffusion limited growth. This apparent discrepancy could be due to the different zinc nitrate concentration used, that affects the deposition reactions.
Finally, due to the complexity of transient curves obtained at −1250 and −1300 mV no fitting analysis has been tried.
Conclusions
ZnO electrodeposition onto flexible conducting substrates using both electrochemical and morphological techniques has been studied. FEG-SEM analysis shows that ZnO electrodeposition depends strongly of applied potential, resulting on the formation of independent three-dimensional structures randomly distributed on the PET/ITO surface and, being mostly perpendicular to the substrate. These results indicate a strong interaction between the Zn2+ and OH− ions and the growing structures. In samples prepared at low overpotential values, region A, free areas on the ITO surface coexist with diverse size of growing structures, indicating that progressive nucleation takes place. Furthermore, these randomly disperse structures show well defined facets.
With regard to the bulk deposition region, −1000 < Edep < −1200 mV, where the substrate coverage is more significant, the analysis of the current-time transients indicates that the Zn electrodeposition occurs by progressive 3D nucleation with diffusion-controlled growth. The kinetic parameter values obtained are in accordance with the dimensionless analysis of the transients. FEG-SEM images reveal that the coverage is fully completed depending of the potential by ZnO structures (as identified by XRD) vertically aligned to the substrate, Regions B and C. With the increase of the applied potential, verifies the changing geometric shape of ZnO nanorods from hexagonal to circular as well as its top ending from planar to needle-shape. Finally, the flower structures observed in samples prepared in region C could be associated to the modifications of substrate conductivity, motivated by the formation of metallic In at sufficient negative potential that allows the increment of the nucleation rate. This result was confirmed by the voltammetric study performed with the system PET/ITO/KNO3 where it was also observed a current loop at sufficient negative potential range. According to the XRD analysis the dark film as-prepared is due to the formation of metallic In resulting from the reduction of In2O3 to In.
In summary, this work shows that the application of different techniques to the study of ZnO deposition has been rewarded by a considerable improvement in our understanding of the early stages of ZnO formation onto flexible polymeric conducting substrates.
Acknowledgments
The authors acknowledge financial support from FCT Strategic Project - UI 536 – 2011-2012. We are also grateful to Dr. M.E. Jorge for XRD measurements. A.Gomes acknowledges PEst-OE/QUI/UI0536/2011 and the Ciência 2007 program. The authors also acknowledge the fruitful discussions with Prof Benjamin Scharifker.