Abstract
EDLCs based on micro-mesoporous carbon electrodes prepared from steam and CO2-steam co-activated SiC-CDCs and room-temperature ionic liquid 1-ethyl-3-methylimidazolium tetrafluoroborate as an electrolyte were tested to establish the electrochemical power and energy densities and region of ideal polarizability. Cyclic voltammetry, constant current charge/discharge (CC/CD), electrochemical impedance spectroscopy (EIS) and constant power discharging methods have been applied to establish the electrochemical characteristics of EDLCs completed. The highest capacitance value of 162 F g−1 at 3.6 V has been established by EIS for the SiC-CDC material, which was activated with steam at 1000°C and cleaned with molecular H2. The capacitance values for other materials prepared using the steam activation process at different temperatures were only slightly lower. The calculated coulombic efficiency values from constant current discharge/charge data for all the systems remained within the range from 97.0 to 98.5% and from 99.3 to 100% at current densities 0.1 A g−1 and 1 A g−1, respectively. The coulombic efficiencies calculated from integrated cyclic voltammetry plots varied from 97 to 98 and from 99 to 100% at potential scan rates 5 and 50 mV s−1, respectively, showing that the steam activated SiC-CDC materials are very promising for various high energy density storage/generation applications.
Export citation and abstract BibTeX RIS

This is an open access article distributed under the terms of the Creative Commons Attribution 4.0 License (CC BY, http://creativecommons.org/licenses/by/4.0/), which permits unrestricted reuse of the work in any medium, provided the original work is properly cited.
The electrical double-layer capacitors (EDLCs) have been widely studied and attracted attention due to their unique properties and their high power performance that fills the gap between dielectric capacitors and traditional batteries.1–17 How much energy can be stored in the EDLC strongly depends on the electrode materials accessible surface area and the access of ions into micropores, i.e. on the accumulation properties.4,17 Different types of carbon materials have been studied as the electrode materials, but specially activated carbons turned to have great potential to be a cheap, but efficient solution for that.7,8,17 On the other hand the electrolyte thermodynamic stability has a crucial impact on the wideness of the region of ideal polarizability, which in turn affects the specific energy and power densities of non-aqueous and room-temperature ionic liquid (RTIL) based EDLCs. Ionic liquids have been widely studied and considered suitable for EDLC applications, as they offer a high electrochemical stability, which facilitates high operation potential of the EDLC and as a result of that more energy can be stored. So the proper combination of the optimally designed micro-mesoporous electrode material porosity and the electrolyte ions Debye screening length are crucial factors determining the EDLCs performance.2,5–8 During charging of EDLC the Gibbs adsorption of ions initiates expansion of the electrode material and not due to the different size of adsorbed ions, but equal adsorbed charge. The carbide-derived carbons can also be used in artificial muscles and switches.18 Influence of molecular solvents in EMImBF4 on the EDLC characteristics has been studied19,20 and it was found that addition of acetonitrile decreases viscosity of electrolyte. Unfortunately, the region of ideal polarizability somewhat decreases, leading to the decrease of energy and power densities.19,20
The main aim of this study is to analyze further comparatively inexpensive SiC-CDC material with tunable pore size,21 prepared from SiC, which is very low-priced raw carbide compared to other binary (TiC, Mo2C, B4C) or ternary carbides.18 The SiC-CDC materials have been activated with steam and by combination of CO2-steam for comparison. The synthesis and treatment processes of SiC-CDC material together with more detailed physical characterization data have been published previously.3 The results of this study showed very interesting results – although there were variations in the treatment processes conditions and there was a significant difference in the specific surface area and pore size distribution data (mainly in the microporous region of porosity), the electrochemical behavior was very similar for all of the materials tested. Also, the comparison with previously analyzed CO2 activated materials1–3 showed that the steam activated materials have some advantages. Therefore, the main purpose of this study is to analyze the materials behavior in RTIL 1-ethyl-3-methylimidazolium tetrafluoroborate (EMImBF4) to establish the electrochemical parameters and the application limits when using an ionic liquid as an electrolyte. EMImBF4 was chosen due to high bulk conductivity (κ = 13.6 mS cm−1) and wide potential region of electrochemical stability,22,23 but also to have direct comparison with our previous studies using this electrolyte.
Experimental
The active materials used in the EDLC electrodes were steam and CO2-steam activated SiC-CDC carbons.1–3 The carbon materials were synthesized via chlorination at 1100°C from SiC and afterwards activated with steam. The steam activation was carried out for 2 hours at 900°C or 1000°C. The carrier gas used was either Ar or CO2, respectively, for steam or CO2-steam activated materials. Half of each activated material was further treated with H2 at 900°C, to analyze the impact of hydrogen cleaning process on the electrochemical behavior of the materials. The main synthesis parameters and the materials with their abbreviations are given in Table I. For physical characterization N2, Ar and CO2 sorption experiments, XRD, Raman, IR spectroscopy and XPS analysis were conducted. The results established were characteristic of so-called disordered amorphous carbons and analysis data confirmed that no significant structural changes take place during treatment with CO2 or H2O. Also, the data showed that despite of the differences in the treatment procedures the materials surface chemistry remains nearly the same. The materials are mainly microporous, but there are some differences in their specific surface area and pore size distribution data (Table II, Figure 1). There is very impressive increase of differential pore volume in the micropore (pores wider than 1.0 nm) as well as mesopore regions for materials activated with CO2-steam at 900°C and 1000°C.
Table I. The synthesized materials with their abbreviations and properties.
| Abbreviation | H2O (%) | Activation time (h) | Carrier gas | Activation temperature (°C) | Activation burn-off (%) | H2 treated |
|---|---|---|---|---|---|---|
| St-900 | 47 | 2 | Ar | 900 | 15 | No |
| St-900-H2 | Yes | |||||
| St-1000 | Ar | 1000 | 50 | No | ||
| St-1000-H2 | Yes | |||||
| St-CO2-900 | CO2 | 900 | 19 | No | ||
| St-CO2-900-H2 | Yes | |||||
| St-CO2-1000 | CO2 | 1000 | 60 | No | ||
| St-CO2-1000-H2 | Yes |
Table II. Results of the sorption measurements for the synthesized materials.
| Abbreviation | SBET (m2g−1) | SDFT (m2g−1) | Smicro (m2g−1) | Vmicro (cm3g−1) | Vtot (cm3g−1) | Vtot, DFT (cm3g−1) |
|---|---|---|---|---|---|---|
| St-900 | 1700 | 1709 | 1570 | 0.77 | 0.96 | 0.90 |
| St-900-H2 | 1720 | 1672 | 1620 | 0.73 | 0.87 | 0.81 |
| St-1000 | 2410 | 1803 | 2260 | 1.09 | 1.32 | 1.21 |
| St-1000-H2 | 2290 | 1822 | 2180 | 1.00 | 1.35 | 1.08 |
| St-CO2-900 | 1670 | 1566 | 1600 | 0.72 | 0.82 | 0.76 |
| St-CO2-900-H2 | 1750 | 1660 | 1660 | 0.74 | 0.88 | 0.82 |
| St-CO2-1000 | 2610 | 1907 | 2470 | 1.22 | 1.44 | 1.32 |
| St-CO2-1000-H2 | 2400 | 1938 | 2270 | 1.20 | 1.32 | 1.22 |
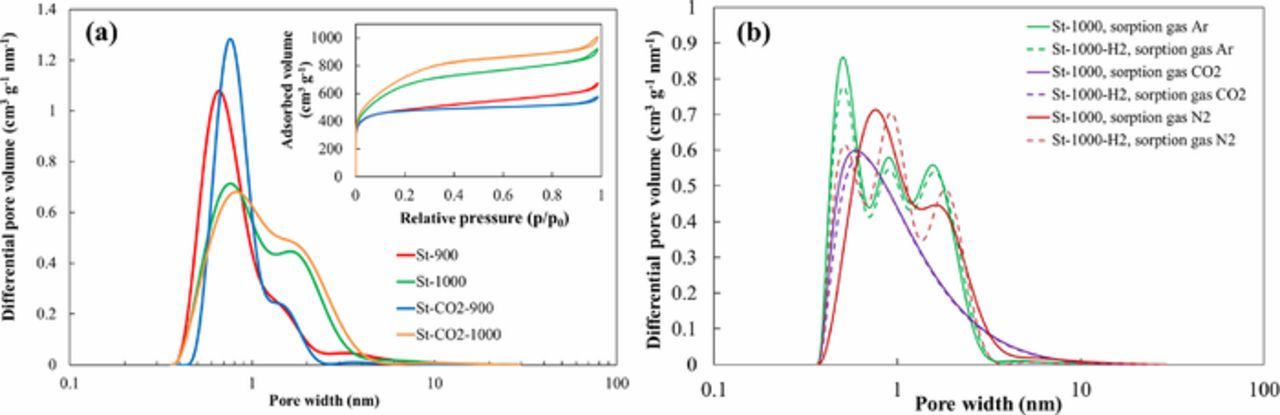
Figure 1. Differential pore size distribution vs. pore width plots obtained using the SAIEUS method and (inset) nitrogen sorption isotherms (a) for steam and CO2-steam co-activated SiC-CDC materials, noted in Table I. Differential pore size distribution vs. pore width plots (b) for St-1000 H2 untreated and treated materials, using different gases for sorption.
Comparison of pore size distribution plots measured using N2, Ar and CO2 gases indicates there is no dependence of the pore size distribution, i.e. peak positions for the high temperature H2 treated materials. For N2 sorption method, the positions of peaks depend on the H2 treatment step applied. Thus, N2 can have specific interactions with the surface functional groups.17
The EDLC electrodes comprised of 96 wt% carbon active material and 4 wt% binder (PTFE, 60% dispersion in H2O). This mixture (carbon and binder) was laminated and roll–pressed (HS–160N, Hohsen Corporation, Japan) together to form a 100 ± 3 μm flexible layer of the carbon electrode. After drying under vacuum (10−8 mbar), the electrodes were covered from one side with pure Al layer (2 μm) by the magnetron sputtering method.9–11 The electrolyte used for the measurements was EMImBF4 (Fluka Analytical, for electrochemistry, ≥ 99.0%, H2O ˂ 200 ppm). The two–electrode standard Al test cell (HS Test Cell, Hohsen Corporation) with two identical electrodes (geometric area of about 2.0 cm2) was completed inside a Ar filled glove box (Labmaster sp, MBraun; O2 and H2O concentrations lower than 0.1 ppm) and all electrochemical experiments were carried out at temperature T = 20°C. The 25 μm thick TF4425 (Nippon Kodoshi) separator sheet was used for mechanical separation of the working electrodes. After assembly of the cells, they were left to stand for 24 hours to allow the electrodes to wet with the electrolyte. In addition, before the actual measurement the EDLCs were cycled up to 2.5 V until a stable CV curve shape was obtained, to ensure that the hole system has been wetted by the ionic liquid. Also, it has to be noted, that the electrolyte was added in small excess to ensure the complete filling of the pores. Electrochemical characteristics of the EDLCs containing EMImBF4 have been studied by the cyclic voltammetry (CV), constant current charge/discharge (CC/CD) and the electrochemical impedance spectroscopy (EIS) methods, using a SI1287 Solartron potentiostat and 1252 A frequency response analyzer over ac frequency (f) range from 1 mHz to 300 kHz at 5 mV modulation. The constant power method (using a BT2000 testing system, Arbin Instruments, USA) has been used for obtaining the experimental Ragone (energy density vs. power density) plots.4,17
Results and Discussion of the Electrochemical Data
Cyclic voltammetry data
The CV method was used to obtain the region of ideal polarizability and therefore CVs were measured at different potential scan rates ν from 1 to 500 mV s−1 and in a very wide cell potential region ΔE up to 3.8 V.
Data in Fig. 2a indicates that nearly exponential increase of current density started only at ΔE ≥ 3.6 V. At higher ΔE values very weak increase of j can be explained by the mass transfer step limited faradaic process, caused by the very low concentration of O2, H2O and other electrochemically active residuals in EMImBF4 liquid phase. At very high potential scan rates ν > 200 mV s−1 and current densities (Fig. 2c) there is no exponential increase of j at ΔE ≥ 3.6 V, explained by slow mass transfer rate of residuals onto SiC-CDC surface. Thus, due to the high dryness and cleanness of EMImBF4 used, the rates of electrochemically active reactants reactions are very slow.
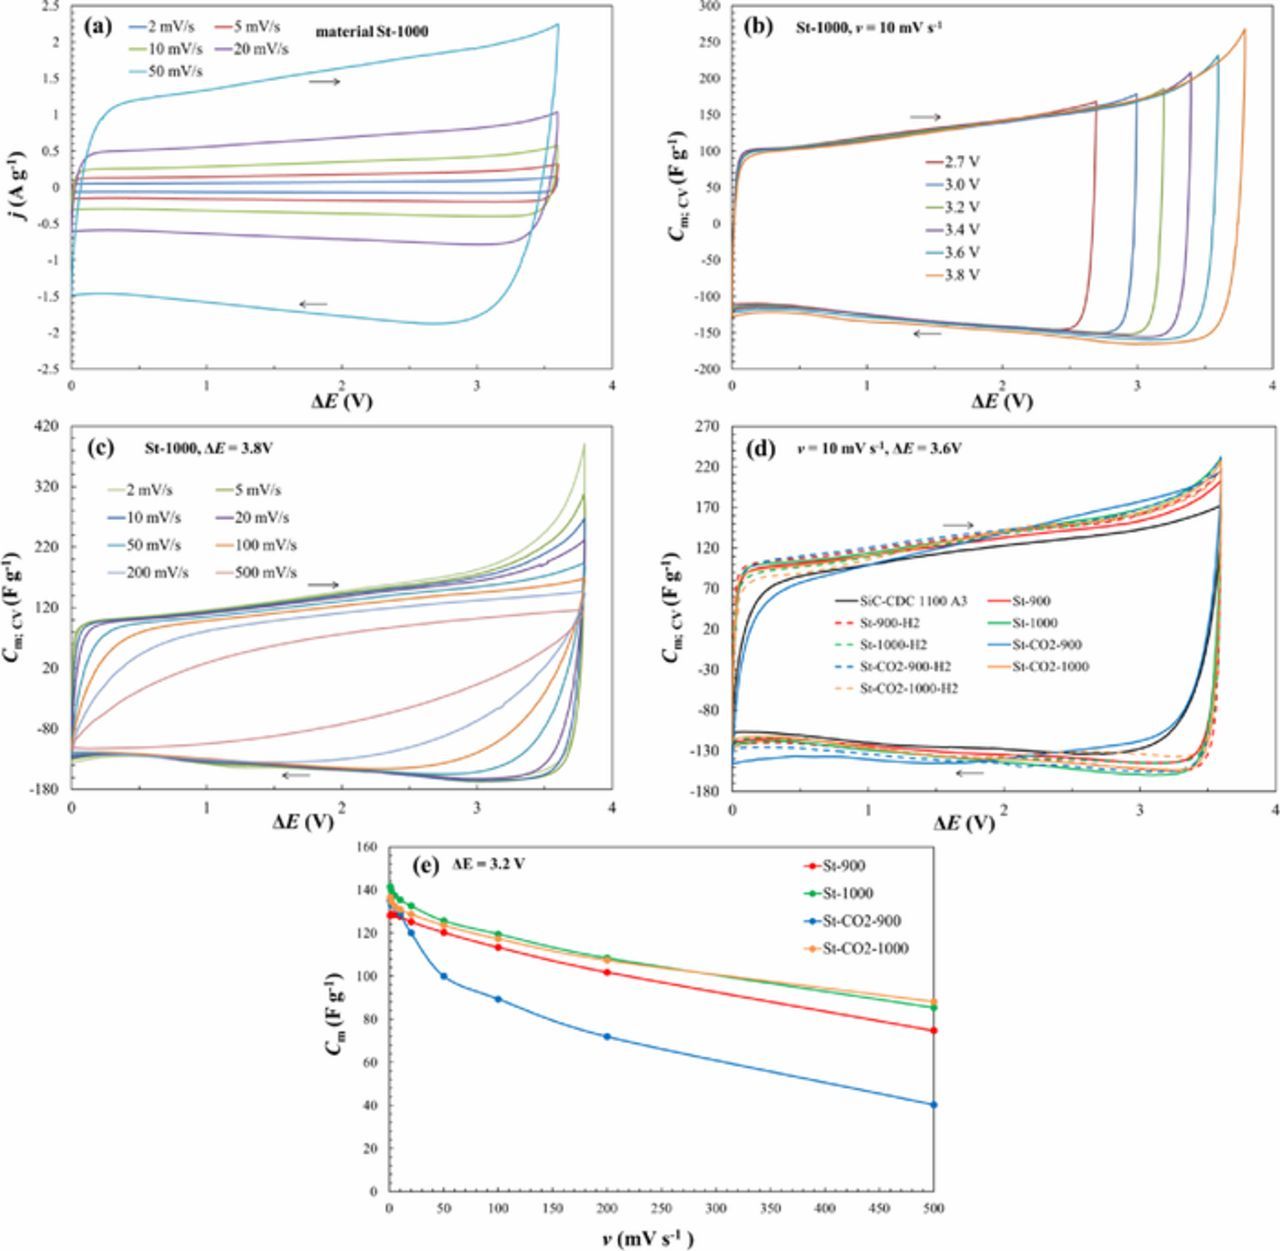
Figure 2. Cyclic voltammograms j vs. ΔE (a) and expressed as specific capacitance vs. cell potential dependencies for St-1000 material at potential scan rate 10 mV s−1 over different potential regions (b), for St-1000 material at different potential scan rates (c) and for CO2 activated material denoted as SiC-CDC 1100 A3 and steam and CO2-steam co-activated SiC-CDC materials (noted in Table I) at potential scan rate 10 mV s−1 (d), Cm, ν curves for EDLCs based on materials noted in Figure (e).
The gravimetric capacitance Cm;CV values were calculated from the measured CV curves, according to Eq. 1 and Eq. 2.
The Eq. 1:
![Equation ([1])](https://content.cld.iop.org/journals/1945-7111/166/8/A1558/revision1/d0001.gif)
where j is the current density (per geometrical surface area of electrode), ν is the potential scan rate and C is the cell capacitance. Eq. 1 is correct if the capacitance does not depend on the potential applied (C ≠ f(ΔE)) and the series resistance of the system Rs → 0. Therefore, this equation is applicable in case of very small current density values (within the region of slow v), where the ohmic potential drop is negligible and the current response is essentially equal to that of a pure capacitor.13,14 In a two–electrode symmetrical EDLC system the specific capacitance Cm (F g−1) can be obtained from the capacitance of the cell:
![Equation ([2])](https://content.cld.iop.org/journals/1945-7111/166/8/A1558/revision1/d0002.gif)
where m is the weight of one carbon electrode. Eq. 2 can be implemented if the positively and negatively charged electrodes have the same capacitance at the cell potential region applied.1–3,13,29
CV curves expressed as specific capacitance (Cm;CV) vs. cell potential (ΔE) are presented in Figs. 2b–2d. In Fig. 2d for comparison the CO2 activated material data having the best electrochemical properties, denoted as SiC-CDC 1100 A3 from our previous work, is also given.2
The EDLCs demonstrated nearly ideal capacitive behavior at cell potential scan rate ν ≤ 50 mV s−1 and up to ΔE ≤ 3.6 V in EMImBF4 (overlapping of discharging capacitance in discharging branch) (Figs. 2b–c). Even at ΔE = 3.8 V, there are only small deviations from ideal capacitive behavior. Especially at low ν some increase of faradaic capacitance has been observed, explained by the slow mass transfer process of electrochemically active reactant (H2O) from RTIL to the electrode surface. At moderate potential scan rates 20 ˂ ν ˂ 200 mV s−1, there are smallest deviations from CV shape characteristic for ideally polarizable system, explained by very low concentration of residuals in systems under study. Comparing these data to our previous work results conducted with the CO2 activated materials,2 we can see that for the steam activated materials based EDLCs we can use a bit higher potential scan rates, lower IR-drop influence on the shape of Cm vs. ΔE plots, where the capacitive behavior remains nearly ideal. It is mainly caused by the more expressed amount of bigger micropores and mesopores at steam activated materials surface, increasing the conductivity of electrolyte in the mesoporous matrix.
Analyzing data for 1 M (C2H5)3CH3NBF4 (Et3MeNBF4) acetonitrile (AN) solution as the electrolyte, we discovered that although the materials differ in their activation and treatment parameters and also in their specific surface areas and pore volumes, the electrochemical behavior was nearly overlapping for all of them.3 Therefore, this confirms again that the microporous region characteristics determine the nearly linear correlation between specific surface area and capacitance, visible up to SDFT values ∼ 1000 m2 g−1. However, at higher SDFT values the logarithmic dependence has been observed and at very high SDFT values a plateau in Cm;CV vs. SDFT plot has been observed.17
For Et3MeNBF4 + AN based electrolytes19,20 the region of ideal polarizability is weakly narrower like for EMImBF4 + AN electrolyte based EDLCs.1–3,14,15,24,25
Using EMImBF4 as an electrolyte it can be seen that one of the materials falls out from the others – St-CO2-900 based EDLC has a smaller capacitance value and this can be explained by the smallest SBET, Vmicro and Vtot values and narrowest pore size distribution data (Table II, Fig. 1). All the other materials again differ only a little in their electrochemical behavior.
The values of Cm;CV start to increase nearly exponentially at cell potentials ΔE ≥ 3.6 V, which can be explained by the start of faradaic decomposition of an insignificant amount of residual water and reduction of O2 in RTIL. Thus, by electrochemical reduction of H2O and O2 traces at a negatively charged electrode as well as by oxidation of the surface functionalities at a positively charged electrode takes place at ΔE > 3.6 V.14,15 With increasing the cell potential scan rate v over 100 mV s−1, the cyclic voltammograms and the specific capacitance vs. cell potential dependencies (Fig. 2c) become distorted in the region of potential switchover explained by the slow mass-transfer step in the porous CDC electrode matrix due to the high viscosity of EMImBF4.7,14,15,17
Specific capacitance Cm;CV values calculated from the linear region of the CV curves after changing the direction of the potential scan rate v = 10 mV s−1 at cell potential 3.6 V are shown in Table III. As already noted St-CO2-900 has the smallest Cm;CV value (131 F g−1) and St-1000 the highest (Cm;CV = 145 F g−1). Previously studied CO2 activated materials had all Cm;CV values below 130 F g−1.
Table III. Calculated specific capacitance values from cyclic voltammetry (ΔE = 3.6 V; v = 10 mV s−1), constant current (ΔE = 3.6 V; j = 1 A g−1) and impedance spectroscopy measurements (ΔE = 3.6 V; f = 1 mHz).
| Electrode material | Cyclic voltammetry (F g−1) | Constant Current (F g−1) | Impedance spectroscopy (F g−1) |
|---|---|---|---|
| St-900 | 132 | 120 | 148 |
| St-900-H2 | 140 | 124 | 157 |
| St-1000 | 145 | 125 | 162 |
| St-1000-H2 | 138 | 120 | 165 |
| St-CO2-900 | 131 | 130 | 142 |
| St-CO2-900-H2 | 143 | 125 | 157 |
| St-CO2-1000 | 138 | 121 | 154 |
| St-CO2-1000-H2 | 133 | 117 | 148 |
Capacitance vs. cell potential scan rate curves are given in Fig. 2e. Capacitance values have been calculated using the integrated total charge values, over the cell potential range ΔE = 3.2 V.26 For the EDLC based on the most microporous St-CO2-900 material the capacitance values decrease fastest and in a biggest extent – at potential scan rate 20 mV s−1 this system retains about 89% of its initial capacitance, but at 500 mV s−1 it is only ∼ 30%. All the other systems are based on steam activated carbons with a better micro-mesoporosity ratio, which results in a slower decrease of capacitance. These systems retain ∼ 94% of its initial capacitance at potential scan rate 20 mV s−1 and at 500 mV s−1 ∼ 65%.
The C vs. ΔE – curves have been integrated and the charge density (σ) vs. ΔE plots (Fig. 3) have been constructed, because the σ vs. ΔE values are more informative than sometimes non-linear capacitance vs. ΔE data. Data in Fig. 3 show that within very wide potential region (up to 3.6 V) the σ vs. ΔE - plots are symmetrical. Only at ΔE ≥ 3.6 V, some non-linearity of σ vs. ΔE – plots has been established. Thus, the slow faradaic reactions started only at ΔE ≥ 3.6 V. From σ vs. ΔE – plots the integral capacitance values C = 132 F g−1, in good accordance with Cm; CV data, have been calculated. This method eliminates the role of measurement error of current pulses in CV curves. There is no big influence of the potential scan direction on the σint (discharge)/ σint (charge) values, observed in many EDLC papers. The very high discharging/charging coulombic efficiency values nσ = σdisch/σchar ≥ 97% have been calculated.
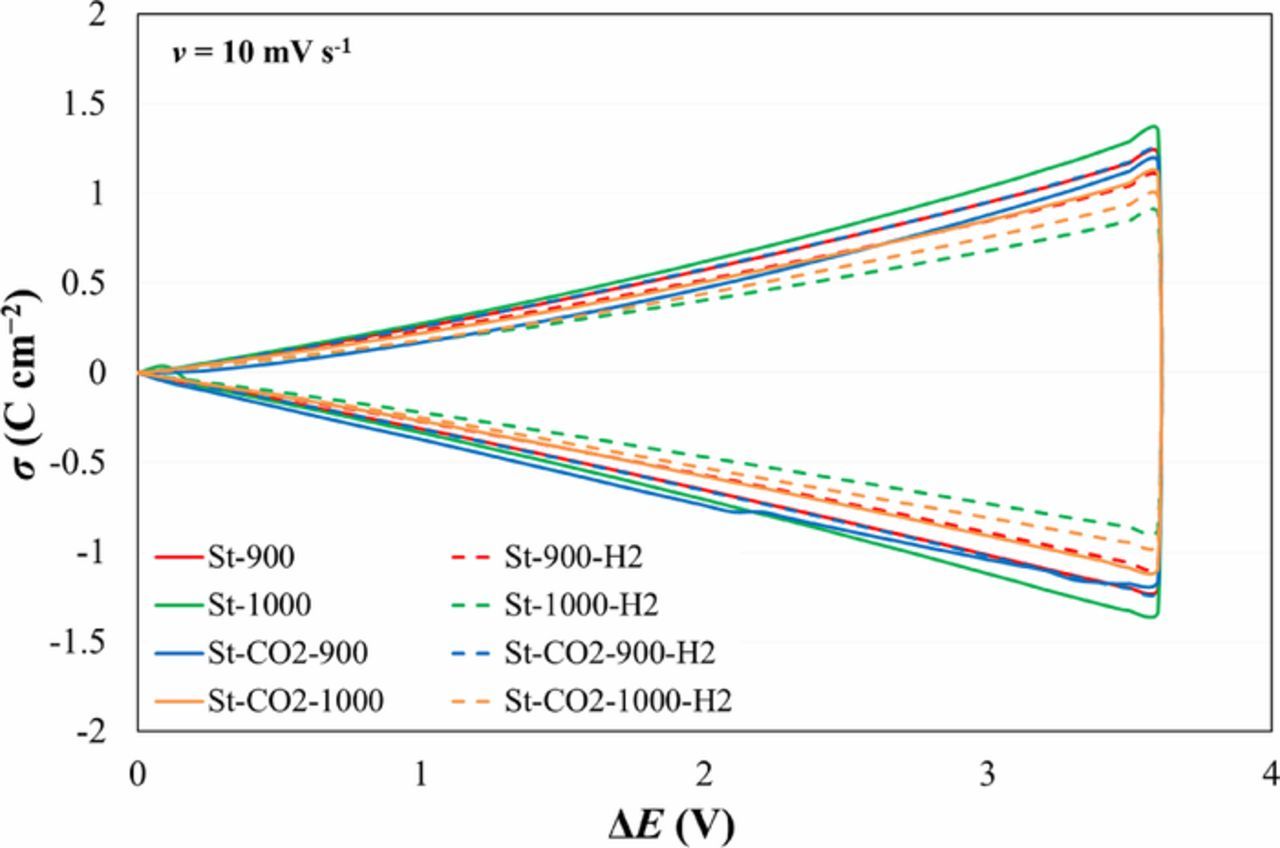
Figure 3. σ vs. ΔE plots for systems noted in Figure.
Constant current charge/discharge data
EDLCs were tested at different fixed constant current (CC) regimes from 0.01 to 5 A g−1 applying charging/discharging steps within the cell potentials from 0 to 3.0 V (Figs. 4a, 4b). This ΔE region correlates to the maximum limit of commercially available EDLCs.16,17
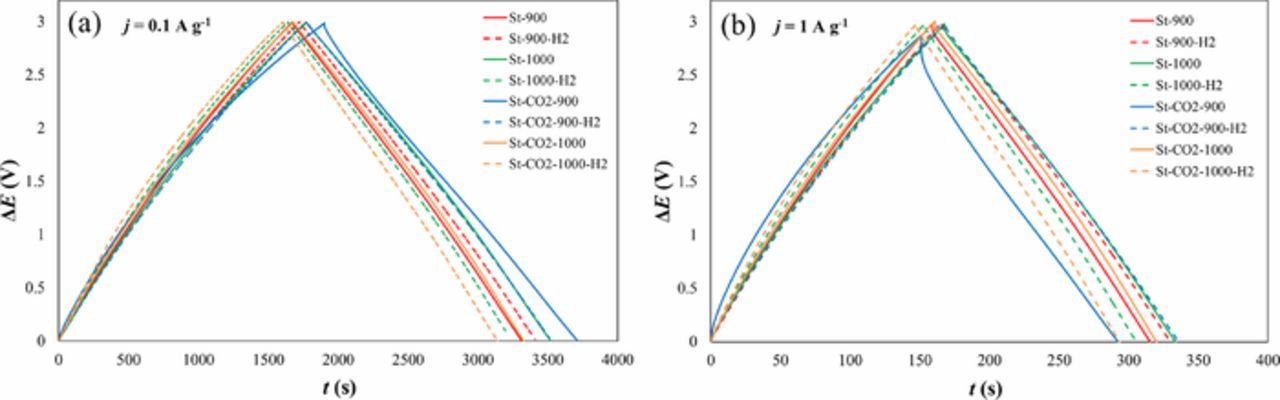
Figure 4. Constant current charge/discharge data at current density j = 0.1 A g−1 (a) and at current density j = 1 A g−1 (b) for steam and CO2-steam co-activated SiC-CDC materials, noted in Table I.
The discharge and charge capacitances, Ccc, were calculated from the data of the third cycle.24 Ccc (F cm−2) was obtained from the slope of the discharge (or charge) curve according to Eq. 3:
![Equation ([3])](https://content.cld.iop.org/journals/1945-7111/166/8/A1558/revision1/d0003.gif)
where dt/d(ΔE) is the reciprocal value of the slope of discharging or charging curve. For simplicity, the discharging curves were approximated by a linear function. Therefore, the medium integral capacitance Ccc values calculated from CC/CD data are somewhat different than the Cm;CV values calculated from CVs (Table III). Slightly lower capacitance values obtained by CC/CD method can be explained by physical differences in methods applied for charging/discharging of electrodes as well as by not totally linear shape of the charging/discharging curves used for the calculation of Ccc. For more correct analysis the CC/CD curves have been integrated and the energy densities stored (Ein) and released (Eout) have been obtained. The energy efficiency values have been calculated as:
![Equation ([4])](https://content.cld.iop.org/journals/1945-7111/166/8/A1558/revision1/d0004.gif)
![Equation ([5])](https://content.cld.iop.org/journals/1945-7111/166/8/A1558/revision1/d0005.gif)
where t is time in seconds and ΔEmax and ΔEmin are maximal and minimal cell potentials applied.17,24,25
The nen values from 84 to 92% have been obtained, increasing from very microporous St-CO2-900 to most mesoporous material based EDLC St-1000.
The charge-discharge curves for the activated materials are nearly linear and symmetrical, demonstrating very good electrochemical reversibility and coulombic efficiency at smaller current densities j = 0.1 A g−1 (Fig. 4a). Even at higher current densities j = 1 A g−1 (Fig. 4b), weak deviation from linear shape and a small IR-drop can be seen. The exception is again the St-CO2-900 material based EDLC and for this system CC/CD data get somewhat distorted at higher current densities.
The coulombic efficiency has been calculated as a ratio of integrated charge released and accumulated during discharging and charging of the EDLCs.17 The calculated coulombic efficiency values for all the systems remained within the range of 97 to 98.5% (at current 0.1 A g−1) and from 99.3 to 100% (at current 1 A g−1), showing that the steam activated SiC-CDC materials are very promising for EDLC and various energy storage applications. It should be noted that differently from many EDLCs, the charging and discharging curves for St-CO2-900 and other electrode materials are curved upwards explained by the heavily microporous characteristics of carbons used. With the decrease of microporosity and increase of mesoporosity more linear discharging (as well as charging) curves have been measured.
Impedance spectroscopy data and complex power calculations
Nyquist plots were measured in ac frequency range from 1 mHz to 300 kHz at fixed cell potentials from 0 to 3.8 V (Figs. 5a, 5b). From Fig. 5a it can be seen that the shape of the Nyquist plot is nearly independent of ΔE applied, if ΔE ≤ 3.2 V. At higher cell potentials the low frequency part slowly starts to drift away from the ideal −90 degree slope. The Nyquist plots (Fig. 5b) for the steam activated materials consist mainly of two parts: (1) of the so-called "porous" region with a slope of α nearly −45° in ac frequency region 0.1 < f < 1000 Hz, characteristic of the mass transfer limited process (with absorption boundary conditions) in the micro-mesoporous carbon electrode matrix of an electrode and (2) of the low frequency double-layer capacitance region with a slope of α ≈ −90° ("knee" at f ˂ 0.1 Hz), obtained by the finite length absorption effects.9,11,25 EDLCs based on St-900-H2 and St-1000-H2 electrodes have the highest value of "knee" frequency, which indicates the easier accessibility of electrolyte ions into the pores.8,17,27 As can be seen in Fig. 5b, all the materials show again very similar performance, except St-CO2-900 and SiC-CDC-1100 A3, which behavior looks more similar to previously studied heavily microporous CO2 activated materials based EDLCs.1–3 More detailed analysis of Nyquist plots shows that more microporous materials also show a third region in Nyquist plots, i.e. a small semicircle at higher frequencies f > 100 Hz,2 explained by the mass transfer and charge transfer processes at macroporous surface regions.1–4
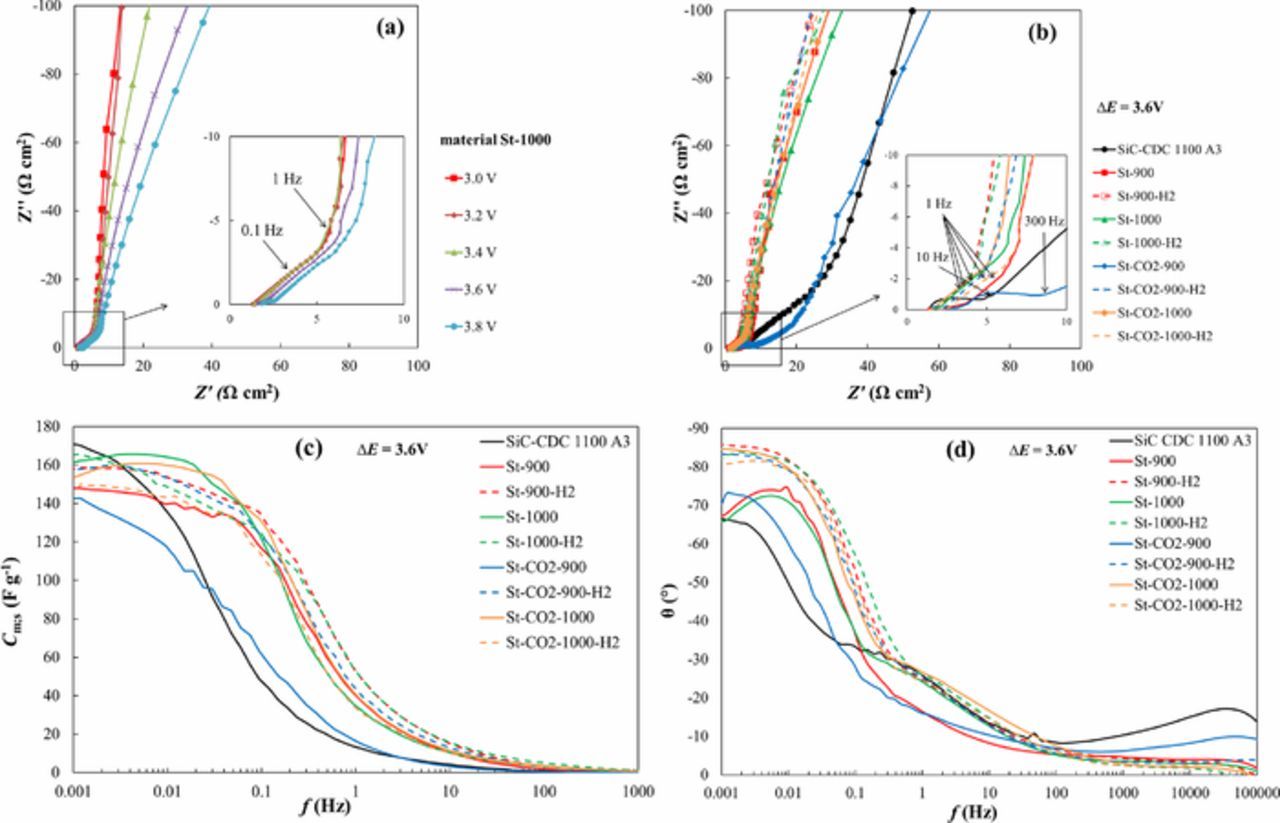
Figure 5. Nyquist plots for St-1000 material at different cell potentials (a), Nyquist plots (b), specific series capacitance Cm;s vs. ac frequency dependencies (c) and phase angle vs. ac frequency plots (d) for CO2 activated material denoted as SiC-CDC 1100 A3 and steam and CO2-steam co-activated SiC-CDC materials (noted in Table I) at cell potential ΔE = 3.6 V.
The specific series capacitance Cm;s values have been calculated from the impedance spectroscopy data at ac frequency f = 1 mHz and are shown in Table III and Cm;s vs. f plots are given in Fig. 5c. The Cm;s values are somewhat higher, but nevertheless in a good agreement with the values obtained using CV and CC/CD methods. The higher Cm;s values could be explained by not completely established electrochemical adsorption equilibrium if CV and CC/CD methods have been used. However, sometimes the EIS method over-estimates the capacitance values due to enhanced contribution of parasitic reactions to the electrochemical response in porous carbons.
The phase angel θ vs. ac frequency dependencies are shown in Fig. 5d. Three of the materials show similarities to the CO2 activated material data, but still most of the steam activated materials have phase angles values between −83° to −86°, again proving the better performance and effectiveness compared to CO2 activated materials.1–3
Existence of long plateau in Cm;s vs. f- as well as Cm;p vs. f-plots (Figs. 5c and 6a), and overlapping of Cm;p vs. f and Cm;s vs. f plots (Fig. 6b) at f ˂ 0.05 Hz indicates that the ideal capacitance values (free from faradaic capacitance contribution) have been established.17,28,29 All the Cm;s values calculated are quite similar for the steam activated materials (Figs. 5c, 6a, 6b). The CO2 activated material SiC-CDC-1100 A3 data (from our previous work) shows somewhat different capacitance behavior, but it has to be noted that it was activated for 16 hours. All the other CO2 activated materials (activated for 2 hours) showed noticeably smaller capacitance values than steam and CO2-steam activated SiC-CDCs. The St-CO2-900 as well as SiC-CDC 1100 A3 materials based EDLCs demonstrated very slow adsorption rates due to not very well developed mesoporosity of the carbon powders.
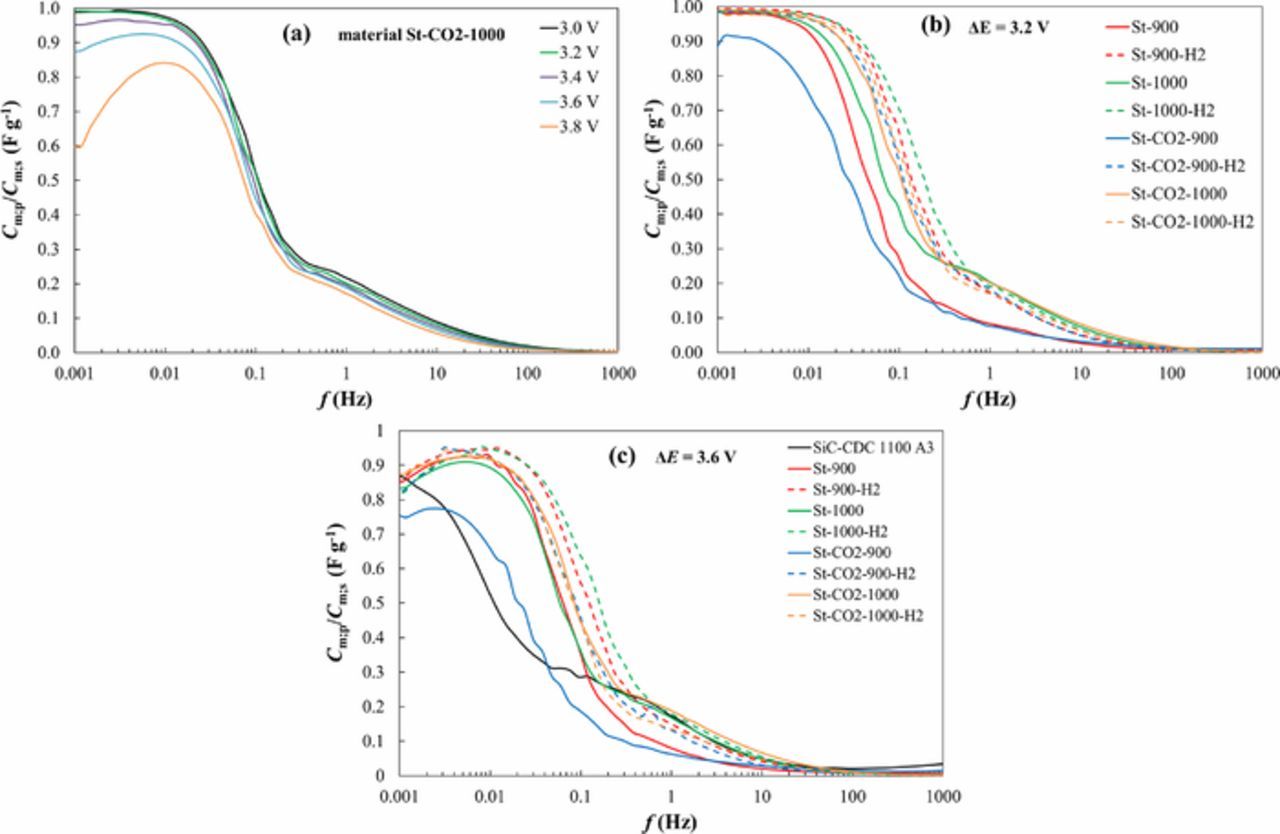
Figure 6. Cm;p/Cm;s vs. ac frequency dependencies calculated from impedance spectroscopy data for St-CO2-1000 at different cell potentials (a), for CO2 activated material denoted as SiC-CDC 1100 A3 and steam and CO2-steam co-activated SiC-CDC materials (noted in Table I) at cell potential ΔE = 3.2 V (b) and ΔE = 3.6 V (c).
In an ideally polarizable system the ratio of Cm;p/Cm;s should be 1. However, it is shown in Fig. 6, that the ratio of Cm;p/Cm;s for many EDLCs is very slightly lower than 1 at very low frequencies. This indicates that the increase in capacitance from impedance spectroscopy at higher potentials ΔE > 3.6 V is not truly initiated by the increase of the electric double layer charging (increase of Gibbs adsorption value), but probably caused by very slow faradaic processes, like reduction of residual water, O2 and other additives.25,30
These conclusions are in very good agreement with data in Fig. 7a, where |-Z''| vs. f curves are given. At f ≥ 1000 Hz, there is weak dependence of |-Z''| on the cell potential applied and with the increase of ΔE, the |-Z''| increases, explained by the quick faradaic processes at outer surface areas of SiC-CDC electrode.
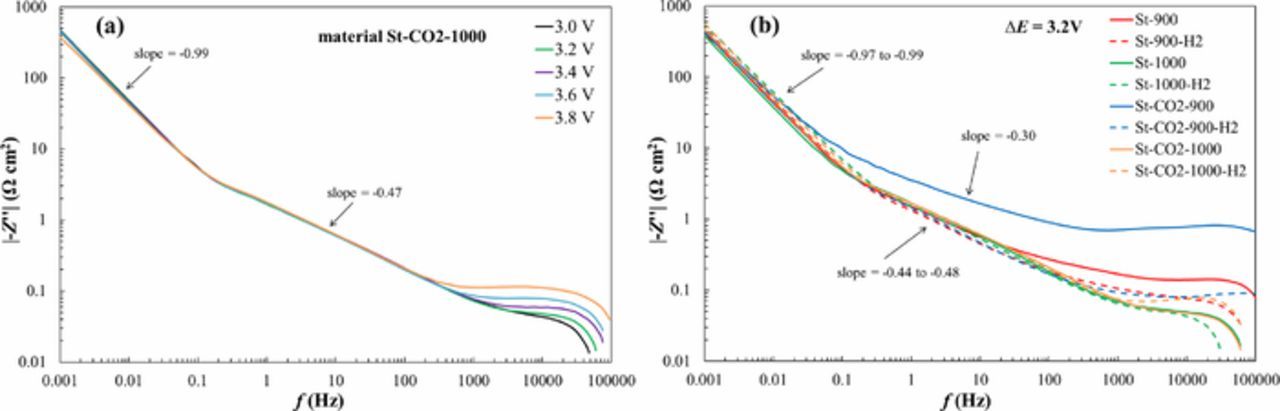
Figure 7. |-Z''| vs. f plots for St-CO2-1000 based EDLC at different cell potentials (a) and for all the steam activated materials at ΔE = 3.2 V (b).
Within moderate frequency region, nice linear section has been established (with slope −0.44 to −0.48) characteristic of finite-length mass transfer processes.1–4,14,15,17,33 At f ˂ 0.1 Hz, the second linear region characteristic of finite-length adsorption step limited process (with slope – 0.97 to – 0.99), demonstrating that the role of faradaic processes on the capacitance values is very low, expect at ΔE ≥ 3.6 V. However, data in Fig. 7b show that the shape of |-Z''| vs. f plots depends on the SiC-CDC materials micro-, mesoporosity and specific surface area values, i.e. on the activation conditions used. For CO2-steam co-activated, but not H2 reduced materials, very high |-Z''| vs. f values have been calculated at f ≥ 0.1 Hz. Thus, materials without high temperature hydrogen reduction cannot be used for completing of high energy/high power density EDLCs with cell potential ΔE > 3.2 V. The same conclusion can be reached analyzing the Nyquist plots (Fig. 6) as well as Z' vs. f –plots (not shown for shortness), demonstrating noticeably high active resistance values for St-900 and St-CO2-900. In addition, it seems that the high |-Z''| values at f > 10 Hz can be explained by very microporous structure of the carbon powders (Table II) increasing the mass transfer resistance of RTIL ions nearly 20 times if compared with H2 reduced materials.33 The increase of the synthesis temperature from 900°C to 1000°C and additional reduction of powders with H2 decreases the -Z'' values nearly 50 times. It is very important to mention that at low frequency region (f ˂ 0.1 Hz) there is no dependence of capacitance (|-Z''| i.e differential capacitance) on the synthesis and activation method used for preparation of SiC-CDC powders. There are linear areas in |-Z''| vs. f plots with the slope values varing from −0.97 to −0.99 indicating that the ideal capacitive behavior has been established for all EDLCs under study.
The characteristic time constant τ values have been calculated using imaginary and active power density vs. f plots1–4,17 (Fig. 8). It is clearly visible that τ value increases nearly 10 times compared the best and lowest EDLC. It should be noted that for fixed EDLC, τ is independent of ΔE, if ΔE ≤ 3.6 V. Thus, this region of cell potential can be applied for real EDLC applications.
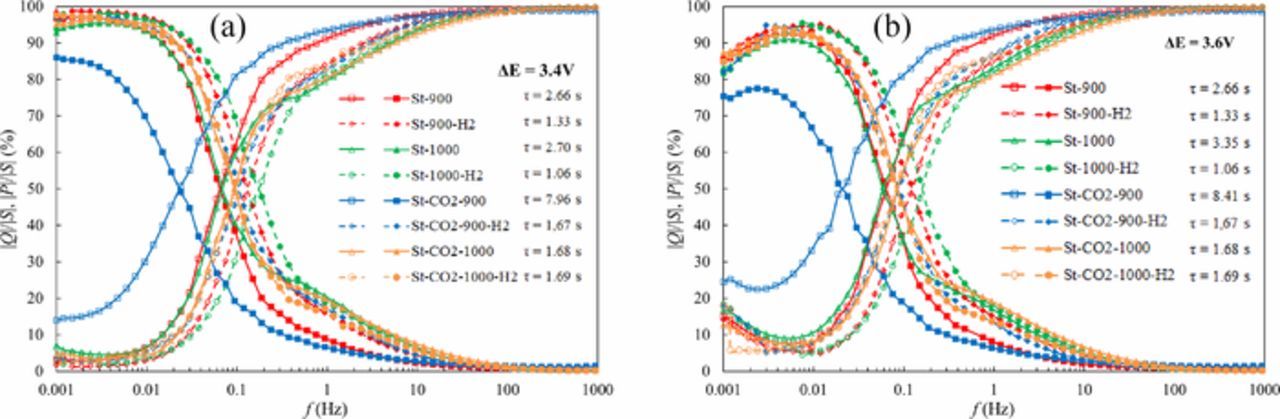
Figure 8. Imaginary power, real power vs. f plots at cell potential ΔE = 3.4 V (a) and ΔE = 3.6 V (b) for steam and CO2-steam co-activated SiC-CDC materials based EDLCs, noted in Figure and calculated time constants.
Ragone plots
The experimental gravimetric and volumetric Ragone plots measured (specific energy, E, vs. specific power, P, dependencies) calculated to the total material weight (including active carbon material, Al current collector and binder) or volume of two electrodes (for the EDLCs based on different SiC-CDC electrodes) have been obtained from the constant power tests within the cell potential range from 1.7 V to 3.4 V or from 1.9 V to 3.8 V, and are shown in Figs. 9a–9d.17,31–33
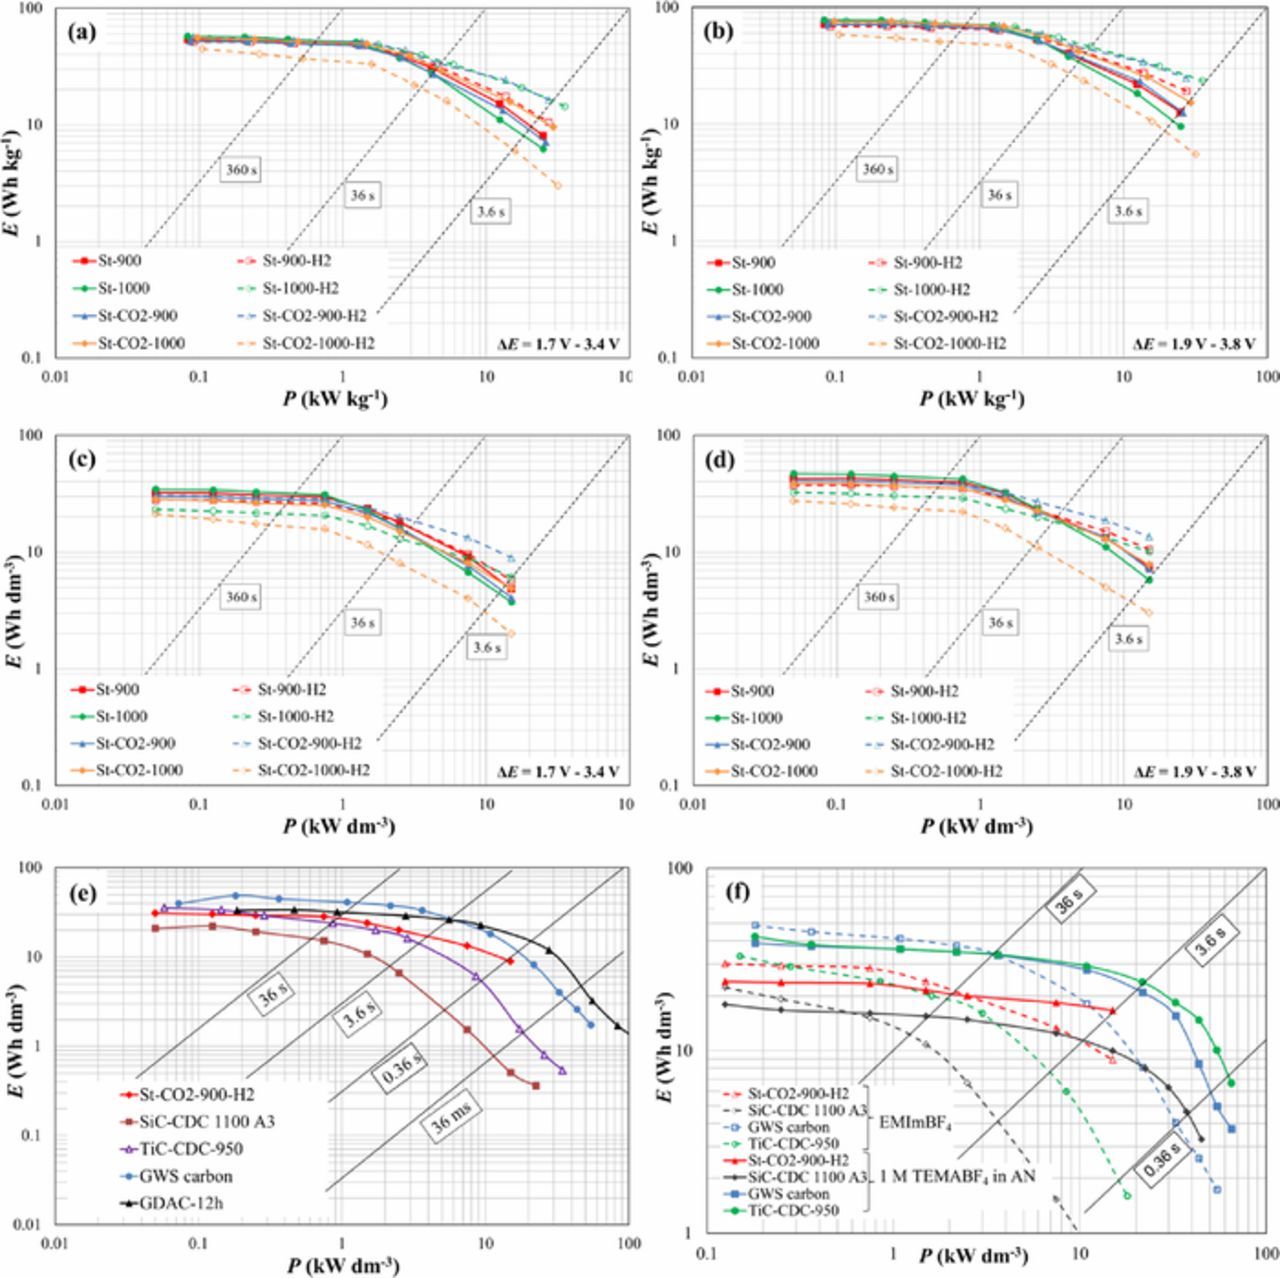
Figure 9. Gravimetric (a, b) and volumetric (c, d) Ragone plots for EDLCs completed using steam and CO2-steam co-activated SiC-CDC materials (noted in Figure and Table I) based electrodes, obtained from constant power tests within the cell potential range from 3.4 V to 1.7 V (a, c) and from 3.8 V to 1.9 V (b, d). Comparison with other EMImBF4 based EDLCs (e) and comparison of data for EMImBF4 and 1M TEMABF4 in AN based EDLCs as noted in Figure (f).
For all the materials under study very good performance has been established. At power density 1 kW kg−1 the highest energy densities of 52 Wh kg−1 (ΔE = 3.4 V, Fig. 9a) and 71 Wh kg−1 (ΔE = 3.8 V, Fig. 9b) were calculated for the material St-1000. The excellent volumetric energy densities at P = 1 kW dm−3, E = 27 Wh dm−3 (Fig. 9c) and 39 Wh dm−3 (Fig. 9d) at ΔE = 3.4 V and 3.8 V, respectively, have been achieved. At higher power density 10 kW kg−1, the St-CO2-900 showed the highest energy density values (28 Wh kg−1 and 12 Wh dm−3 at ΔE = 3.4 V and 37 Wh kg−1 and 17 Wh dm−3 at ΔE = 3.8 V). Thus, very high energy densities at high power densities can be achieved for steam and CO2-steam activated SiC-CDC carbon electrodes and EMImBF4 based EDLCs. Comparison with other EMImBF4 based EDLCs, given in Fig. 9e show, that for D-glucose (GDAC), granulated white sugar derived (GWS carbon) or TiC-CDC based EDLC3,17 higher energy density values at fixed Pmin (3.6 s) or Pmax (0.36 s) have been established. However, in this work very cheap raw SiC and cheap SiC-CDC synthesis methods have been used.1–3 Fig. 9f shows a comparison between EMImBF4 and 1 M Et3MeNBF4 in AN electrolytes for different carbon materials based EDLCs. It has to be noted that for the steam activated SiC-CDC (from this study) the difference between the electrolytes is the smallest. Even more, the SiC-CDC materials activated with only CO2 (from previous study1,2) show in ionic liquid significantly lower energy and power density values.
Life time test
Life time test was carried out for St-CO2-1000 + EMImBF4 based EDLC. CC/CD tests between cell potentials ΔE from 1.5 to 3.0 V at a constant current density of 1 A g−1 have been conducted (Fig. 10). The charge/discharge curves remained practically linear after 5000 cycles (Fig. 10, inset). The IR-drop was nearly constant up to 2000th cycle, after which it very slowly started to increase. Capacitance values decreased from 140 F g−1 to 107 F g−1. Energy efficiencies dropped from 96% to 94% (after 5000 cycles) and coulombic efficiencies remained during the cycling in the range of 97–99%. These results show that the steam activated SiC-CDC materials are very promising for various high energy storage applications.
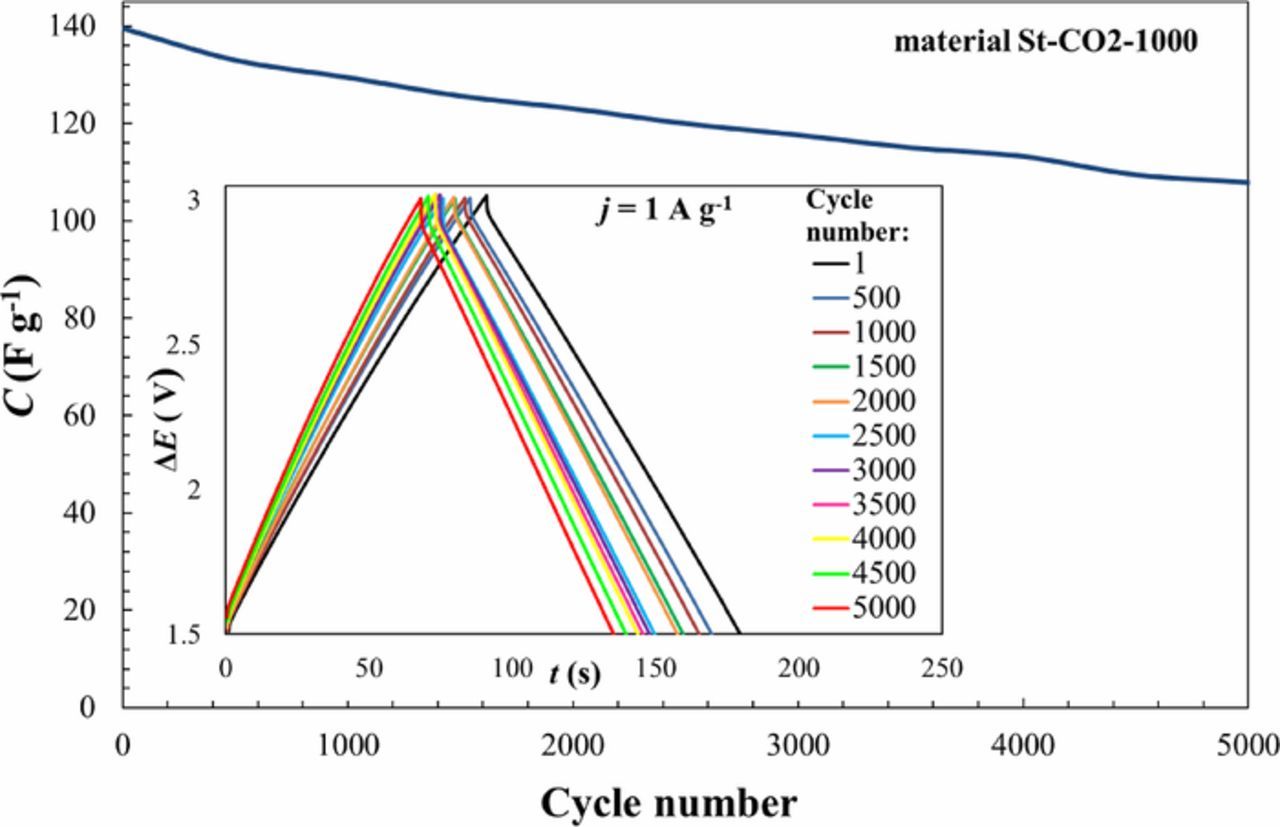
Figure 10. Capacitance vs. cycle number plot and life test charge/discharge cycles.
Conclusions
The EDLC cells based of two micro-mesoporous carbon electrodes (steam and CO2-steam activated SiC-CDC) in room-temperature ionic liquid (1-ethyl-3-methylimidazolium tetrafluoroborate, EMImBF4) have been tested by cyclic voltammetry (CV), constant current charge/discharge, electrochemical impedance spectroscopy and constant power discharge methods.
From CV data the specific capacitance vs. cell potential and surface charge density vs. cell potential curves for completed EDLC show that some materials have very high capacitance values and surface charge densities, but quite similar electrochemical behavior. The less active St-CO2-900 based EDLC has more similarities to the microporous CO2 activated materials based EDLCs, explained by the narrowest micro pore size distribution and lowest SBET, Vmicro and Vtot values. The highest specific capacitance value Cm;CV = 145 F g-1 has been obtained for the steam activated St-1000 material based EDLC, but the differences with other steam and CO2-steam activated materials capacitance values are quite moderate. Very high absolute phase angle values from −83 to −86° at low frequencies have been calculated, which also indicates existence of nearly ideally polarizable systems. Very short characteristic time constant values have been calculated, independent of ΔE, if ΔE ≤ 3.6 V, demonstrating that very wide ideal polarizability region has been established.
Compared to the previously studied CO2 activated materials, it is clear, that the steam activated carbon materials based EDLC have higher power and energy densities, i.e. better electrochemical performance in both, RTIL EMImBF4 and 1 M (C2H5)3CH3NBF4 acetonitrile solution electrolytes. Taking in consideration also the quicker and cheaper steam (and CO2-steam) activation method, the steam activated materials based EDLCs are overall more promising systems for high power and energy density sustainable energy recuperation systems.
Thus, the steam activated SiC-CDC materials are very promising for high power density supercapacitor applications in combination with EMImBF4 ionic liquid.
Acknowledgments
The present study was supported by the Estonian Centre of Excellence in Science project 3.2.0101.11-0030, by the EU through the European Regional Development Fund (TK141 "Advanced materials and high-technology devices for energy recuperation systems") Estonian institutional research project IUT20–13, personal research grant PUT1107.