Abstract
Sputter deposited germanium thin films were assembled in a half-cell configuration with lithium foil as counter/reference electrode and 1M LiPF6 in EC, DEC, DMC solution (1:1:1, wt%) as electrolyte. The Ge films were subjected to potentiostatic intermittent titration technique (PITT) and galvanostatic intermittent technique (GITT) conditions while simultaneously measuring the stress evolution in the electrodes. It was observed that the electrode stresses varied significantly in a single titration step during a GITT experiment, which violates the assumptions of simple Fickian transport model where the electrode stresses are usually neglected. Therefore, only the PITT data was analyzed to obtain the chemical diffusion coefficient  of Li in Ge. As expected, the diffusion coefficient value increased considerably with Li concentration; however, the
  values obtained during delithiation are at least two times greater than those obtained during lithiation at any given Li concentration, with the difference becoming significantly higher at higher Li concentration. This difference is attributed to the stress state, i.e., tensile stress during delithiation leads to higher
  values compared to the compressive stresses during lithiation. The data and observations presented here will be helpful in developing and using electrochemomechanical models in producing optimized electrode microstructures.
Export citation and abstract BibTeX RIS

This is an open access article distributed under the terms of the Creative Commons Attribution Non-Commercial No Derivatives 4.0 License (CC BY-NC-ND, http://creativecommons.org/licenses/by-nc-nd/4.0/), which permits non-commercial reuse, distribution, and reproduction in any medium, provided the original work is not changed in any way and is properly cited. For permission for commercial reuse, please email: oa@electrochem.org.
Solid-state diffusion of lithium through active material (in anodes and cathodes) is a crucial aspect of lithium-ion battery operation. For example, during charging of a battery, Li-ions diffuse through the bulk of a cathode particle (usually a transition metal oxide) to reach the particle/electrolyte interface, and they get transported across the electric double layer to enter into electrolyte solution where they diffuse in the electrolyte solution toward anode; the ions then get transported across the double layer to hop onto the anode surface and diffuse through its bulk; simultaneously, electrons travel from cathode to anode through an external circuit to maintain charge neutrality. This entire process proceeds in the opposite direction during discharging. As the diffusion coefficient of Li+ in liquid electrolyte is several orders of magnitude larger than that in solid active materials, and assuming that the interfacial ion transfer is fast, the rate-determining step in lithiation/delithiation process, in general, is the Li-ion diffusion in bulk of electrodes.1 Further, the solid-state diffusion phenomenon will be increasingly critical for all solid-state lithium-ion batteries.2 The ease of Li+ diffusion allows efficient use of active material available in electrodes, enhancing the overall performance of a battery, i.e., high specific capacity at high charge/discharge rates. Hence, the transport kinetics of lithium in electrodes not only dictate the power density but also the energy density of a battery.
Quantitative information about the transport phenomenon is essential to understand diffusion mechanisms and designing effective electrode architectures to optimize the power density and energy density of electrode materials. For example, mathematical models which attempt to simulate a range of physics from only electrochemistry3,4 to coupled electrochemistry and mechanics,5–9 rely on Li-ion diffusivities in active materials to predict key electrode characteristics such as charge/discharge rates, open circuit potentials, intercalation kinetics, and electrode stresses. Hence, reliable and accurate transport properties are critical for these models to accurately simulate battery operations either at a particle level or at an overall battery level for effective optimization of electrode microstructures. A precise method of diffusion coefficient measurement not only provides these properties but is also necessary to characterize the transport behavior of emerging electrode materials.
A large number of studies have been published on various methods which can provide transport properties of electrodes; among them, the transient electrochemical techniques developed by Weppner et al.10 and Wen et al.:11 the galvanostatic intermittent titration technique (GITT) and the potentiostatic intermittent titration technique (PITT) are the most widely used methods. These methods, which assume a simple Fickian diffusion model, were originally proposed for linear slab geometries (i.e., solid thin film electrodes) and were later modified to measure transport properties in various anode and cathode materials both in thin film and composite electrode configuration.12–18
Despite numerous modifications to PITT and GITT,12–18 none of the studies considered electrode stresses and the effect of stresses on the measured chemical diffusion coefficient. In other words, the above studies ignored the stresses in electrodes during electrochemical reactions. However, it is known that all the electrode materials experience mechanical stresses during electrochemical reactions: some to lesser extent and the others to a greater extent. For example, graphite which expands about 10% when fully lithiated is shown to experience a peak stress of −0.25 GPa,19 but most of the high energy density (typically large volume expansion) electrodes such as Si,20–22 SiO2,23 Sn,24 and Ge25,26 are subjected to stresses greater than 1 GPa during electrochemical reactions. It was also shown that this level of stresses could influence the open circuit potential of an electrode27,28 and lithiation/delithiation kinetics;29,30 hence, they may affect the transport of Li ions in electrodes. Hence, it is important to understand and quantify how the stresses in electrodes evolve during the diffusion coefficient measurement process (e.g. GITT and PITT), especially in large volume expansion electrode materials. Also, it is important to quantify the effect of stress on transport, because this could have implications on the fracture of electrode materials31 and reaction kinetics of the electrodes.29,30,32–34
The primary objectives of this study are:
- (1)To understand how the stresses in electrodes evolve during GITT and PITT experiments, and to identify which one of these methods will be suitable for large volume expansion materials; and
- (2)To understand and quantify the effect of stress on the chemical diffusion coefficient of Li in large volume expansion electrode materials.
To this end, sputter deposited Ge nano-films have been selected as a model electrode to achieve the objectives. The Ge thin film electrodes were assembled in a half-cell configuration with a thin foil of lithium as a reference/counter electrode. The electrodes were separated by a Celgard polymer separator. The planar thin film electrodes used here eliminate both geometrical and material complexities involved in the diffusion analysis of composite electrodes with complex shaped particles, binder, and conductive additives. Thin solid films are not only suitable for accurate stress measurements but are also ideal for fundamental electrochemical and transport property characterization. The Ge films in the half-cell were subjected to series of GITT and PITT protocols to measure the chemical diffusion coefficient as a function of Li concentration while simultaneously measuring the stresses in the electrodes using substrate curvature technique. It was observed that the chemical diffusion coefficient not only changes with Li concentration but is also a strong function of electrode stresses.
Experimental
Ge thin film electrode and electrochemical cell preparation
The electrodes were prepared by depositing 5 nm of Ti (adhesive layer) and 200 nm of Cu (current collector) followed by a 100 nm of Ge on a 2-inch double side polished fused silica wafer (525 μm thick, and 50.8 mm diameter). A schematic of different layers and their thickness is shown in Figure 1a (inset). The fused silica wafer serves as an elastic substrate for the purposes of curvature-based stress measurements, and it does not participate in the electrochemical reactions. The films were deposited by DC sputtering at a working pressure of less than 3 mTorr Ar while the base pressure before introducing the Ar gas was 4.4 × 10⁻⁶ Torr. Ge thin films sputter deposited under these conditions are known to be amorphous.25 The residual stresses developed in the Ge film due to the deposition process was measured by tracking the curvature changes of the substrate before and after the Ge film deposition.
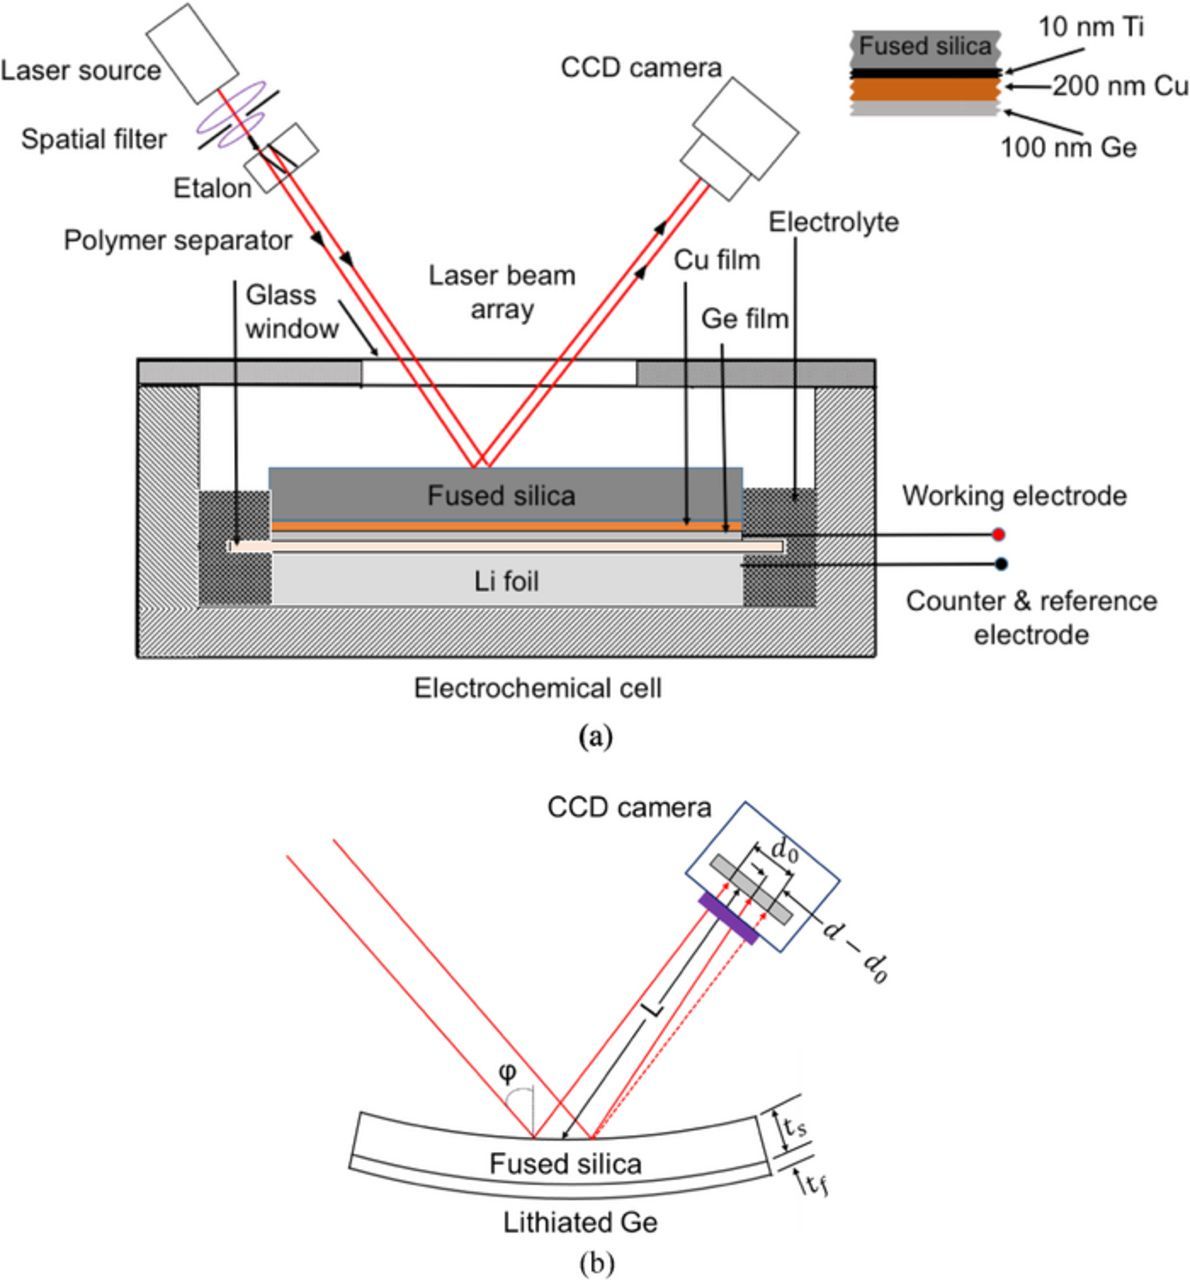
Li-ion half cells were assembled and tested in an argon-filled glove box (maintained at 25°C and with less than 0.1 ppm of O2 and H2O). The Ge thin film was used as working electrode and lithium foil (1.5 mm thick, 99.9% metal basis from Alfa Aesar) as counter/reference electrode, with a Celgard polymer separator preventing physical contact between the electrodes; the staking and orientation of the electrodes in the beaker cell is shown in Fig. 1. The electrolyte, a 1 M LiPF6 in 1:1:1 ratio (by wt%) of (EC) ethylene carbonate: (DEC) diethyl carbonate: (DMC) dimethyl carbonate (Selectilyte A2 series from BASF) was added to the beaker such that the lithium foil, Celgard polymer separator and Ge film were submerged in the electrolyte but the back surface of the elastic substrate (where the laser beam gets reflected from, see Fig. 1) was not submerged. This was done to prevent the laser from traversing in the electrolyte solution. A glass window was used to provide optical access to the sample as well as to seal the cell. Planar thin film electrodes were selected to avoid geometric and material (i.e binder and conductive additives) complexities associated with composite electrodes. A planar thin film configuration provides ideal conditions not only for studying/characterizing the diffusion phenomenon in electrodes (as the problem reduces to 1D diffusion) but also for measuring stress during electrochemical cycling.
Electrochemical measurements
Solartron 1470 E potentiostat was used to perform electrochemical experiments. Ge thin film electrodes were lithiated/delithiated under a constant current density of 5 μA/cm2 between 1.2 V vs. Li/Li+ (or open circuit potential) and 0.05 V vs. Li/Li+, similar to an earlier report.25 This was done to measure the baseline stress response of LixGe film as a function of Li concentration. In the PITT experiments, Ge thin film electrodes were lithiated at a constant current density of 5 μA/cm2 (which corresponds to C/17.5 rate) until the potential dropped down to 0.4 V vs Li/Li+ before applying a PITT protocol. When the film reached 0.4 V vs. Li/Li+, a step change of 50 mV was applied (i.e., to reach a new potential of 0.35 V vs Li/Li+) and it was held constant until the current decays to 0.25 μA/cm2. A sequence of these PITT protocols each resulting in a 50 mV decrease were carried out until the electrode potential dropped to 0.05 V vs Li/Li+. Lithiation below 0.05 V vs Li/Li+ was prevented to avoided any phase change behavior of LixGe.25 The film was then delithiated with a sequence of 50 mV vs Li/Li+ step increases until the potential reached 1.2 V vs Li/Li+ with a potential hold at each step until the current dropped to 0.25 μA/cm2. Throughout this experiment (i.e., all the PITT protocols during lithation and delithiation), the stress response and the current response of the film was recorded. In the GITT experiments, a single titration step consisted of galvanostatic lithiation at a current density of 5.72 μA/cm2 for 15 minutes followed by a relaxation step for 120 minutes. This protocol was continued until the potential of the electrode reached 0.05 V vs. Li/Li+, which resulted in a sequence of 15 GITT steps during lithiation. A similar process was followed during delithiation with 15 GITT steps. Throughout this experiment, the stress response and the potential response of Ge film was recorded. At least 3 fresh specimens were tested in each case (i.e., 3 samples for GITT, 3 samples for PITT, and 3 samples for galvanostatic experiment were measured), and all the samples tested in this study were cycled above 0.05 V vs. Li/Li+ to prevent amorphous to crystalline transformation of lithiated Germanium.35,25
In situ stress measurements
Stress response of amorphous Ge (a-Ge) thin film during the electrochemical cycling was measured by monitoring the substrate curvature with MOS setup (k-Space Associates, Dexter, MI) illustrated in Fig. 1. The experimental setup contains a laser source that generates a single collimated beam and a set of etalons, placed perpendicular to each other, which divide the single collimated beam into a 2 × 2 array of beams. During an experiment, this laser array is directed toward the sample (located in the glove box) and the reflected beams from the sample surface are captured by the CCD camera as shown in the schematic in Fig. 1. The curvature of the elastic substrate is determined in two directions (κx and κy, orthogonal to each other) from the changes in relative distance between the spots according to the equation,
![Equation ([1])](https://content.cld.iop.org/journals/1945-7111/165/10/A2194/revision1/d0001.gif)
where do is the initial distance between laser spots and d is the final distance. ∅ is the reflection angle of the beam and, L is the optical distance from the sample to the CCD camera as defined in Fig. 1b. Biaxial stress is measured from curvature using Stoney's equation as follows.
![Equation ([2])](https://content.cld.iop.org/journals/1945-7111/165/10/A2194/revision1/d0002.gif)
where ES, tS, and  are Young's modulus, thickness, and Poisson's ratio of the substrate, respectively. σr is residual stress, and tf is the Ge film thickness which evolves continuously during an experiment. Although there are no well-controlled direct experiments on the volume expansion behavior of Ge during electrochemical cycling, Liang et al.32 showed from a transmission-electron microscopy that Ge nanoparticles expanded up to 260% upon complete lithiation. As the elastic substrate constrains the Ge film (i.e., a constant area) in the current experiments, the volume change mainly occurs due to thickness change. Hence, a linear relation between film thickness, tf, and state of charge (SOC) is assumed as follows,
![Equation ([3])](https://content.cld.iop.org/journals/1945-7111/165/10/A2194/revision1/d0003.gif)
where t0f is the initial film thickness and m is state of charge which varies between 0 and 1. m = 1 corresponds to full capacity (1625 mAh/g) and a volumetric strain of 2.6.32
Results and Discussion
Stress evolution during galvanostatic, PITT, and GITT experiments
Figures 2a and 2b show the variation of potential and biaxial film stress, respectively, as a function of lithium concentration in Ge film during a galvanostatic lithiation/delithiation process. Upon lithiation the potential of the film drops sharply from an open circuit value of ∼3.0 to 0.5 V vs. Li/Li+ and decreases gradually thereafter with the Li concentration to a value of 0.05 V vs. Li/Li+. This indicates that the lithiation of Ge film started approximately at 0.5 V vs. Li/Li+. Upon delithiation, the potential rises quickly to 0.25 V vs. Li/Li+ and thereafter it increases gradually with decrease in lithium concentration until x < 1 (i.e., at low lithium concentration values) at which the potential starts to rise quickly. The absence of flat regions in the potential curve (both during lithiation/delithiation) suggests that the sputtered a-Ge film remains amorphous LixGe throughout the lithiation/delithiation cycling, i.e., addition (or removal) of Li to amorphous Ge leads to an amorphous LixGe alloy (a homogeneous solid solution). This behavior is similar to that observed in previous reports on Ge electrode.25,34,36
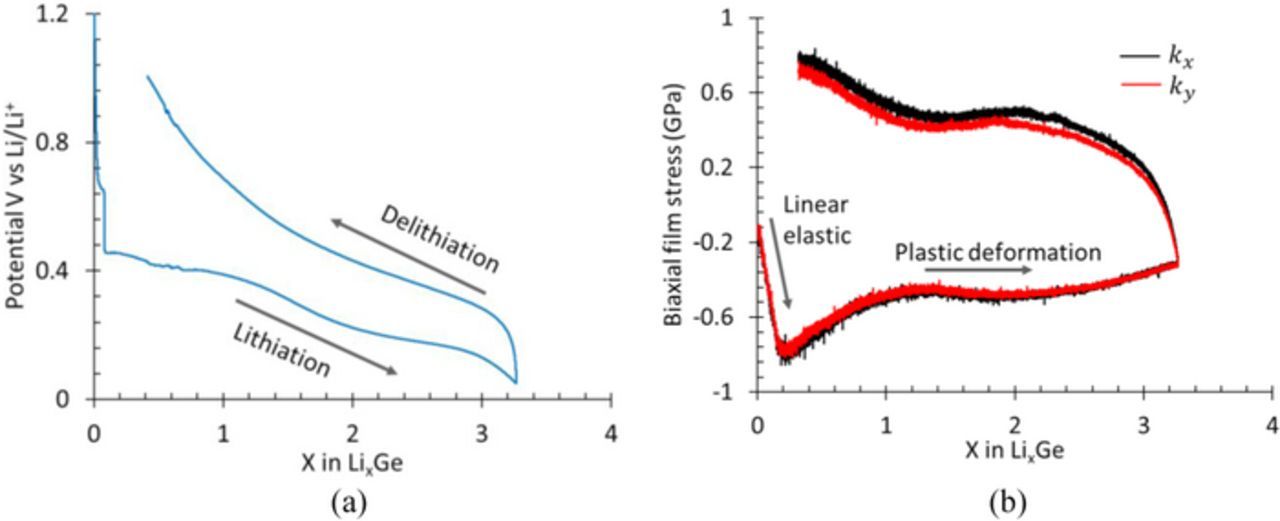
Figure 2. (a) and (b) show potential and stress, respectively, as a function of lithium concentration (i.e., x in LixGe) during galvanostatic lithiation/delithiation.
Fig. 2b shows that the stress in the Ge film is non-zero (−0.134 GPa) at zero lithium concentration (i.e., at x = 0), which is due to the residual stresses in the film. In general, depending on the thermal expansion coefficient properties of film/substrate system, thin films have residual stresses due to relatively high temperature deposition process (magnetron sputtering) followed by subsequent cooling to room temperature. The residual stresses in the present Ge samples varied from −0.134 to −0.243 GPa. During lithiation, i.e., when lithium enters the Ge film, the in-plane (i.e., x-y plane) expansion of the film is constrained by the rigid elastic substrate (i.e., fused silica, see Fig. 1b) resulting in biaxial compressive stress in the film; the film expands freely in the out-of-plane (or z) direction. The red and black curves in Fig. 2b represent the stress data corresponding to two different directions (x and y), orthogonal to each other; the fact that the stress values are almost same in both directions at any given lithium concentration means that the film expansion is isotropic and proves that the stress state is equi-biaxial.
Note from Fig. 2b that, initially, the compressive stress (indicated by negative value) increased linearly with Li concentration to a peak value of −0.8 GPa (at x = 0.2, i.e., Li0.2Ge); with further lithiation, the stress response becomes non-linear (at x = 0.2) and decreases to −0.5 GPa (at x = 1, i.e., LiGe). The stress remains almost constant at −0.5 GPa for the major portion of lithiation but decreases to −0.34 GPa at the end of lithiation. The initial linear stress response of the film is attributed to the elastic response, but as the lithium concentration increases beyond 0.2, i.e., x > 0.2, LixGe starts to undergo plastic deformation resulting in non-linear response; the plastic deformation continues until the end of lithiation. Upon delithiation, the stress increases rapidly and becomes positive (i.e., tensile stress) within a small decrease in lithium concentration; this rapid linear increase due to removal of lithium from the film is due to elastic unloading of the film, which can occur at any lithium concentration. Note that elastic unloading leads to significant changes in stress with small changes in lithium concentration. With further delithiation, the stress response becomes non-linear (i.e., plastic deformation) at 0.3 GPa, increases slightly to 0.5 GPa, and remains almost constant before increasing as Li concentration decreases below 1 (or x < 1), mirroring the stress response during lithiation process. These observations agree with those reported in previous reports.25,26,37 It should be noted that the stress values presented in the Fig. 2b should be thought of as the yield stress of LixGe as a function of Li concentration. This is the basic information that one needs to be able to simulate the coupled large deformation kinematics and electrochemistry of battery electrodes.7,8,38,39
The standard GITT or PITT analysis for evaluating diffusion coefficient ignores electrode stresses or change in stress in a given titration step. To be able to use a similar approach, one should make sure that the change in electrode stresses during a single titration step (either in PITT or GITT) must be negligible. Hence, it would be ideal to conduct the titration steps when the electrode undergoes plastic deformation (i.e., for x > 1 during lithiation and x < 3 during delithiation in Fig. 2b), because in this region stress remains almost constant with Li concentration as long the elastic unloading of the film (i.e., either removal of lithium from electrode during lithiation process or adding lithium to electrode during delithiation process) is prevented. Fig. 3a shows the prescribed potential steps (blue) and the corresponding current response of the film (red) in a PITT experiment. Note that the Ge film was lithiated galvanostatically until it starts deforming plastically (0.4 V vs. Li/Li+ or x > 1) before applying PITT protocols. It can be observed that during the potential holds, the current decays exponentially from an arbitrarily large value at the beginning of the titration step (due to sudden increase of potential) to a negligibly small value at the end, but in each titration step the electrode is continued to be lithiated (or delithiated) which prevented elastic unloading.
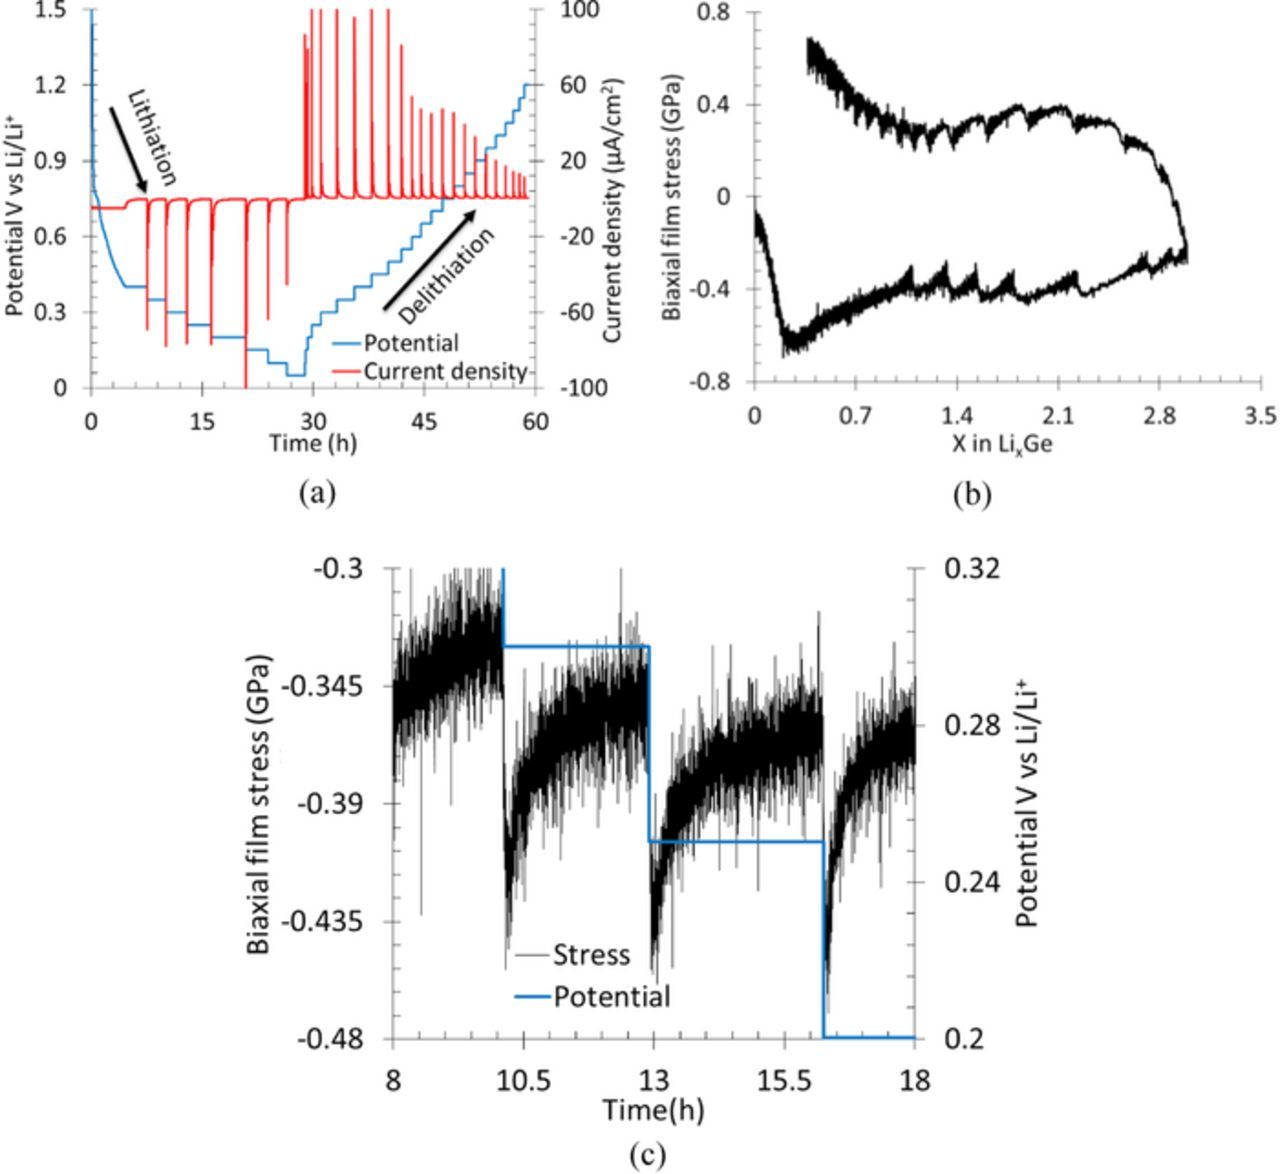
Figure 3. (a) Shows the current response of the Ge film (in red) to the applied step potentials (in blue) during a PITT experiment, (b) shows the stress evolution as a function of lithium concentration due to the prescribed potential history, and (c) shows that typical stress change (increase/decrease) in a given titration step is between ∼80 to 90 MPa during PITT protocols.
Fig. 3b shows the evolution of electrode stress as a function of lithium concentration in response to the prescribed potential history showed in Fig. 3a. Note that the overall stress response of the film as a function of lithium concentration is similar to that showed in Fig. 2b, but there is a slight variation in the electrode stress in a single titration step; a zoomed in view of stress and potential variation in a typical PITT titration step is shown in Fig. 3c for clarity. Although the lithium concentration was increasing monotonically, which should have resulted in almost constant stress (for x > 1 according to Fig. 2b), the stress changed slightly within a given titration step, with some potential holds resulting in a stress change of 60 MPa and others 90 MPa. This stress variation can be attributed to the strain-rate sensitivity of the lithiated Ge film. Nadimpalli et al.25 and Pharr et al.26 showed that the stresses in lithiated Ge film are not just the function of lithium concentration but are also functions of lithiation/delithiation rate (or strain-rate). In other words, besides lithium concentration, the electrode stress may weakly (or strongly) depend on the applied current, with higher current densities (or higher strain-rates) generally resulting in higher electrode stresses; for example, note from Fig. 3c that the stress response in a single potential hold mimics (qualitatively) the exponential decay in current. A highly rate sensitive (rate-insensitive) material compared to LixGe would have resulted in more (less) than 90 MPa of stress change in a single titration step if subjected to the exact loading history shown in Fig. 3a.
Figs. 4a, 4b, and 4c show the prescribed electrochemical loading history, variation of stress as a function of lithium concentration, and the details of stress evolution in individual titration steps, respectively, in GITT experiments. A total of 15 titration steps during lithiation and 15 steps during delithiation can be seen in the Fig. 4a. In a single titration step, a constant current (i.e., constant flux, denoted by red curve) was prescribed for a small amount of time followed by an open circuit condition to let the electrode potential (or Li concentration) relax toward its equilibrium potential (equilibrium Li concentration). The potential relaxation as a function of time is due to transport of Li through Ge electrode; by modeling this transport process using a simple Fick's law, transport properties such as diffusion coefficients were obtained for several electrode materials.13,16,17,40–44 However, Figs. 4b and 4c show that the electrode stresses in lithiated Ge tend to relax toward an equilibrium value during the potential relaxation, which resulted in a change in stress as high as 0.5 GPa in a single titration step during the GITT experiments. This is a significant change compared to that observed in the PITT experiments (Fig. 3) and too big to be ignored in the diffusion analysis for diffusion coefficient measurement.
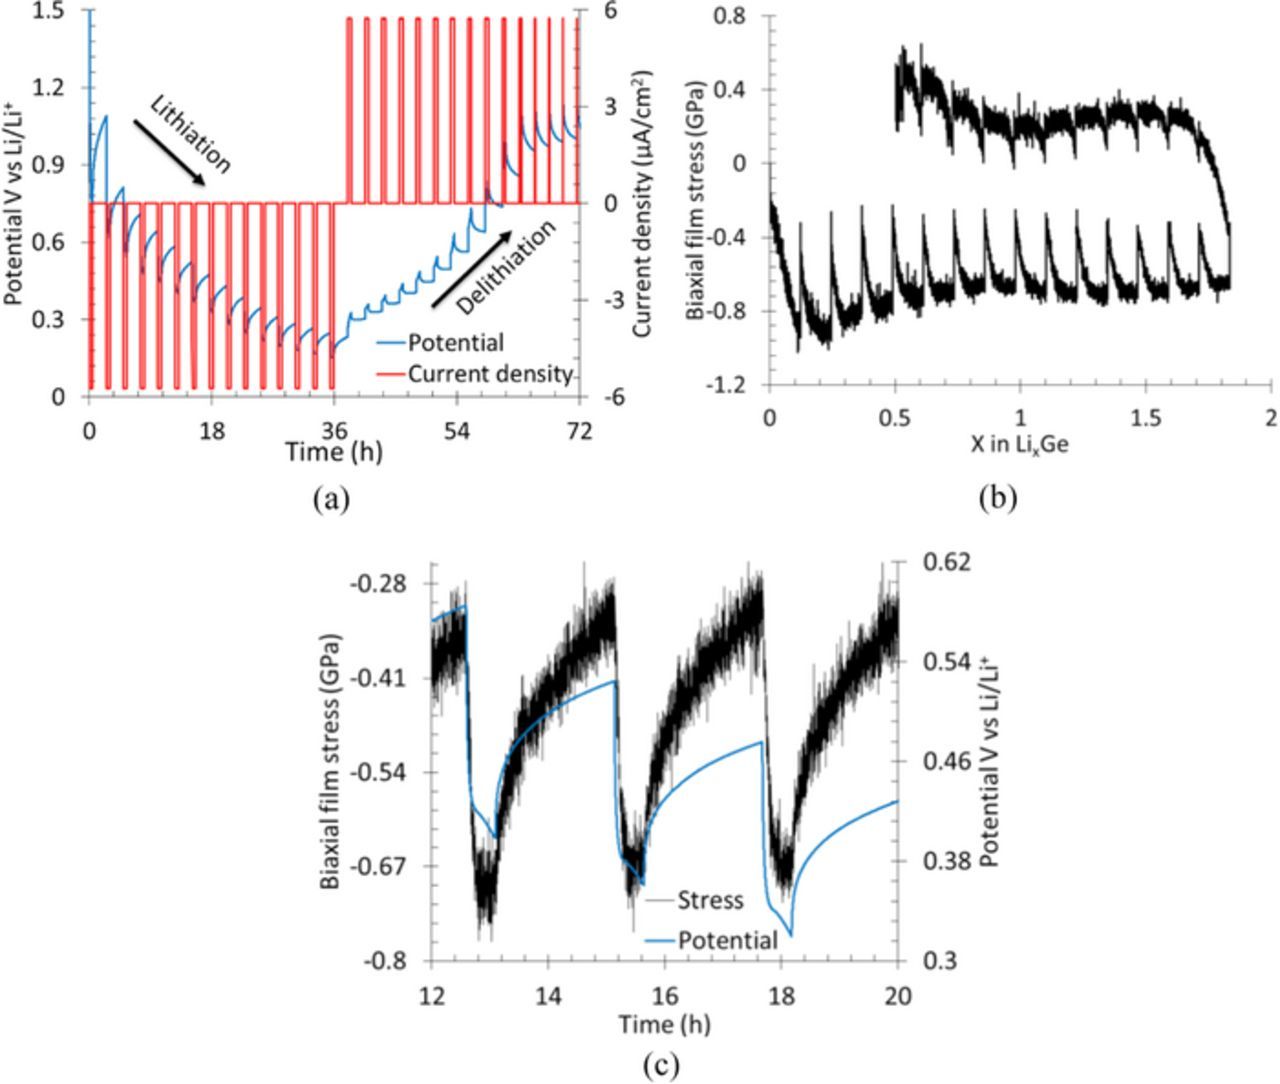
Figure 4. (a) Shows the potential response of Ge thin film electrode (in blue) to the applied step currents (in red) during a GITT experiment, (b) shows the stress evolution as a function of lithium concentration due to the prescribed current history, and (c) shows that typical stress change (increase/decrease) in a single titration step is ∼350 MPa to 500 MPa.
Hence, for electrode materials such as Ge, and other similar large volume change materials (Si, Sn, Al, and their alloys), the stress changes in a GITT experiment may be significant; therefore, the analysis based on simple Fickian diffusion model for evaluating chemical diffusion coefficient may lead to errors. An elaborate transport model with multiphysics material behavior which couples large deformation plasticity along with electrochemisty, such as the model as presented by Bucci et al.8,45 may be required. However, if the electrode material such as Ge in Fig. 3 is not a strong rate sensitive material, stress change during a single titration step in PITT is significantly smaller, and the analysis method based on simple Fickian model can be employed with relatively low error. It is instructive to use a simple model to understand how the chemical diffusion coefficient will be affected by the concentration and stress in a solid active material.
Effect of stress on chemical diffusion coefficient
As the variation of stress in a single titration step was considerably large in GITT experiments, only the data from PITT experiments was analyzed to obtain the chemical diffusion coefficients. The schematic in Fig. 5 illustrates the one-dimensional transport of Li+ in Ge thin film considered here and defines various parameters used in the model. Similar to Ref. 11, the chemical diffusion process of Li in Ge thin film is assumed to obey 1D Fick's law,
![Equation ([4])](https://content.cld.iop.org/journals/1945-7111/165/10/A2194/revision1/d0004.gif)
where c and  are concentration and the chemical diffusion coefficient of Li+ in germanium, respectively; t is time (s) and z is the coordinate (representing out-of-plane direction) defined in Fig. 5. As mentioned earlier, the ion transfer kinetics at the interface and the diffusion of Li-ions in the electrolyte are assumed to be significantly faster than the diffusion of Li-ion through Ge film, which is a reasonable assumption.1 Also, the solid electrolyte interphase formation at the Ge film and electrolyte interface (i.e., at z = 0 in Fig. 5) is neglected.
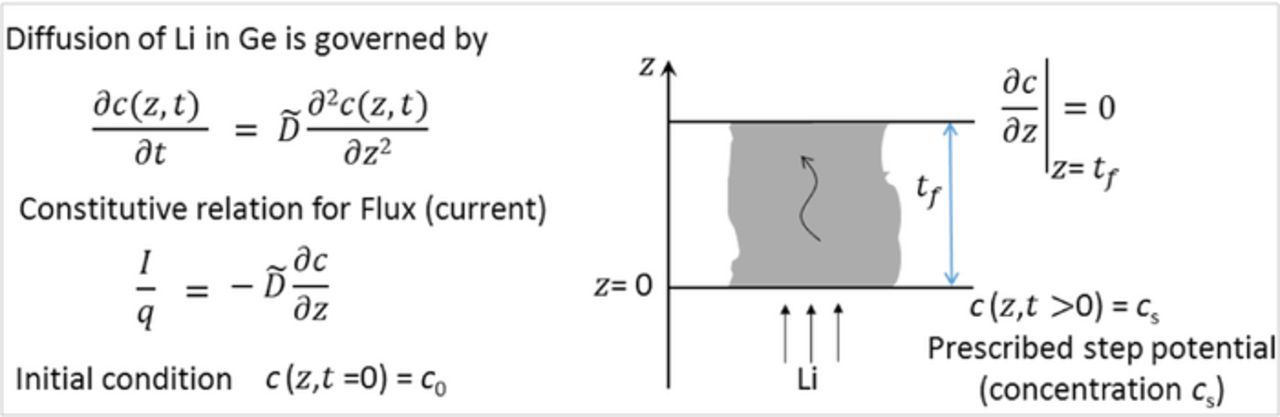
Figure 5. Schematic of the 1-dimensional chemical diffusion of Li-ion in germanium thin film electrode (according Fick's law) with z = 0 representing the interface between the Ge film and the electrolyte. tf is the thickness of lithiated Ge film at a given state of charge as per Eq. 3. The boundary conditions corresponding to a PITT experiment are also shown.
The flux of Li+ (i.e., current) required to maintain a constant potential (i.e., a constant concentration of Li+ on the electrode surface) in a PITT step can be obtained by solving the Eq. 4 with boundary conditions shown in Fig. 5. The solution to this problem, i.e., the current as a function of time in the long-time duration approximation (t >> t2f / ) is,
) is,
![Equation ([5])](https://content.cld.iop.org/journals/1945-7111/165/10/A2194/revision1/d0005.gif)
where tf is electrode thickness (cm), obtained according to Eq. 3, and Q is the charge accumulated (or lost) in a single titration step estimated as,
![Equation ([6])](https://content.cld.iop.org/journals/1945-7111/165/10/A2194/revision1/d0006.gif)
It can be noted that taking the natural logarithm on both sides of Eq. 5 will result in the following equation for a straight line,
![Equation ([7])](https://content.cld.iop.org/journals/1945-7111/165/10/A2194/revision1/d0007.gif)
with  as the y-intercept and
  as the slope; the chemical diffusion coefficient
 can be evaluated from either the intercept or the slope. As per Wen et al.,11 both approaches should result in similar
  values, which is what we have observed for few calculations that were performed for one case during delithiation. Hence, we chose the slope method for our case as it eliminates additional calculations (Eq. 6) of estimating Q.
Fig. 6 shows the ln (I) as a function of time of the data from a typical titration step in the PITT experiment (dotted line) along with a linear fit (Eq. 7) to the data; the fit is considered good if R2 > 99.5. As expected, the experimental data agrees reasonably well with Eq. 7 at longer times (i.e., at later stages of diffusion in a titration step) but not at the beginning of the potential step, because Eq. 7 was obtained for long-time approximation. The slope value from the fit at each titration step and the film thickness tf are then used to determine the at any given Li concentration and electrode stress level. Note that the film thickness changes slightly during the titration step; hence, the average of thickness at the beginning and at the end was used in the estimation of
 .
.
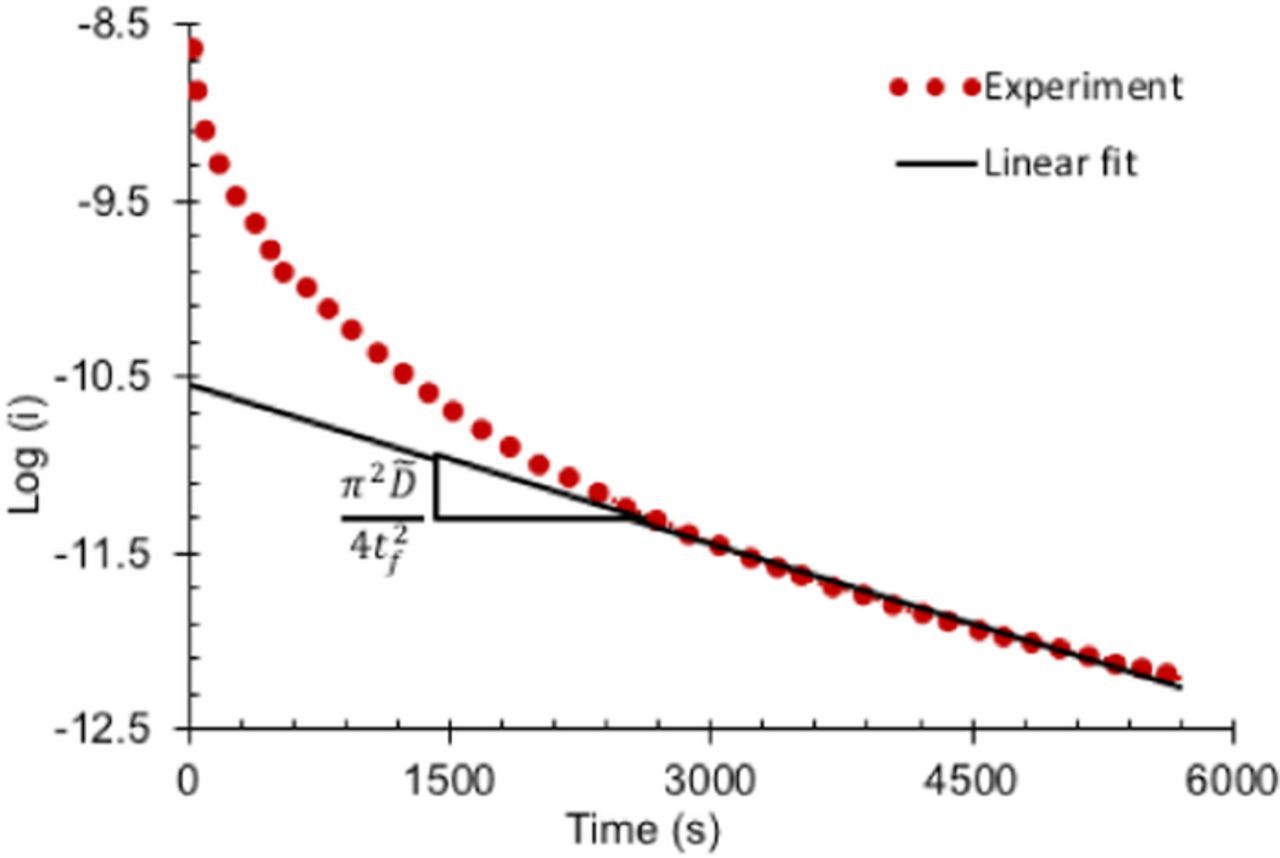
Figure 6. Variation of logarithm of current plotted as a function of time in a typical titration step (during PITT). The linear fit of Eq. 7 to the data agrees well at the longer time, i.e., at t >> t2f / . The slope of the curve provides the information necessary for evaluating
  .
.
Fig. 7a shows the variation of chemical diffusion coefficient  as a function of electrode stress and lithium concentration obtained from the PITT experiment corresponding to Fig. 3. The solid line with filled circles corresponds to the
  values obtained during lithiation process whereas the line with filled triangles represents the data obtained during delithiation; the stress state during lithiation and delithiation (at any concentration) is given by the thick solid black curve. Note that the
 increases significantly with Li concentration both during lithiation and delithiation; for example, it increases from a value of 30 × 10−15 cm2/s at x = 0.1 to a value greater than 150 × 10−15 at x > 3.1 during delithiation. In addition, the
  values obtained during lithiation are smaller than those obtained from the delithiation process at any given lithium concentration, and the difference (or offset in
  at any particular concentration) increases with concentration. For example, at x = 1.4, the
  values obtained during delithiation are twice the value obtained during lithiation, and the delithiation values becomes four times more at x = 2.8. These observations are consistent among the data obtained from three different samples, see Fig. 7b. The
  values obtained here are a couple of orders of magnitude lower than those reported by Laforge et al.34 which could be attributed to the differences in their sample configuration and measurement method. However, the measured diffusion coefficient values of Li in Ge are higher than those obtained in Si, suggesting that Ge will offer a better rate capability (i.e., power density) than the Si electrodes which is in agreement with the previous studies.34,35
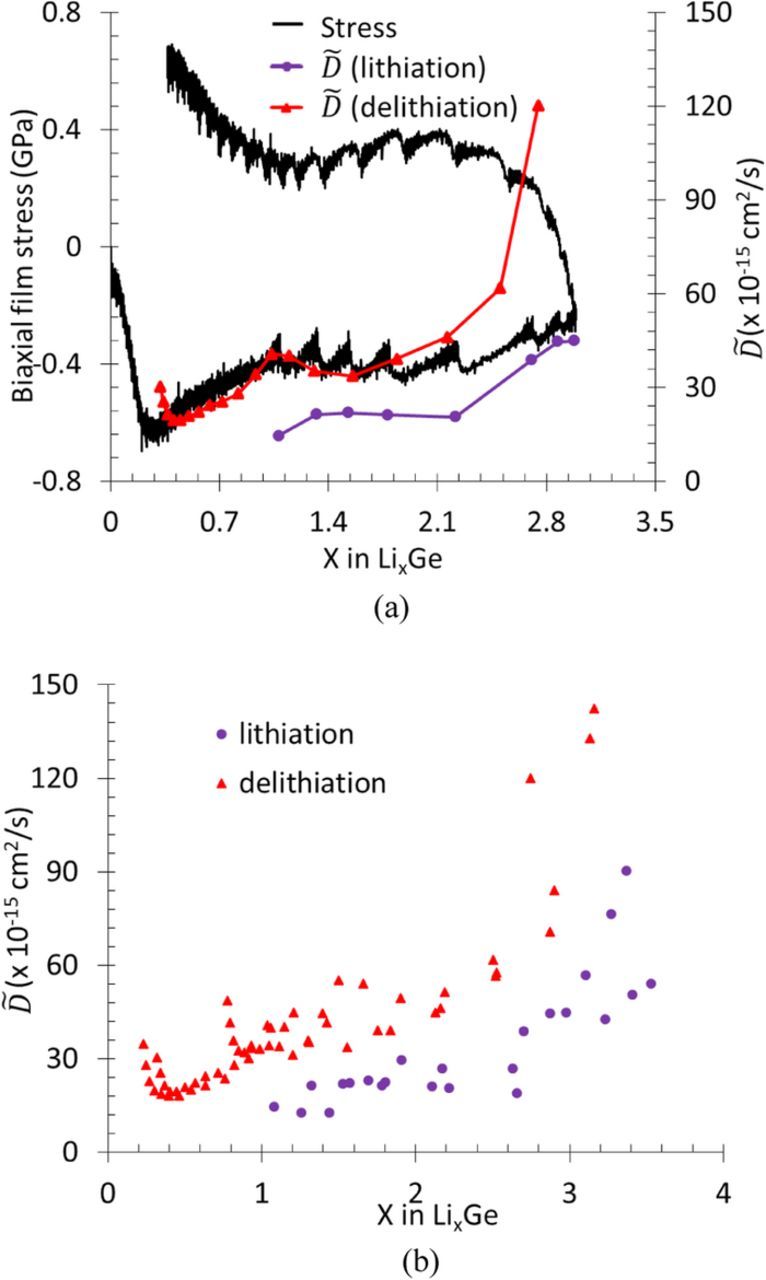
Figure 7. (a) Chemical diffusion coefficient  and stress plotted as a function of lithium concentration during a PITT experiment, and in (b) the
  values obtained from three different samples are shown. Note that
  increases with Li concentration in all the samples, and the tensile stresses enhance while compressive stresses impede Li transport.
According to Wepner and Huggins,10 the chemical diffusion coefficient  is given by
![Equation ([8])](https://content.cld.iop.org/journals/1945-7111/165/10/A2194/revision1/d0008.gif)
where W is an enhancement factor (which contains contributions from thermodynamic and mechanical factors) and D is the component diffusion (or intrinsic-diffusion) coefficient. Using a chemical potential that takes into account the electrode stresses in addition to Li concentration, Bucci et al. showed that the enhancement factor in the above equation can be given as,
![Equation ([9])](https://content.cld.iop.org/journals/1945-7111/165/10/A2194/revision1/d0009.gif)
where cmax is the maximum value of Li concentration (which is 3.75 for Ge), γ the activity coefficient (which approaches 1 as c approaches 0), μ the chemical potential. The R and T are universal gas constant (8.314 J/mol. K) and temperature (T = 298 oK), respectively. The first two terms (with in square brackets) in the equation are chemical contribution to the diffusivity enhancement and the remaining term is the contribution from mechanical stresses in the electrode. It is instructive to make first order estimates of the relative contributions from chemical and mechanical terms to the enhancement factor given in Eq. 9. The procedure for evaluating γ is not trivial and described in Verbrugge et al,46 Bucci et al;8 however, for very low lithium concentrations, it is reasonable to assume γ to be 1. Consequently, only one term in the square brackets remains. Using the Larché-Cahn theory Sethuraman et al.28 have derived stress-potential coupling for a thin Si film electrode; following the same approach for Ge film in this study, the stress-chemical potential coupling term is given as:
![Equation ([10])](https://content.cld.iop.org/journals/1945-7111/165/10/A2194/revision1/d0010.gif)
where, μ is the chemical potential, νGe is the partial molar volume of Ge, η is the rate of change of volumetric strain (εv) in the Ge electrode due to lithiation, defined as  . The density of germanium (near 300 °K) is 5.32 g/cm3 from which vGe ∼ 13.65 cm3/mol. From published results on the rate of volumetric expansion of germanium, η = 0.59 (Liang et al.32). Using these values, the stress-chemical potential coupling in this system is estimated to be
  . The term
  is the slope of stress versus concentration curve showed in Fig. 2b and is approximately Mη at low lithium concentration,8 where M is biaxial modulus. Tripuraneni and Nadimpalli47 measured the biaxial modulus of lithiated Ge and for the low concentration of lithium the value is 45 GPa. Substituting all the values of parameters, the ratio of the mechanical to chemical terms in Eq. 9 at low Li concentration is approximately 5.6, suggesting a strong contribution from the stress, i.e., the variation in the
  is due to combination of stress and concentration. This estimate is very close to the value of 11 estimated by Papakiriyoku et al.48 for Li1.3Ge material. However, at the very high lithium concentration levels (i.e., as c → cmax), the chemical enhancement factor will become larger along with mechanical contribution as the term
  increases rapidly at the end. This could be noticed from the sharp increase in
  at the end of lithiation in Fig. 7a.
Figure 7a shows that the nature of stress also influences the transport, i.e.,  values obtained during lithiation (i.e., when the film was under compressive stress) are less than those obtained during delithiation (i.e., when the film was under tensile stress). For example, the
  value at x = 1.4 during delithiation (40 × 10−15 cm2/s) is twice the value (20 × 10−15 cm2/s) at the same Li concentration during lithiaton (x = 1.4), because in the former case the electrode is under tension with a stress value of 0.4 GPa whereas in the latter case it was under a compressive stress of −0.4 GPa. A similar effect of stress on transport was reported by Aziz et al.49 where it was shown experimentally that the tensile stress enhanced the rate of solid-phase epitaxial-growth rate of crystalline Si from amorphous Si while compressive stress impeded the reaction. Some evidence of stress on lithiation was provided by Gu et al.,36 which showed that when a bent nanotube was reacted with Li, the regions under tensile stress lithiated relatively faster than those under compressive stress; their qualitative observation provides further support to the data presented in Fig. 7a. This can be further understood through an activation energy based argument. For example, diffusion of a solute atom in a lattice can be described as a sequence of jumps from one interstitial lattice site to an adjacent site by surmounting the energy barrier caused by surrounding atoms. Haftabaradaran et al.50 showed that a compressive stress increases this energy barrier (i.e., impedes diffusion) while tensile stress reduces the energy barrier (i.e., promotes diffusion). Atomic structure and associated changes in atomic arrangement could also contribute to the activation energy barrier; however, it is reasonable to assume that stress is the primary reason for the observed offset in
  values presented in Fig. 7 and not the atomic structure. This is because all the sputtered Ge films (which are amorphous to begin with) in the current study were cycled above 50 mV vs. Li/Li+ which ensured that the film remained amorphous throughout the experiment; the continuously varying potential in Fig. 2a supports this and agrees with earlier in situ XRD studies.35 As a result, at a given Li concentration, one can expect a similar atomic environment at any given location in the film irrespective of lithiation/delithiation process, ruling out the possibility; hence, proving further support to the argument that the stress is the primary contributing factor to the observed offset in
  values at any given concentration in Fig. 7.
In summary, the data presented here shows that the chemical diffusion coefficient  is a strong function of not only Li concentration but also electrode stresses. This is very important in the context of next generation high energy density anode materials, which are usually subjected to significant stresses during electrochemical cycling due to large volume expansion behavior; also, the observations are directly relevant to all solid-state batteries which are in general thin films with similar mechanical constraints as the Ge electrodes in this study. Therefore, ignoring the effect of stress on diffusion coefficient in battery models may lead to errors in estimated electrode stresses, electrode potentials, and lithiation/delithiation kinetics. Therefore, the multiphysics models that attempt to simulate the battery operation, for example,6,45,51,52 should consider the effect of both Li concentration and electrode stresses on Li transport as per Fig. 7. It should be noted that the
  values presented here should be considered as first order estimates due to the assumptions mentioned above. Nonetheless, the data and the observations made in this study are crucial for electrochemomechanics modeling of batteries and subsequent design/optimization of superior electrodes.
Conclusions
To understand and quantify the effect of stresses on the chemical diffusion coefficient of Li, germanium was used as a model high energy density electrode. The sputter deposited Ge thin films were assembled in a half-cell configuration with a lithium foil as a reference/counter electrode. The electrodes were subjected to series of GITT and PITT protocols to measure the chemical diffusion coefficient as a function of Li concentration while simultaneously measuring the stresses in the electrodes using substrate curvature technique. To minimize the variation of stress, the titration steps were conducted when the electrode undergoes plastic deformation. In spite of this, a marginal change in stress (a change of ∼60–90 MPa) was observed within a given titration step during a PITT experiment, which is due to the strain-rate sensitivity of electrode. A highly rate sensitive (rate-insensitive) material compared to LixGe would have resulted in more (less) than 90 MPa of stress change in a single titration step if subjected to the exact loading history. In contrast, the variation of stresses within a single titration step during GITT experiment was significant, i.e., 0.5 GPa, and is too big to be ignored in the analysis for evaluating diffusion coefficient. Hence, for electrode materials such as Ge, and other similar large volume change materials (Si, Sn, Al, and their alloys), the stress changes in a GITT experiment may be significant.
Consequently, only the data from PITT experiment was analyzed to obtain the chemical diffusion coefficient value. As expected, the increases significantly with Li concentration both during lithiation and delithiation; for example, it increases from a value of 30 × 10−15 cm2/s at x = 0.1 to a value greater than 150 × 10−15 at x > 3.1 for delithiation. In addition, the
  values obtained during lithiation are at least two times smaller than those obtained from the delithiation process at any given lithium concentration with the difference increasing to as high as four times at higher Li concentration. It was demonstrated that the stress contribution to the transport processes is significant and the nature of stress (i.e., tension vs. compression) has significant effect on the Li transport. For example, the
  value at x = 1.4 during delithiation (40 × 10−15 cm2/s) is twice the value (20 × 10−15 cm2/s) at the same Li concentration during lithiaton (x = 1.4), because in the former case the electrode is under tension with a stress value of 0.4 GPa whereas in the latter case it was under a compressive stress of −0.4 GPa. Hence, the data shows quantitatively that the tensile stress enhances transport while compressive stress impedes it. In summary, the data presented here show that the chemical diffusion coefficient
  is a strong function of Li concentration as well as electrode stresses. This is a crucial data for electrochemomechanics modeling of batteries and subsequent design of superior electrodes.
Acknowledgments
Authors gratefully acknowledge funding from the National Science Foundation through the grant NSF-CMMI-1652409.
ORCID
Siva P. V. Nadimpalli 0000-0001-9281-4842