Abstract
Rechargeable fuel-cell batteries (RFCBs) that employ organic chemical hydrides as hydrogen storage media have potential as next-generation power sources; however, the reversible storage and release of hydrogen remains a significant challenge. In particular, the hydrogenation of organic compounds during cell charge is difficult to achieve with 100% conversion. However, this report demonstrates that quinones, especially anthraquinone (AQ), can function as a hydrogen carrier for RFCBs, where AQ is hydrogenated to anthrahydroquinone (AH2Q) during charge and AH2Q is dehydrogenated to AQ during discharge. This redox reaction occurred at a more positive potential than that for hydrogen reduction, so that undesired hydrogen production can be avoided by adjusting the charge voltage to 1 V. The resulting RFCB maintained 100% electrical capacity at room temperature, 91% at 50°C, and 63% at 75°C of the respective initial performance with coulombic efficiencies greater than 90% after 300 cycles. Moreover, the RFCB functioned as a secondary battery with energy densities of 0.8–3.4 Wh kg−1, power densities of 9.5–258.9 W kg−1, and as a fuel cell with power densities of 0.001–0.26 W cm−3. Based on the performance and degradation data, the limitations of this RFCB and directions for future research are discussed.
Export citation and abstract BibTeX RIS

This is an open access article distributed under the terms of the Creative Commons Attribution 4.0 License (CC BY, http://creativecommons.org/licenses/by/4.0/), which permits unrestricted reuse of the work in any medium, provided the original work is properly cited.
A system or device capable of operating an electrochemical cell alternately in electrolyzer and fuel cell modes is called a rechargeable or regenerative fuel cell (RFC).1,2 Applications for RFCs include large-scale renewable energy storage and middle-scale emergency or auxiliary power sources,3 where hydrogen is usually stored outside the fuel cell to obtain substantially high energy. In contrast, RFCs can be used as energy storage systems for portable electronic devices by integration of the fuel cell with the hydrogen storage medium; however, such electrochemical cells should be classified as batteries rather than fuel cells, because the fuel is not supplied from an external source, but is an integral part of the device.4 Thus, we have designated this type of cell as a rechargeable fuel-cell battery (RFCB).
Hydrogen storage with high capacity, excellent reversibility, and good cycle stability is a key technology for both RFC and RFCB. Typical hydrogen storage methods (in addition to liquefaction or compression of hydrogen) include the physical and chemical adsorption of hydrogen atoms or molecules into materials such as activated carbon and metal hydrides. Activated carbon often requires low temperatures (>−200°C) and/or high pressures (<10 MPa) to achieve high hydrogen adsorption capacity.5 Metal hydrides typically release hydrogen at high temperatures (>150°C).6 Thus, it is difficult to use these materials as reversible hydrogen carriers for RFCBs because a series of hydrogen production, storage, supply, and utilization processes cannot be conducted under the RFCB operating conditions (e.g., room temperature to 80°C at ambient pressure).
Organic chemical hydrides, such as benzene/cyclohexane, toluene/methylcyclohexane, and naphthalene/decaline, are regarded as promising hydrogen storage media, due to their reasonable gravimetric storage capacities of 7.1 wt% for cyclohexane, 6.1 wt% for methylcyclohexane, and 7.2 wt% for decaline.7 Catalytic hydrogenation/dehydrogenation reactions of these hydrocarbons must be conducted at temperatures greater than 200°C, whereas they can be driven electrochemically, even at the operation temperatures of a proton exchange membrane (PEM) fuel cell (ca. 80°C). For an RFC based on the benzene/cyclohexane redox reaction, as an example, a discharge voltage of 920 mV was obtained with a peak power density of 15 mW cm−2 and a short-circuit current density of 65 mA cm−2 at an operating temperature of 80°C, although cyclohexane was not stored, but was flowed continuously in the fuel electrode.8 However, the rechargeability of this type of RFC remains strongly dependent on the kinetics for benzene reduction. A much higher charge voltage than the theoretical value is required for the regeneration of cyclohexene; therefore, a large quantity of hydrogen remains unreacted. Accordingly, the charge/discharge cyclability for this RFC has not been reported. The crossover of benzene and cyclohexane through the electrolyte membrane is also a problem and reduces cycle life.
Quinones [benzoquinone (BQ), naphthoquinone (NQ), and anthraquinone (AQ)] are hydrogenated to the corresponding reduced quinones [hydroquinone (H2Q), naphthohydroquinone (NH2Q), and anthrahydroquinone (AH2Q)], which can also be reversibly dehydrogenated to the initial quinones.9,10 This cycling proceeds at relatively low temperatures (<100°C) and typically without a catalyst.11 Moreover, the cycle stability of the quinones is much greater than that of other organic chemical hydrides. Based on these unique redox characteristics, the quinones and their derivatives have been employed as hydrogen carriers for H2O212 and pulp production,13 and for photosynthetic oxygen reduction.14 However, few studies have focused on quinones as potential hydrogen storage materials for both RFCs and RFCBs due to their low storage capacities: 1.8 wt% for BQ, 1.2 wt% for NQ, and 0.9 wt% for AQ (Table I). However, the theoretical electrical capacities of these quinones are in the range of 257 to 495 mAh g−1, which are comparable to or greater than those of present secondary batteries.15
Table I. Hydrogen and energy capacities of quinones.
| Quinone | Hydrogen Capacity / wt% | Electrical Capacity / mAh g-1 |
|---|---|---|
| Benzoquinone | 1.8 | 495 |
| (C6H4O2) | ||
| Naphthoquinone | 1.2 | 338 |
| (C10H6O2) | ||
| Anthraquinone | 0.9 | 257 |
| (C14H8O2) |
This study investigates the charge-discharge performance of an RFCB and its cyclability using AQ as a hydrogen carrier in the temperature range from room temperature to 75°C. AQ possessed the highest melting point (286°C) and the lowest solubility in acidic solution of the pure quinones, and therefore, no possibility of crossover through the electrolyte membrane. These characteristics also imply that the use of an electrocatalyst would be ineffective for the AQ/AH2Q redox reaction because of the very small contact interface between the solid-state AQ or AH2Q and a catalyst. Therefore, the fuel electrode used in this study comprised only AQ and carbon, which enables not only a reduction in the amount of Pt used, but also suppression of the deep oxidation of AH2Q.
Experimental
Materials
The proton conductor used was Sn0.95Al0.05P2O7 because this material possesses a proton conductivity of ca. 0.05 S cm−1 in the temperature range from room temperature to 100°C, as reviewed elsewhere.16–18 Sn0.95Al0.05P2O7 powder was synthesized according to a previously reported procedure.19,20 Polytetrafluoroethylene (PTFE) powder (0.04 g) was added to 1.00 g of Sn0.95Al0.05P2O7 powder, kneaded using a mortar and pestle, and then cold-rolled to a thickness of 250 μm using a laboratory rolling mill.
The AQ/C fuel electrode was prepared as follows. 0.067 g of AQ (Aldrich) was dissolved in 30 mL of benzene at 70°C, followed by the addition of 0.133 g of carbon powder (Kansai Coke and Chemicals). The suspension was stirred until the benzene was completely evaporated. After drying at 120°C for 2 h, the solid product was dispersed with 0.5 g of 105% H3PO4 ionomer (Aldrich) using a mixer (Thinky AR-100) for 15 min. The obtained slurry was deposited on the surface of a carbon fiber paper (Toray TGP-H-090). The AQ loading was adjusted according to the electrode thickness; a maximum AQ loading of 3.68 mg was obtained at an electrode thickness of 0.4 mm. Two different air electrodes were examined: a commercially available Pt/C (40 wt% Pt, ElectroChem) and a physical mixture of 50 wt% RuO2 (Aldrich) and carbon. After the addition of a small amount of 105% H3PO4 ionomer, the electrode slurries were coated on carbon fiber paper in a similar manner to that for the AQ/C electrode.
Characterization
Transmission electron microscopy (TEM) and energy dispersive X-ray (EDX) images were recorded using a JEOL JEM2100HK instrument at an accelerating voltage of 200 kV with a beam current of 92 μA. X-ray diffraction (XRD) patterns were obtained using a Rigaku Miniflex II diffractometer operated at 45 kV and 20 mA with Cu Kα radiation (λ = 1.5432 Å). Nitrogen adsorption-desorption isotherms were measured using a Nihon Bell Belsorp-28SA gas analyzer after samples were degassed at 200°C. The micro- and mesopore volume distributions were determined using the standard micropore method (MP) and the Barrett-Joyner-Halenda (BJH) method, respectively. Brunauer-Emmett-Teller (BET) specific surface areas were calculated from adsorption data in the relative pressure range of 0.03 to 0.23. The CO2 concentration in the outlet gas from the electrode was analyzed using online gas chromatography (GC; Varian CP-2002).
Electrochemical measurements
Cyclic voltammograms (CV) for the fuel electrode were obtained using a Hokuto Denko HZ-5000 galvanostat/potentiostat in three-electrode mode, where the fuel electrode, an Ag/AgCl reference electrode, and a Pt counter electrode were set in a 0.5 M H2SO4 solution. Charge-discharge measurements were performed between room temperature and 75°C as follows. An electrolyte membrane (13 mm diameter) was sandwiched between the fuel and air electrodes (0.5 cm2). The fuel electrode was attached to a stainless steel current collector and then sealed using thermal- and chemical-resistant PTFE tape (Nitto Denko). The air electrode was supplied with atmospheric air at a relative humidity of ca. 50% and a flow rate of 30 mL min−1. The applied potential range between the two electrodes was 0–1.0 V, which was galvanostatically controlled using a Solartron SI 1260 impedance analyzer and Solartron 1287 electrochemical interface. The polarization resistance of each electrode was analyzed by measuring the impedance spectrum of a symmetrical cell consisting of AQ/C|Sn0.95Al0.05P2O7-PTFE|AQ/C, Pt/C|Sn0.95Al0.05P2O7-PTFE|Pt/C, or RuO2/C|Sn0.95Al0.05P2O7-PTFE|RuO2/C. The frequency range for the measurements was 0.1–106 Hz, and the AC amplitude was 10 mV.
Results and Discussion
Characterization of AQ/C
The distribution state of AQ on the carbon surface is an important contributing factor for acceleration of the AQ/AH2Q redox reaction. The AQ particle size in the fuel electrode was analyzed and compared with that of a physical mixture of AQ and carbon with the same AQ content (33 wt%) as that of the fuel electrode [Figs. 1a and 1b]. While ca. 2 μm AQ particles were in contact with some carbon particles in the physical mixture, only aggregates of carbon-like particles was observed in the fuel electrode sample. The AQ particles were almost invisible, even in TEM images of the fuel electrode sample obtained at higher magnification (data not shown). The crystallinity of the two samples was investigated by XRD analysis. Figure 1c shows that the diffraction peak intensities of AQ in the fuel electrode sample were considerably lower than those of the physical mixture, which indicates that the AQ in the fuel electrode sample had a less crystalline structure or a nanocrystalline structure, in contrast to the AQ structure in the physical mixture. The porosity of the two samples was characterized using N2 adsorption-desorption isotherm measurements. Both samples produced type I isotherms, which is characteristic of mainly microporous materials.21 However, Fig. 1d shows a large difference in the pore size distribution between the two samples. The micropore volume calculated by the MP method was 0.73 cm3 g−1 for the fuel electrode sample, but 1.07 cm3 g−1 for the physical mixture. In addition, the mesopore volume calculated using the BJH method was 0.45 cm3 g−1 for the fuel electrode, but 0.58 cm3 g−1 for the physical mixture. The BET specific surface areas were 1451 m2 g−1 for the fuel electrode sample and 1731 m2 g−1 for the physical mixture. Based on these results, it is likely that AQ molecules were deposited on the surface of micro- and mesopores in the carbon support of the fuel electrode.

Figure 1. Characterization of AQ/C fuel electrode materials. TEM images of (a) carbon-supported AQ (AQ/C) and (b) carbon-mixed AQ (AQ + C). (c) XRD patterns of AQ/C and AQ + C. (d) Pore size distributions of AQ/C and AQ + C. The AQ content in the AQ/C and AQ + C samples was 33 wt%.
Charge and discharge characteristics at room temperature
AQ/C|Sn0.95Al0.05P2O7-PTFE|Pt/C
The voltage window of RFCB operation was determined first from CV measurements. Figure 2a shows CVs collected at a scan rate of 50 mV s−1 for the carbon-supported AQ (AQ/C) electrode and a carbon electrode without AQ. The carbon electrode exhibited pure capacitive behavior in the absence of AQ, as evident from the rectangular shape of the CV curve. In contrast, a large redox couple at E1/2 = −0.14 V (vs. Ag/AgCl) was observed in the presence of AQ, where both the peak intensity and potential remained almost unchanged after 100 scans. This E1/2 value is sensitive to the pH of the electrolyte solution used because AQ is in equilibrium with various intermediates (radical anions, dianions, and anions) or fully reduced AH2Q, depending on the proton and AQ concentrations.22 At low pH (such as those of H2SO4 solutions), AQ coexists with AH2Q according to the following two-electron and two-proton reaction:
![Equation ([1])](https://content.cld.iop.org/journals/1945-7111/162/4/F410/revision1/jes_162_4_F410eqn1.jpg)
where the oxidation reaction of water molecules and the reduction reaction of oxygen molecules are speculated to occur as the corresponding counter reactions at the Pt electrode. Reaction 1 generates an E1/2 value of ca. −0.18 V (vs. Ag/AgCl) at pH = 0,22 which is comparable to the value observed in this study. This suggests that AQ is directly converted to AH2Q without the use of hydrogen as a reductant, which is supported by the E1/2 value, which was more positive than the potential for hydrogen reduction (−0.2 V or more negative), as shown in Fig. 2a. Thus, a charge voltage of 1.0 V was confirmed to be sufficiently large to charge AQ to AH2Q.
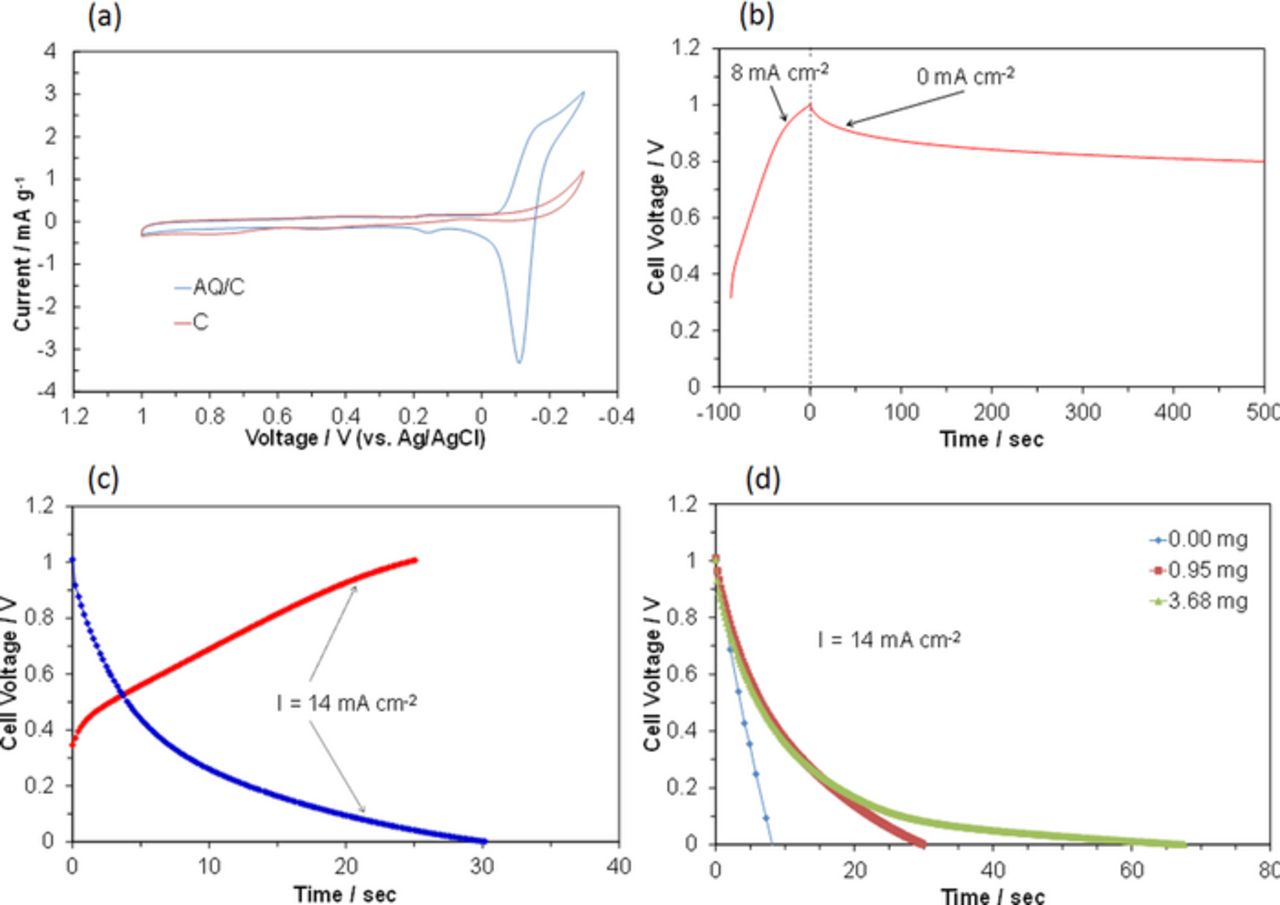
Figure 2. Electrochemical performance of batteries at room temperature: AQ/C|Sn0.95Al0.05P2O7-PTFE|Pt/C. (a) CVs for AC/C and C electrodes at a scan rate of 50 mV s−1 and a scan number of 5 cycles. (b) Voltage change of battery charged to 1.0 V at a current density of 8 mA cm−2, followed by circuit opening. (c) Galvanostatic charge-discharge curves for the battery at a current density of 14 mA cm−2. (d) Galvanostatic discharge curves for batteries with different AQ quantities in the fuel electrode at a current density of 14 mA cm−2.
To determine whether the expected charge reaction occurs in the battery with the Sn0.95Al0.05P2O7-PTFE electrolyte, the cell was charged to 1.0 V and the circuit was then opened at room temperature. Transient changes in the cell voltage are presented in Fig. 2b. The open-circuit voltage (OCV) of the cell before charge was ca. 0.3 V; however, this value was not reproducible. (Most OCVs were between 0.2 and 0.4 V.) As a result of the charge, a plateau appeared at ca. 0.8 V, which is near the OCV value expected from the E1/2 value shown in Fig. 2a. The OCV obtained may be attributable to the potential difference between the anodic (AH2Q oxidation) and cathodic (O2 reduction) reactions. On the other hand, preliminary experiments with the battery charged to 1.5 V showed a rapid decrease of the voltage from 1.5 V to an OCV of ca. 0.9 V, which is comparable to the OCV when charged to 1.0 V. This rapid decrease indicates that the hydrogen production reaction proceeds during charge at over 1.0 V; the produced hydrogen escapes from the fuel electrode through an aperture of the sealing tape.
The reversibility of the AQ/C fuel electrode was evaluated in the battery at room temperature. Constant current charge-discharge curves for the cell are presented in Fig. 2c. A charge-discharge cycle with a coulombic efficiency of 100%, within experimental error, was established, which indicates no loss of the electrical charge stored in the fuel electrode. The Pt/C air electrode can also reversibly oxidize water vapor and reduce oxygen:
![Equation ([2])](https://content.cld.iop.org/journals/1945-7111/162/4/F410/revision1/jes_162_4_F410eqn2.jpg)
However, no voltage plateau was observed in Fig. 2c during charge and discharge, which is related to both the low storage capacity of the AQ used and the large internal resistance of the cell. The resulting power density of the cell decreased with time: 16.8, 9.9, 6.2, and 2.9 mW cm−2 at 1, 5, 10, and 20 s, respectively.
Figure 2d presents the influence of the amount of AQ in the fuel electrode on the discharge process of the battery at room temperature. A current density of 14 mA cm−2 could be drawn from the cell, even when no AQ was present in the fuel electrode. This is not surprising, because an electrical double layer (EDL) is formed by charging the carbon, which yields an electrical capacity.23 The discharge time of the cell was extended by the presence of AQ in the fuel electrode; this effect was increased with the amount of AQ, although it was observed only at low cell voltages. The effect was attributed to the hydrogen storage capacity based on the AQ/AH2Q redox reaction. However, the electrical capacity estimated from the discharge curve was 35 mAh g−1, which is only 13% of the theoretical value. Therefore, the performance of this cell could not be significantly improved merely by increasing the amount of AQ in the fuel electrode.
Characterization of RuO2/C
Not only the fuel electrode, but also the air electrode, influences the performance of the RFCB because the poor acid-resistant properties of Pt are important in PEM fuel cells.24 It should be noted that both the Sn0.95Al0.05P2O7-PTFE electrolyte and the H3PO4 ionomer show high acidity. Figure 3a shows that the diffraction peak intensities of Pt were considerably decreased by acid treatment of the Pt/C electrode sample at 75°C for 3 h. TEM observation showed that agglomeration of Pt particles was more significant after the acid treatment than before (Supplementary Information, Fig. S1). Dissolution and re-deposition of Pt particles can easily occur by respective charging and discharging of the cell; therefore, the air electrode may already be degraded during the 1st cycle, which would reduce the apparent capacity of the battery. Transition metal oxides such as RuO2,25 Mn2O3,26 and IrO227 are promising catalysts for the air electrode. In particular, the good acid-resistant properties of RuO2 shown in Fig. 3b make this catalyst compatible with the Sn0.95Al0.05P2O7-PTFE electrolyte. Figure 3c shows a TEM micrograph and EDX elemental maps for the RuO2/C electrode sample. The RuO2 particles have an almost spherical to hexagonal geometry with diameters of ca. 100 nm. These particles appear to be mixed with the carbon particles in the submicron range. (Note that the EDX element map for C also shows the signal from the carbon microgrid.) For comparison, TEM and EDX results for the Pt/C electrode are given in Fig. S2 (Supplementary Information).
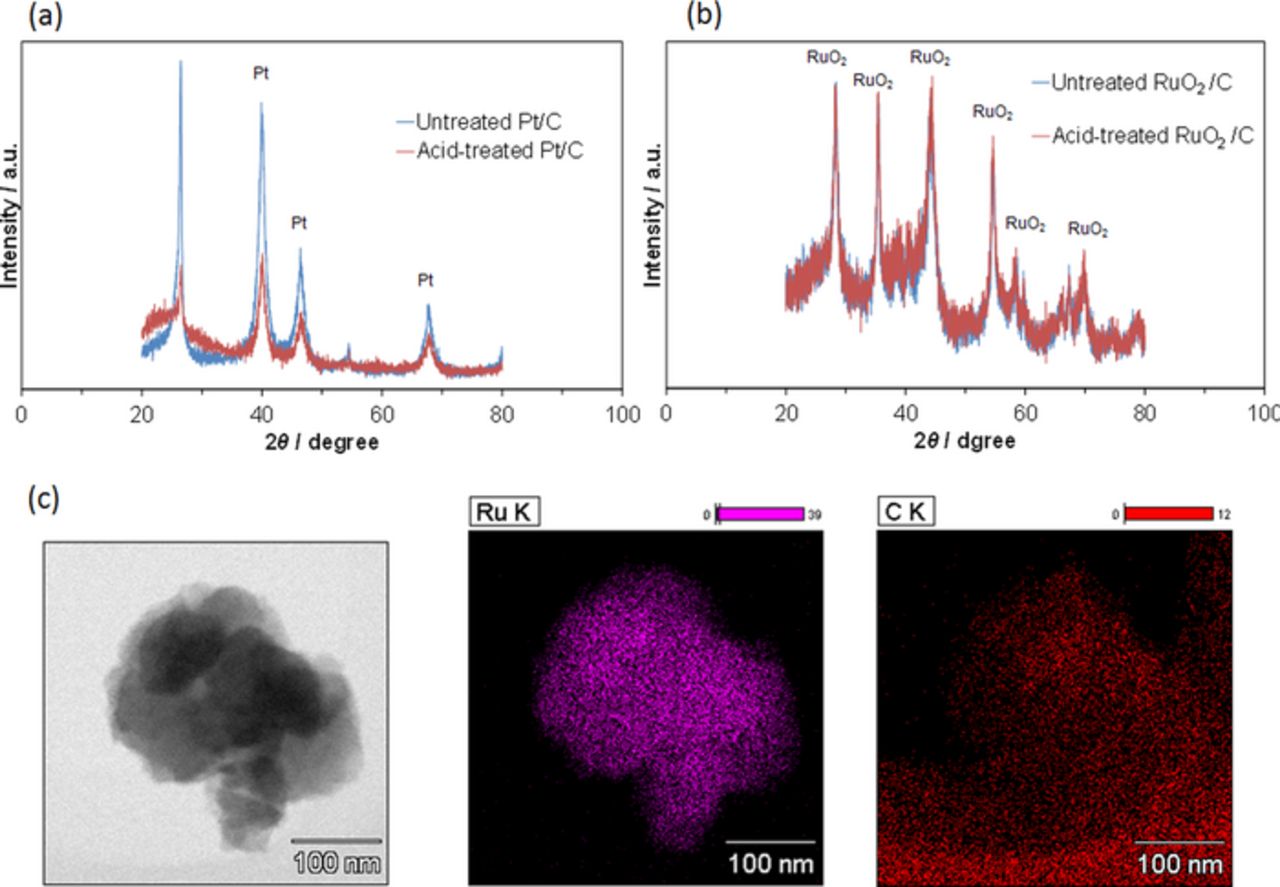
Figure 3. Characterization of RuO2/C air electrode materials. XRD patterns of (a) Pt/C and (b) RuO2/C before and after H3PO4 treatment at 75°C for 3 h. (c) TEM image and EDX elemental maps of RuO2/C.
Charge and discharge characteristics at room temperature
AQ/C|Sn0.95Al0.05P2O7-PTFE|RuO2/C
The reaction kinetics of the Pt/C and RuO2/C electrodes were compared using room temperature impedance measurements and the results are presented in Fig. 4a. The intercept of the impedance line and the real axis, which corresponds to the ohmic resistance, was somewhat lower for Pt/C than for RuO2/C, which reflects their structural or morphological differences; Pt/C is a cluster of Pt-loaded carbon particles and RuO2/C is a physical mixture of RuO2 and carbon particles. The depressed arcs for both electrode samples in the middle frequency range (20 Hz–16 kHz), which are associated with the charge-transfer resistance, were almost comparable. More importantly, the impedance curves were skewed in the low frequency range (0.1–20 Hz), which is due to the slow diffusion or adsorption of oxygen and/or water vapor.28 Both the skew angle and degree for RuO2/C were much smaller than those for Pt/C. It is reasonable to consider that this difference could be attributed to their stability in the acid medium [Figs. 3a and 3b]. Thus, the adsorption site density of the Pt particles is most likely severely decreased by corrosion in the acid medium.
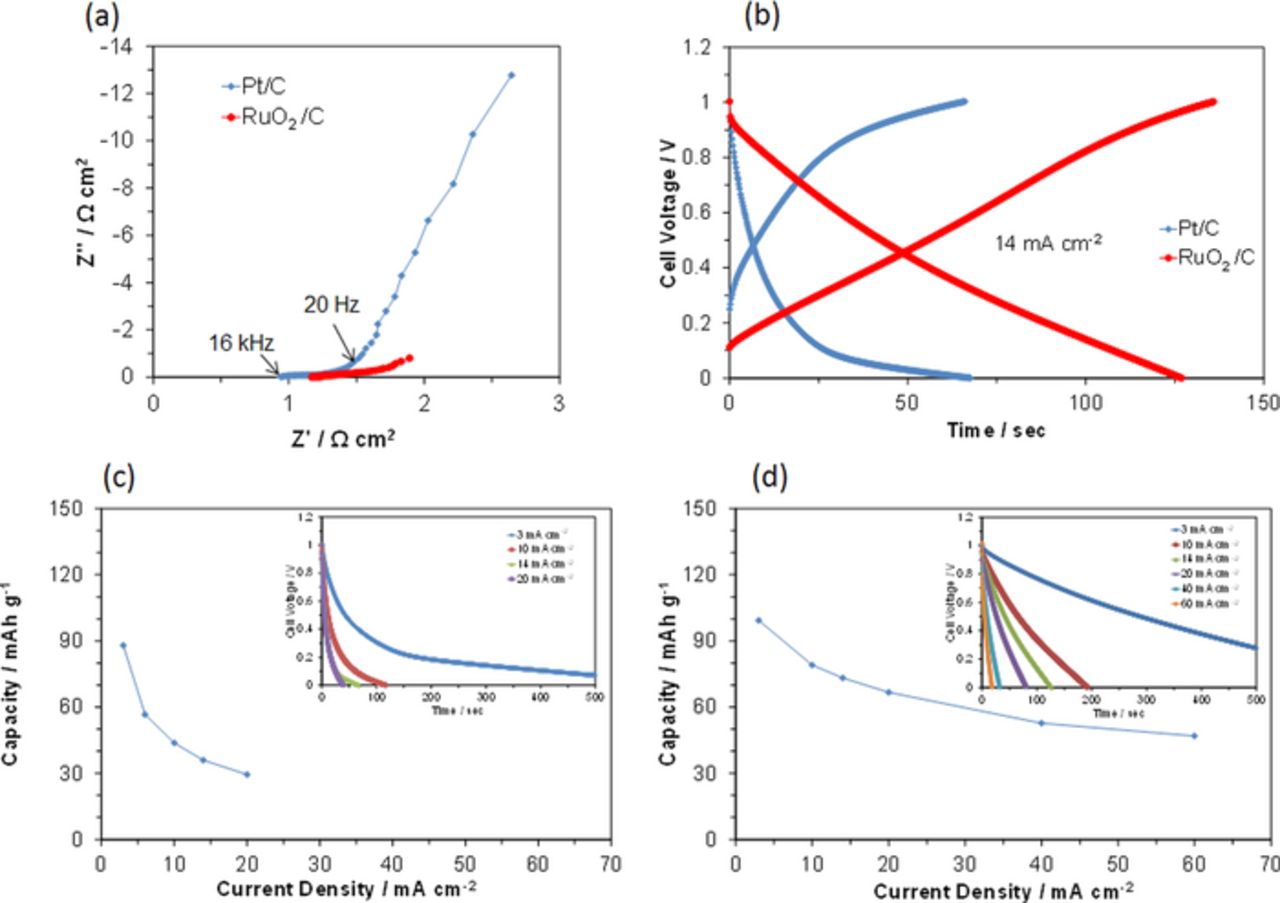
Figure 4. Electrochemical performance of the AQ/C|Sn0.95Al0.05P2O7-PTFE|RuO2/C and AQ/C|Sn0.95Al0.05P2O7-PTFE|Pt/C batteries at room temperature. (a) Impedance spectra for the Pt/C and RuO2/C air electrodes under OCV conditions. (b) Galvanostatic charge-discharge curves for the batteries at a current density of 14 mA cm−2. Capacity as a function of current density for batteries with the (c) Pt/C and (d) RuO2/C air electrodes. The inset shows the discharge curves at various current densities.
To evaluate the electrochemical properties of the RuO2/C air electrode for the RFCB, a galvanostatic charge-discharge profile was measured with a current density of 14 mA cm−2 at room temperature. Figure 4b shows that the charge voltage was much smaller with RuO2/C than with Pt/C at each time, and vice versa for the discharge voltage, which enhanced the electrical capacity of the cell to 67 mAh g−1 with the RuO2/C electrode. However, this result does not mean an increase in the inherent capacity of the cell using the RuO2/C electrode, but results from a lesser dependence of the current density on the capacity compared to that with the Pt/C electrode. This point will be discussed in the next paragraph.
The difference in the performance of the two air electrodes is further emphasized by the galvanostatic charge-discharge profiles measured at different current densities. The cell voltage with the Pt/C electrode quickly dropped to ca. 0.2 V and then slowly decreased with time, especially at low current densities [inset of Fig. 4c]. In contrast, the cell voltage with the RuO2/C electrode decreased almost linearly with time at all the tested current densities [inset of Fig. 4d]. As a result, the electrical capacity of the cell with the RuO2/C electrode was higher than that of the cell with the Pt/C electrode [Figs. 4c and 4d]. It should also be noted that this difference becomes larger as the current density increases. Therefore, the difference in capacity between the two cells is very small at a low current density of 3 mA cm−2, where there is no significant current density dependence. This result can be explained by assuming that the inherent capacity of the two cells is determined by the hydrogen storage capacity of the AQ/C fuel electrode and that the current density dependence of the capacity is strongly influenced by the type of air electrode used. Subsequent experiments were conducted using the RuO2/C air electrode.
Charge and discharge characteristics at elevated temperatures
AQ/C|Sn0.95Al0.05P2O7-PTFE|RuO2/C
AQ was identified as close to the carbon surface in the fuel electrode; therefore, the storage capacity could be further enhanced by an increase in AQ utilization, i.e., the kinetics for the AQ/AH2Q redox reaction. Operation of the RFCB at elevated temperatures increases the reactivity of AQ and AH2Q molecules and promotes redox reactions. This also allows for low internal resistance of the fuel electrode and/or the air electrode, which improves cell performance. The battery was charged and then discharged at various temperatures. Figure 5a shows that the cell voltage increased gradually with the operating temperature at each time. However, the voltage drop within 10 s from the start of discharge was the most significant at 75°C, most likely due to a decrease in adhesion of the sealing tape at this temperature, which introduced a small quantity of air into the fuel electrode. Figure 5b shows that the electrical capacity also increased significantly with the operating temperature. A high capacity of 143 mAh g−1, which corresponds to 56% of the theoretical value, was achieved at 75°C. The capacity then reached 224 mAh g−1 at 100°C (data not shown); however, this should be noted as only additional information, because such a high temperature is not suited for RFCB applications.
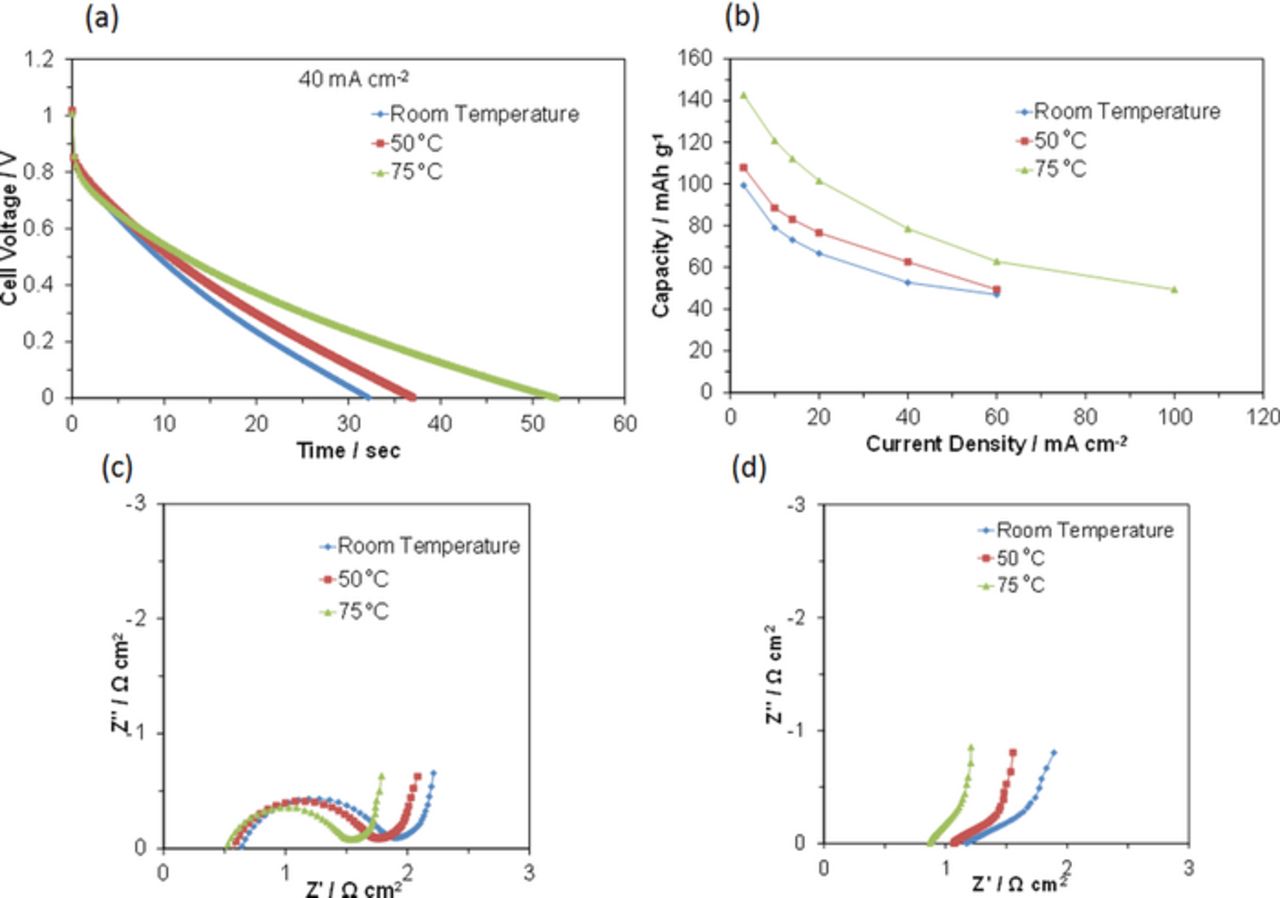
Figure 5. Electrochemical performance of the AQ/C|Sn0.95Al0.05P2O7-PTFE|RuO2/C battery at various temperatures. (a) Galvanostatic discharge curves for the battery between room temperature and 75°C at a current density of 40 mA cm−2. (b) Capacity as a function of current density at various temperatures. Impedance spectra for the (c) fuel electrode and (d) air electrode between room temperature and 75°C under OCV conditions.
To elucidate the details of this process, AC impedance spectra were measured independently for the fuel and air electrodes between room temperature and 75°C, as shown in Figs. 5c and 5d, respectively. The results reveal three important features. First, the ohmic resistance is not largely dependent on the operating temperature, which reflects the small temperature dependence of proton conductivity for the Sn0.95Al0.05P2O7-PTFE electrolyte.29 Second, the charge-transfer resistance was reduced by an increase in temperature, and was more pronounced for the fuel electrode than for the air electrode, which indicates that the improvement of cell performance shown in Figs. 5a and 5b was due mainly to the enhanced rate of the AQ/AH2Q redox reaction. Third, the sharp rise in the low frequency range was not parallel to the imaginary axis, which indicates that these electrodes do not function as simple EDL electrodes.30 More importantly, the skew degree was not significantly influenced by an increase of temperature, especially for AQ/C, which means that mass transport in the micropores of the carbon is sufficiently fast over the range of temperature tested. This can be explained by the unrestrictive diffusion of ionomer ions in the narrow micropores of the carbon; all of the micropore surfaces in this sample were wetted by the ionomer.
Performance evaluation as an energy device
The present RFCB is a type of secondary battery. The energy density was thus estimated by integrating the area under the voltage-time curve during discharge, multiplying by the current, and then dividing by the masses of the AQ, AQ/C, and entire cell. The power density was obtained by dividing the energy density by the discharge time. Based on these data, a Ragone plot31 for the cell is presented in Fig. 6a. The energy densities (0.8–3.4 Wh kg−1), which were normalized by the total cell weight, are lower than those for other batteries, although the corresponding power densities (9.5–258.9 W kg−1) are comparable with those for lead-acid batteries, but lower than those for nickel-metal hydride batteries. The electrolyte occupies approximately 70–80% of the total cell weight; therefore, the synthesis of a more lightweight electrolyte membrane is a necessary requirement for practical applications. One promising approach to meet this requirement is to form a hybrid of Sn0.95Al0.05P2O7 and sulfonated polystyrene-b-poly(ethylene/butylene)-b-polystyrene (sSEBS) materials, the thickness of which could be controlled from 25 to 80 μm to provide a proton conductivity of approximately 0.01 S cm−1 without humidification.32
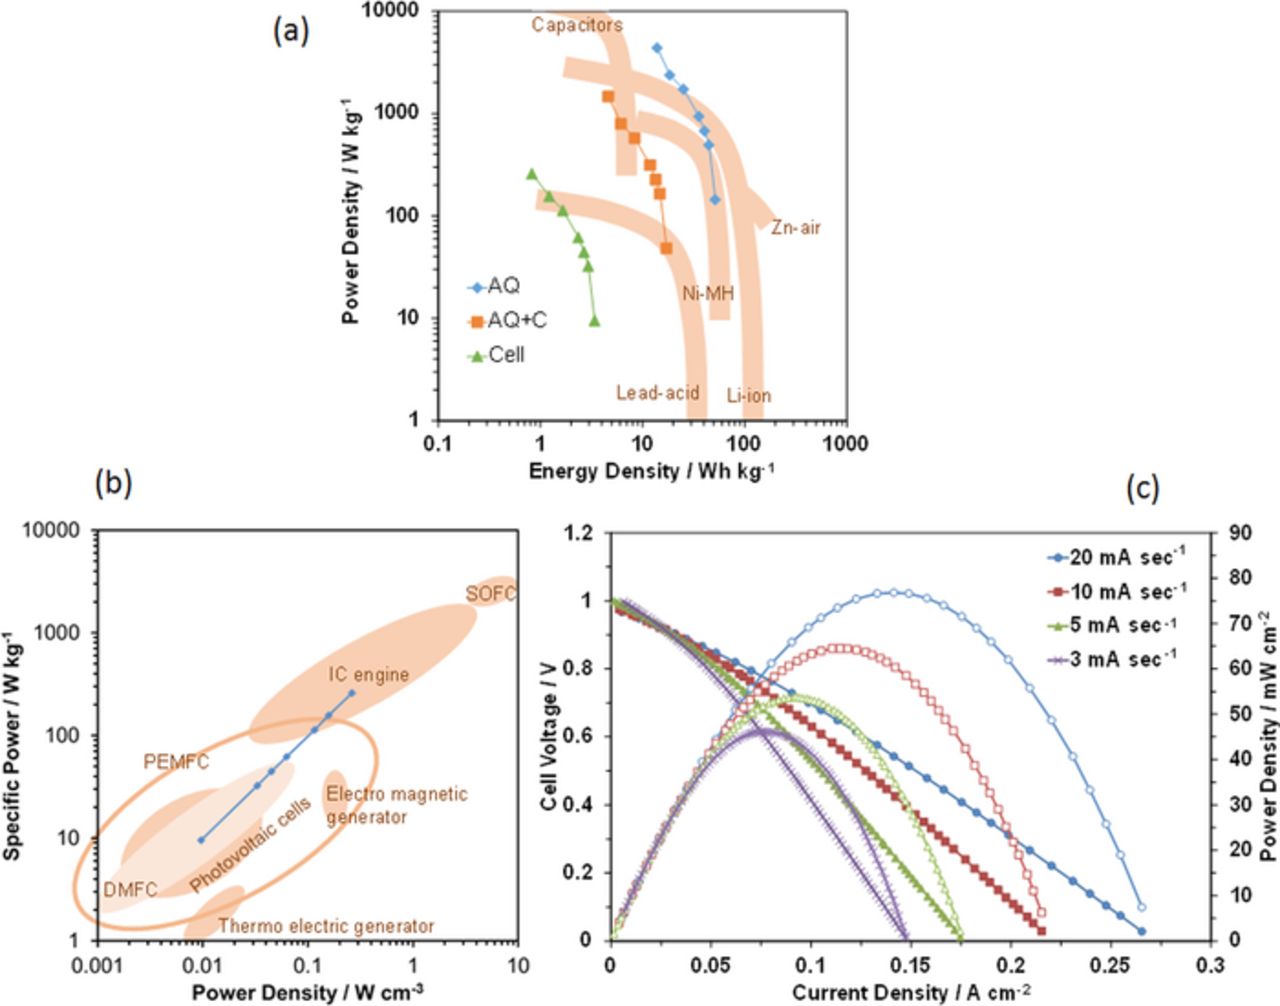
Figure 6. Battery and fuel-cell characteristics. (a) Ragone plot (power density versus energy density) for the present RFCB compared with the other secondary batteries.31 (b) Specific power of the present RFCB compared with the other energy conversion devices.31 (c) Current-voltage and -power density curves of the present RFCB.
The present RFCB is also regarded as a type of PEM fuel cell, although it does not require any fuel supply. For fuel cell applications, the specific power (W kg−1) and power density (W cm−3) are important performance factors. Figure 6b shows the specific power of the cell as a function of power density, where the powers estimated above are normalized according to the total cell weight and volume. Both the specific power (9.5–258.9 W kg−1) and power density (0.001–0.26 W cm−3) are within the wide range of PEM fuel cells and higher than those for direct methanol fuel cells. However, it should be noted that the slope of the current-voltage curves was strongly dependent on the current-sweep rate, as shown in Fig. 6c, due to the limited hydrogen storage capacity of the fuel electrode.
Cyclic charge-discharge characteristics
The cyclability of the battery between room temperature and 75°C was evaluated using galvanostatic charge-discharge measurements. In all tests, no significant overshoots beyond 1.0 V upon charge at 40 mA cm−2 or under 0 V upon discharge at 40 mA cm−2 were observed. Plots of electrical capacity retention and coulombic efficiency against cycle number are presented in Figs. 7a and 7b, respectively. Although coulombic efficiencies greater than 90% were obtained for the charge-discharge cycles at all the tested temperatures, the cyclability was sensitive to the operation temperature. At room temperature, the capacity was either unchanged or very slightly increased with cycle number. At 50°C, the capacity remained at 91% of the initial value after 300 cycles. In contrast, at 75°C, the capacity continuously decreased as the cycle number increased. Nevertheless, ca. 63% of the initial performance was retained after 300 cycles, which has not been achieved using other organic chemical hydrides as hydrogen storage media.
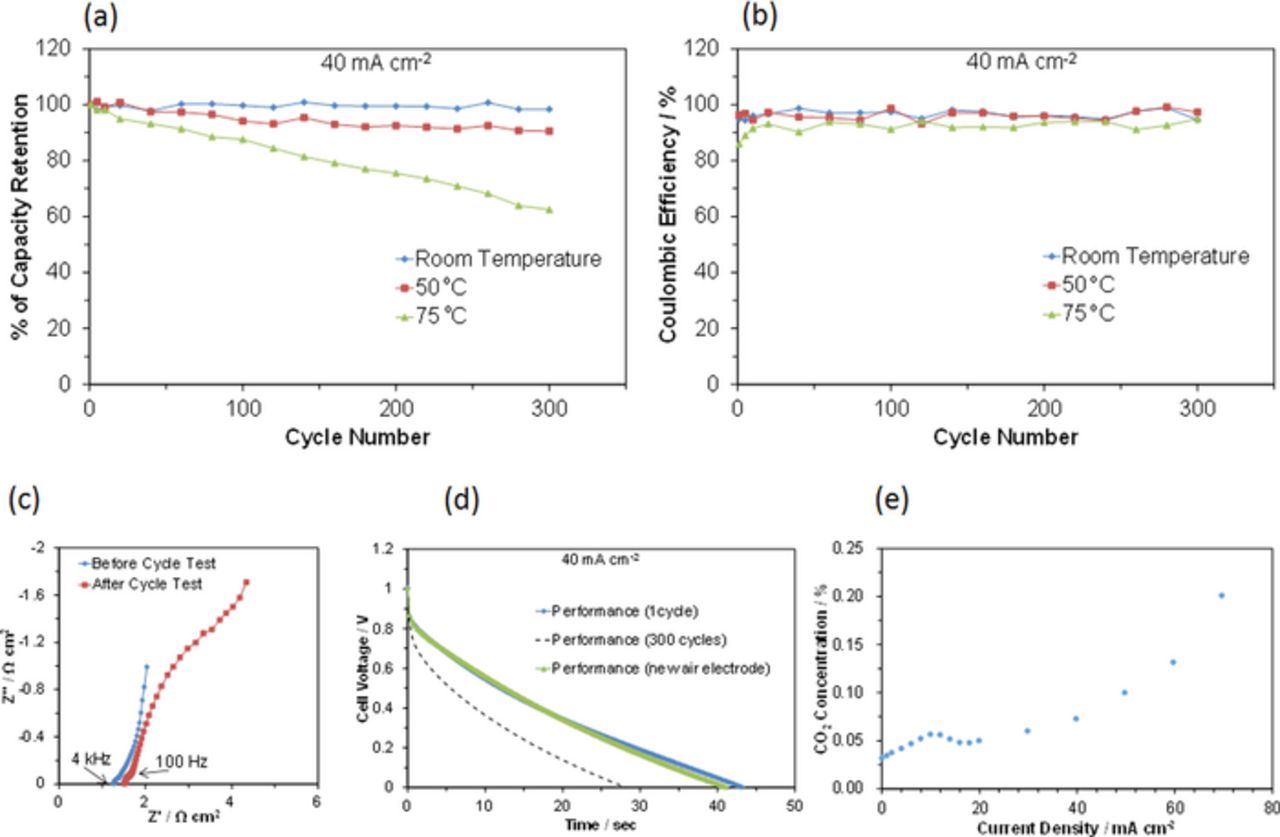
Figure 7. Cyclability of the battery between room temperature and 75°C. (a) Capacity retention and (b) coulombic efficiency as a function of cycle number. The cell voltage and current density were 0 to 1.0 V and 40 mA cm−2, respectively. (c) Impedance spectra for the battery before and after 300 cycles at 75°C. (d) Discharge curves for the battery at the 1st and 300th cycles, and when replaced with a new air electrode. (e) CO2 concentration as a function of current density at 75°C.
Figure 7c shows that the electrochemical reaction region (100 Hz–4.0 kHz) and the diffusion region (0.1–100 Hz) were enlarged compared to the ohmic region (4.0 kHz–103 kHz) after 300 cycles at 75°C. This was due to degradation of the air electrode rather than the fuel electrode, because the discharge time recovered to approximately 100% of the initial value by replacing the air electrode with a new one in the test cell, as shown in Fig. 7d. Electrode degradation could be attributed to corrosion of the catalytically active nanoparticles or corrosion of the support. However, the agglomeration of RuO2 particles was not observed at 75°C [Fig. 3b]; therefore, this effect may be excluded in the present case. In contrast, carbon corrosion is a known phenomenon in PEM fuel cells and electrolyzer cells, caused by the oxidation of carbon to CO2 by water vapor:33,34
![Equation ([3])](https://content.cld.iop.org/journals/1945-7111/162/4/F410/revision1/jes_162_4_F410eqn3.jpg)
This was confirmed by analysis of the outlet gas from the anodically polarized air electrode. The CO2 concentration increased with the anodic current density at 75°C [Fig. 7e], although the linearity is poor, most likely due to the adsorption of CO2 on the carbon surface. Semiconductive metal oxides, such as SnO235 and TiO2,36 have been investigated as alternative non-carbon supports for PEM fuel cells. In addition, mesoporous SnO237,38 and TiO239 support materials with high specific surface areas have been successfully synthesized. However, further research is required to evaluate the effectiveness of such alternative support materials.
Conclusions
In conclusion, a RFCB has been developed using AQ for hydrogen insertion/extraction reactions. Nanostructural AQ was synthesized in the micro- and mesopores of a carbon support. A pair of redox peaks were observed in the CV for AQ at a more positive potential than that for hydrogen reduction. An OCV of ca. 0.8 V was generated by charging the cell to 1.0 V, and the charge-discharge processes occurred with a coulombic efficiency of 100%. The use of an acid-resistant RuO2/C air electrode enhanced the kinetics of both the oxygen reduction and oxygen evolution reactions, so that the electrical capacity was significantly increased compared to that for the cell with a Pt/C air electrode, especially at high current densities. The discharge voltage became more plateau-like with an increase in the operating temperature, and the electrical capacity reached 143 mAh g−1 at 75°C, which corresponds to 56% of the theoretical value. This effect was attributed mainly to acceleration of the AQ/AH2O redox reaction at elevated temperatures. The RFCB with optimized electrodes exhibited the following device performance: 0.8–3.4 Wh kg−1, 9.5–258.9 W kg−1, and 0.001–0.26 W cm−3. The capacity remained at 100% at room temperature, 91% at 50°C, and 63% at 75°C of the respective initial values after 300 cycles at 40 mA cm−2. Degradation during the cycling test was attributed to corrosion of the carbon air electrode caused by cell charging.