Abstract
In this work, the corrosion behavior of tempered AISI 420 martensitic stainless steel (MSS) was studied by in-situ atomic force microscopy (AFM) in 0.1 M NaCl and correlated with the microstructure. Thermocalc simulation, dilatometry, and X-ray diffraction (XRD) were performed to investigate phase transformation which showed the formation of M3C, M7C3, and M23C6 type of carbides and also retained austenite. Optical microscopy, scanning electron microscopy (SEM), and AFM characterization revealed undissolved carbides and tempering carbides in the martensitic matrix. Volta potential mapping measured by scanning Kelvin probe force microscopy (SKPFM) indicated higher electrochemical (practical) nobility of the carbides with respect to the martensitic matrix whereas regions adjacent to carbides showed lower nobilities due to chromium depletion. Open circuit potential and cyclic potentiodynamic polarization measurements showed metastable corrosion activities associated with a weak passive behavior and a risk for localized corrosion along certain carbide boundaries. In-situ AFM measurements revealed selective dissolution of certain carbide interphases and martensitic inter-lath regions indicating higher propensity to localized corrosion.
Export citation and abstract BibTeX RIS

This is an open access article distributed under the terms of the Creative Commons Attribution Non-Commercial No Derivatives 4.0 License (CC BY-NC-ND, http://creativecommons.org/licenses/by-nc-nd/4.0/), which permits non-commercial reuse, distribution, and reproduction in any medium, provided the original work is not changed in any way and is properly cited. For permission for commercial reuse, please email: oa@electrochem.org.
The material used for plastic molding needs sufficient corrosion resistance, wear resistance, and high hardness.1 Plastic molding materials are often made of MSS's due to their relatively good corrosion and wear resistance.2 MSS's are typically available in soft-annealed, hardened, and tempered conditions. In the soft-annealed condition, islands of spherical carbides exist in a ferritic matrix resulting in a soft material which allows easy fabrication of molds.3 The hardened and tempered condition, in contrast, leads to a microstructure containing undissolved carbides with newly-precipitated carbides in the martensitic matrix resulting in higher hardness and strengths, which is needed for distortion-free fabrication of complex geometries.
In the hardening process, the steel is heated to an austenitizing temperature and held until the matrix is completely transformed to austenite, followed by a rapid cooling (quenching) to convert the matrix into a martensitic microstructure.4 However, carbides typically co-exist with martensite due their incomplete dissolution, or may have formed during quenching.
Martensitic transformation is often accompanied by unwanted retained austenite3,5,6 and also sometimes by δ-ferrite,3,6,7 both affecting mechanical and corrosion properties.5 Increasing the austenitization temperature typically enhances carbide dissolution and increases the solubility of alloying elements in the austenite but also leads to grain coarsening and reduces martensite transformation, thereby increasing the volume fraction of retained austenite.3 Hence, austenitization temperature and dwelling time are key factors since the quenched microstructure is the precursor to the tempered microstructure. Tempering is needed to improve the ductility and toughness and to relieve residual stresses, which can affect both corrosion and mechanical properties.3,4
Mechanical properties of MSS's have been extensively studied, however, little work has been done to correlate microstructure with corrosion behavior to better understand local electrochemical phenomena related to microstructure constituents. Lu et al. studied the effect of tempering temperature on microstructure and corrosion behavior of a MSS containing 13 wt% Cr and concluded that tempering at 300°C showed better corrosion resistance than tempering at 500°C for which sensitization caused by precipitation of M23C6 type of carbides have been made responsible.8 Lerchbacher et al. studied the corrosion behavior of X38CrMo16 MSS and showed that the chromium content within the precipitate was not the only deciding factor for creating depletion zones around carbide/matrix interphases, as typically believed among the corrosion community.9
Electrochemical techniques, such as potentio-dynamic polarization, are commonly used to investigate the overall corrosion behavior in aqueous environments. Electrochemical information in local scale is typically not possible, and to correlate microstructure constituents with corrosion properties, complementary techniques are needed. Characterization and examination of the microstructure before and after polarization using microscopy techniques is generally performed to evaluate localized corrosion susceptibilities.10 Recently, AFM-based techniques, such as SKPFM and in-situ electrochemical AFM, have been used to provide additional information about the surface microstructure and corresponding corrosion behavior at high lateral resolution down to submicron scale.11,12
The tendency to electrochemical attack of phases or precipitates can be qualitatively assessed by measuring the local Volta potential difference against a stable reference (often Pt).13–16 The Volta potential is a material intrinsic property and is involved in any chemical or electrochemical reaction and reflects the electrochemical nobility of microstructure constituents, with higher potentials often indicating higher nobilities.13–15,17–23 However, SKPFM measured Volta potentials cannot be directly used to predict localized corrosion phenomena since information about the electrochemical double layer and kinetic information about electrochemical reactions are missing. Nevertheless, the Volta potential parameter, as introduced by Frankel et al.16 and later its limitations discussed by Rohwerder et al.24 with relevance for corrosion science,25 can be useful to better understand local corrosion phenomena such as micro-galvanic coupling between microstructure constituents in micrometer scale.
In-situ AFM corrosion studies can reveal real-time information about local corrosion reactions occurring on the surface in bulk electrolytes with sub-micrometer lateral resolution, with or without applying electrochemical potentials to the material. So far, in-situ AFM corrosion studies have been performed on Al alloys,16 CoCrMo alloys,26 reinforcement steels,23 stainless steels,27,28 and also on a MSS.29 Information obtained via in-situ electrochemical AFM can be very helpful in microstructure optimization with respect to corrosion resistance.
The aim of this work was to investigate, in-situ, corrosion processes of AISI 420 martensitic stainless steel in 0.1 M NaCl using AFM and to correlate with local microstructure information and SKPFM measured local Volta potential data. The work reported in this paper is part of a research project to better understand localized corrosion and environment-assisted cracking phenomena of grade 420 martensitic stainless steel.
Experimental
Material used
AISI 420 martensitic stainless steel, provided by Uddeholms AB, Hagfors, Sweden, has been used in this study. The chemical composition in wt% is given in Table I. The material used was an excerpt from a large ingot, austenitized at 1020°C for 30 min in a vacuum furnace, and followed by rapid cooling (T800-500 = 105 s). The ingot was then twice tempered at 250°C for two hours, followed by cooling in air. Specimens with dimensions of 42 × 42 × 15 mm³ (length x width x thickness) were produced for microstructure characterization, small coupons with dimensions of 15 × 15 × 4 mm³ (length x width x thickness) were produced for Volta potential mapping, XRD, and electrochemical measurements, and coupons with dimensions 4.5 × 3 × 4 mm³ (length x width x thickness) were produced for in-situ electrochemical AFM measurements. Rod specimens with 3 mm in diameter and 10 mm in length were machined for dilatometry experiments from the same ingot prior to the heat-treatment, denoted as soft-annealed in this work.
Table I. Chemical composition (wt%) of the steel used.
| C | Si | Mn | Cr | V |
|---|---|---|---|---|
| 0.4 | 0.96 | 0.47 | 13.8 | 0.3 |
Dilatometry
Dilatometry was carried out to identify phase transformations during austenitization and quenching by measuring the volumetric changes of the sample. The measurements were done on a soft-annealed sample with a resolution (Δl/°C) of 0.05 μm/0.05°C. The sample was heated from 25°C to 1020°C at the rate of 199°C/min and held at that temperature for 30 min, followed by rapid cooling using helium gas at a cooling rate of T800-500 = 105 s. The collected data were plotted as change in length vs. temperature.
Thermocalc simulation
Thermocalc simulation was done for calculation of the phase diagram at the austenitization temperature of 1020°C to obtain equilibrium phases and their volume fractions. For this, the TCFE7 database was used.
Microstructure characterization
Microstructure characterization consisted of optical microscopy, SEM-EDX, AFM, and XRD analyses. Samples for optical, electron microscopy, were produced by grinding and polishing up to 1 μm finish using diamond suspension, ultrasonically cleaned with ethanol at room temperature, and chemically etched using Villella's reagent30 for ca. 15 seconds. The general and constitutional overview of the microstructure including the precipitates were obtained from optical and SEM analyses.
A field-emission gun SEM was used for SEM-EDX analysis to obtain morphological and chemical information about precipitates. SEM analyses were carried out in secondary electron (SE) and backscatter electron (BSE) imaging modes at accelerating voltages between 10–20 kV. EDX mapping were performed to obtain local chemical information. To observe undissolved and tempered carbides and to obtain information about size and shape in high resolution, AFM was employed to map the topography. Samples for AFM topography and XRD measurements were produced by electro-polishing on 1 μm-polished samples using Disa electrolyte (ethanol: 2800 ml, ethylene glycol: 400 ml, water: 480 ml, perchloric acid: 312 ml) for 10 seconds with an applied voltage of 35 V at ca. 2°C. Then, the samples were cleaned in pure water and dried in air. An Agilent AFM system with an SCM-PIT probe (n-doped Si with 20 nm coating of Pt/Ir) was used. Topography maps were acquired in intermittent mode with a scan speed of 0.5 line/second and a pixel resolution of 512 points/line.
XRD analyses were performed using Cr Kα radiation, operated at 40 kV and 35 mA with an aperture of 2 mm. The scan range (2θ°) was 35° to 160° with a step size of 0.01° and a scan speed of 0.13°/min. Peak positions of index data were compared with those obtained from standard powder diffraction file (PDF) cards. The volume fraction of retained austenite was calculated based on the assumption that only austenite and martensite phases were present in light of previous work.31 The volume fraction of both phases was obtained by comparing both integrated intensities of (111), (200), (220) diffracting planes of austenite and (110), (200), (220) diffracting planes of martensite according to Cullity.32 Post processing of the data was done and a pseudo Vogit fitting was used to determine the volume fraction of the retained austenite. The range of the retained austenite value was calculated with 95% confidence interval.
Corrosion studies
Corrosion studies consisted of electrochemical measurements, Volta potential mapping, and in-situ AFM measurements in a corrosive electrolyte.
Electrochemistry
Electrochemical measurements consisted of open circuit potential (OCP) and cyclic polarization measurements in 0.1 M NaCl. The electrolyte was prepared from a reagent grade of NaCl and de-ionized water (resistivity 18 MΩ·cm). A Solartron potentiostat and a three-electrode electrochemical cell consisting of the sample as the working electrode (10 mm2 exposure area), a saturated Ag/AgCl reference electrode, and a platinum-mesh counter electrode, was used for all electrochemical measurements. Samples were ground up to 1200-grit using SiC sandpapers. One sample was polished to 1 μm and used for surface morphology examination in an SEM after cyclic polarization.
The OCP was recorded for one hour at room temperature and the data was plotted in a graph (potential vs. time). The sample was then polarized with a scan rate of 10 mV/min (according to ASTM G61 - 86) from 200 mV below the measured OCP until 800 mV above the OCP or when the current reached 0.1 mA/cm2, followed by a reverse scan back to the measured corrosion potential. The data was plotted in a potential vs. current density diagram. Electrochemical parameters, i.e. the corrosion potential (Ecorr), corrosion current density (icorr), and pitting potential (Epit) were extracted. Ecorr and icorr were obtained by the interpolation method of Tafel slopes using Corrview2 software. The Levenburg-Marquardt method was used for curve fitting. All experiments were repeated three times for reproducibility and statistical confidence on different samples. The corrosion morphologies were analyzed in SEM after the polarization experiment.
SKPFM volta potential mapping
Volta potential mapping was carried out on 1/4 μm-polished and slightly chemically etched using Villella's reagent samples in air using the Bruker Icon AFM in double-pass mode, which measures first the topography and then the local Volta potential difference. The map area was 20 × 20 μm² and 4 × 4 μm² with a tip velocity of 3 μm/s and a pixel resolution of 512 points/line. 50 nm tip lift height was used. Potential acquisition was performed in PeakForce Tapping mode in ambient air. A DC voltage of 6000 mV was applied to the tip, and the sample was ground. Nanoscope Analysis V1.5 software was used for analysis of the data. Height maps were flattened using 0th or 1st order flattening. Potential maps were not flattened and no filter was applied to any map to smooth the data. The Volta potential roughness (RamV), as earlier introduced by Örnek et al.,14 was measured. In this paper, higher positive Volta potential differences mean lower absolute Volta potentials, indicating lower electrochemical nobilities.
In-situ corrosion study
In-situ corrosion study was carried out using an Agilent AFM in 0.1 M NaCl at room temperature in order to monitor and record the initiation and propagation of localized corrosion. Slightly chemically etched using Villella's reagent samples were used to facilitate visual contrast of microstructural constituents. The sample surface area of 4.5 × 3 mm² was exposed to the electrolyte. The liquid cell was not air-sealed i.e. there was free access of air/oxygen into the electrolyte. The scan area was 10 × 10 μm². Topography mapping was started within 30 minutes after exposure, which was needed for assembling the cell, engaging the probe, selecting the suitable area to be scanned and fine-tuning for better quality image. The area of interest was continuously mapped for 24 hours, with one map obtained per 18 minutes. A ContAl-G type of AFM probe (Si with Al reflex coating) was used. The resonance frequency of the cantilever used was 13 kHz and the spring constant was 0.2 N/m. Topography analysis of AFM data was done using Gwydion V2.4.7. Cross-sectional height profiles were extracted from martensitic sites and from regions with precipitates. The surface roughness (Ra) of the matrix phase was determined from the average of five randomly chosen cross sections. Topography maps were compared with each other and the change in height (Δz) was determined by subtraction of height profiles before (1st map obtained) and after corrosion (map obtained after 24 hours). The depth of localized attack next to precipitate was obtained from at least three cross-sectional profiles.
Results
Phase transformation (Dilatometry)
In Figure 1 length change versus temperature is shown. A linear expansion was observed with increase in temperature until 910°C, followed by an immediate onset of shrinkage indicating the incubation of phase transformation from ferrite (α) to austenite (γ). The shrinkage lasted until 951°C indicating the completion of the phase transformation reaction α→γ (Ac3 in Figure 1). A further increase in length until 1020°C was observed due to thermal expansion of the austenitic lattice and the dissolution of carbide precipitates. The material was then cooled and a linear behavior of the material length vs. temperature was seen, occurring until 283°C at which rapid material expansion was observed indicating the onset of martensitic transformation (α'), Ms in Figure 1. The change in length increased linearly with temperature up to 140°C, and then a bowing of the curve was seen indicating no further formation of martensite but cooling of the material.

Figure 1. Dilatometry results showing length change measured against temperature change pointing out the formation of austenite (Ac1) and martensite (Ms).
Prediction of equilibrium phases
Figure 2 shows the calculated phase diagram for the 800–1150°C temperature range. M7C3 and austenite are stable at this austenitization temperature (1020°C) and, hence, M7C3 carbides do not dissolve (denoted as undissolved carbides in this work). Thermocalc predicted a volume fraction of 98.4% for austenite and 1.6% for the M7C3 carbide. Furthermore, the calculations showed chromium content of 13.1 wt% for the austenite and 63.2 wt% for the M7C3 carbide.
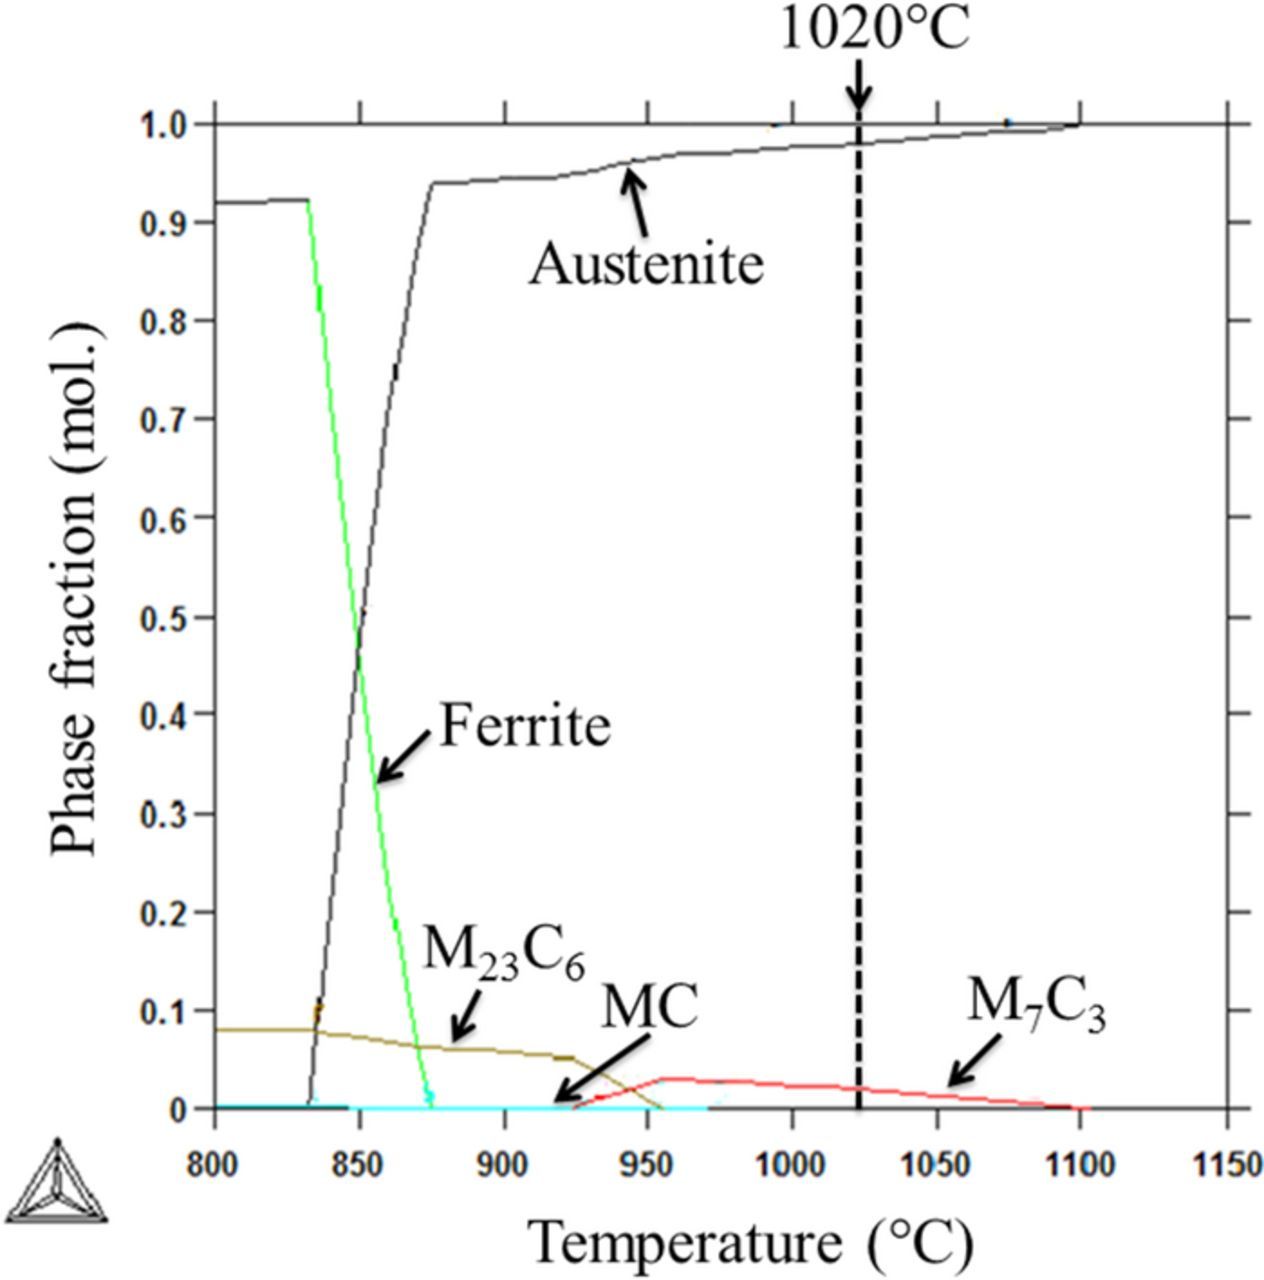
Figure 2. Thermocalc simulation showing equilibrium phases and their corresponding phase fractions at the austenitization temperature of 1020°C. Only M7C3 and austenite are stable at this temperature.
Microstructure characterization
Optical microscopy and SEM-EDX
Figure 3 shows the microstructure with undissolved carbides present in the martensitic matrix. A large fraction of precipitates was seen, which were homogeneously distributed in the microstructure but seemed also to be pinned to grain boundaries. Carbides particles were roundish-shaped, and some of them showed spherical and capsule-like morphologies (Figure 3). The fraction of carbides was ca. six particles per 100 μm². Martensitic laths were observed, shown in Figure 3c, indicating hierarchic tempered martensitic lath structures.33,34 Furthermore, some precipitates were seen within lath structures, denoted as intra-lath precipitates (possibly tempered carbides), having significantly smaller sizes (<200 nm) than the undissolved carbides. EDX mapping over an area containing undissolved particles showed enrichment in chromium and carbon and depletion in iron, indicating chromium-rich carbides (Figure 4). No further enrichment or depletion of any other alloying element was observed.

Figure 3. Optical (a) and SE-SEM (b+c) micrographs showing the microstructure. Inter- and intragranular spherical and roundish-shaped precipitates in the tempered martensitic matrix can be seen. Etched using Villella's reagent.
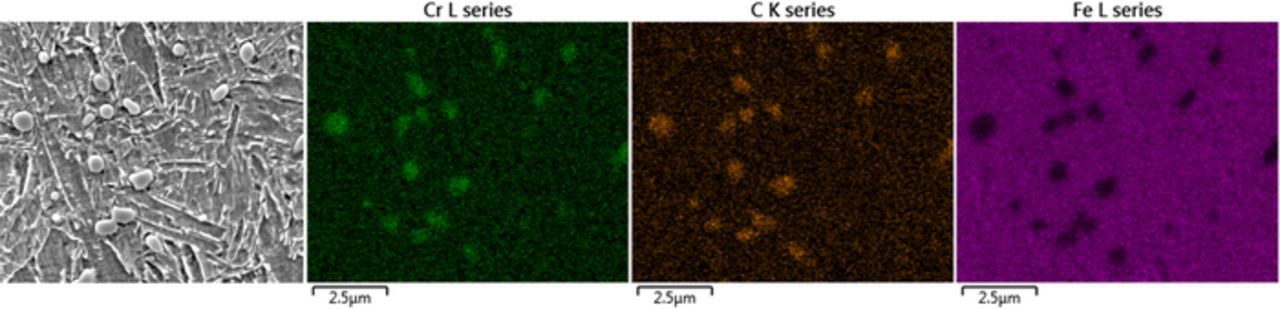
Figure 4. SEM-EDX mapping showing chromium and carbon enrichment and iron depletion on precipitates.
XRD phase identification
Figure 5 summarizes the XRD results. Martensite (α'), retained austenite (γ), M7C3 (indexed as Cr7C3), M23C6 (indexed as Cr23C6), and M3C (indexed as Fe3C) were detected. The peaks confirmed the presence of these phases in the microstructure, while the intensity and number of peaks gave an indication of their fraction. Strong diffraction signals of α' were obtained from (110), (200), and (211) planes. The peak corresponding to (040) plane of Cr7C3 was also clear and confirmed the presence of M7C3 carbide in the microstructure.

Figure 5. XRD results showing the presence of Fe3C, Cr7C3, and Cr23C6 carbides along with martensite and austenite.
The diffraction peak at 126.90° corresponded to the signal from the (220) plane of retained austenite. Moreover, diffraction signals of (111) and (200) planes for the austenite were also detected. The diffraction peak positions of (200)γ,  , and
, and  are very close to each other, and likewise the positions of the diffraction peaks of (111)γ,
  and
and  were very close to each other. It is clear that the symmetric appearance of the main (110) peak of martensite at 68.78° was affected by these secondary phases. However, by a closer look at the 62–68° window (left image insert in Figure 5), two clear peaks at 65.79° and 66.43° can be seen corresponding to signals from
  and (111)γ planes, respectively. These data evidently confirmed the presence of retained austenite and Fe3C. A fraction of 7 ± 2% was determined for retained austenite in the microstructure.
A diffraction peak at 74.82° was observed which belonged to the  plane, and there was a signal from the
  plane seen nearby this peak. Further diffraction signal from the
  plane was expected, but it seemed that a peak overlap may have occurred with the
  and (200)γ. A minor maximum at 78.90° was seen next to the peak at 78.47° and suggested this maximum being in line with the
  peak. However, the peak at 63.1° (see left image insert in Figure 5) corresponds to the
  plane, and this clearly showed the presence of Cr23C6 carbides in the microstructure. The fraction of Cr23C6 precipitates was very low as judged by their low diffraction signals.
AFM topography analysis
Figure 6 summarizes AFM high-resolution topography mapping showing the size and morphology of precipitates in the microstructure. Undissolved carbides were roundish and capsule-like in morphology and had sizes between 1–5 μm. Further salient nanometer-sized particles with lenticular shape were observed, present at intra-lath regions and lath boundaries, with an average length of 297 nm and an average width of 87 ± 40 nm.
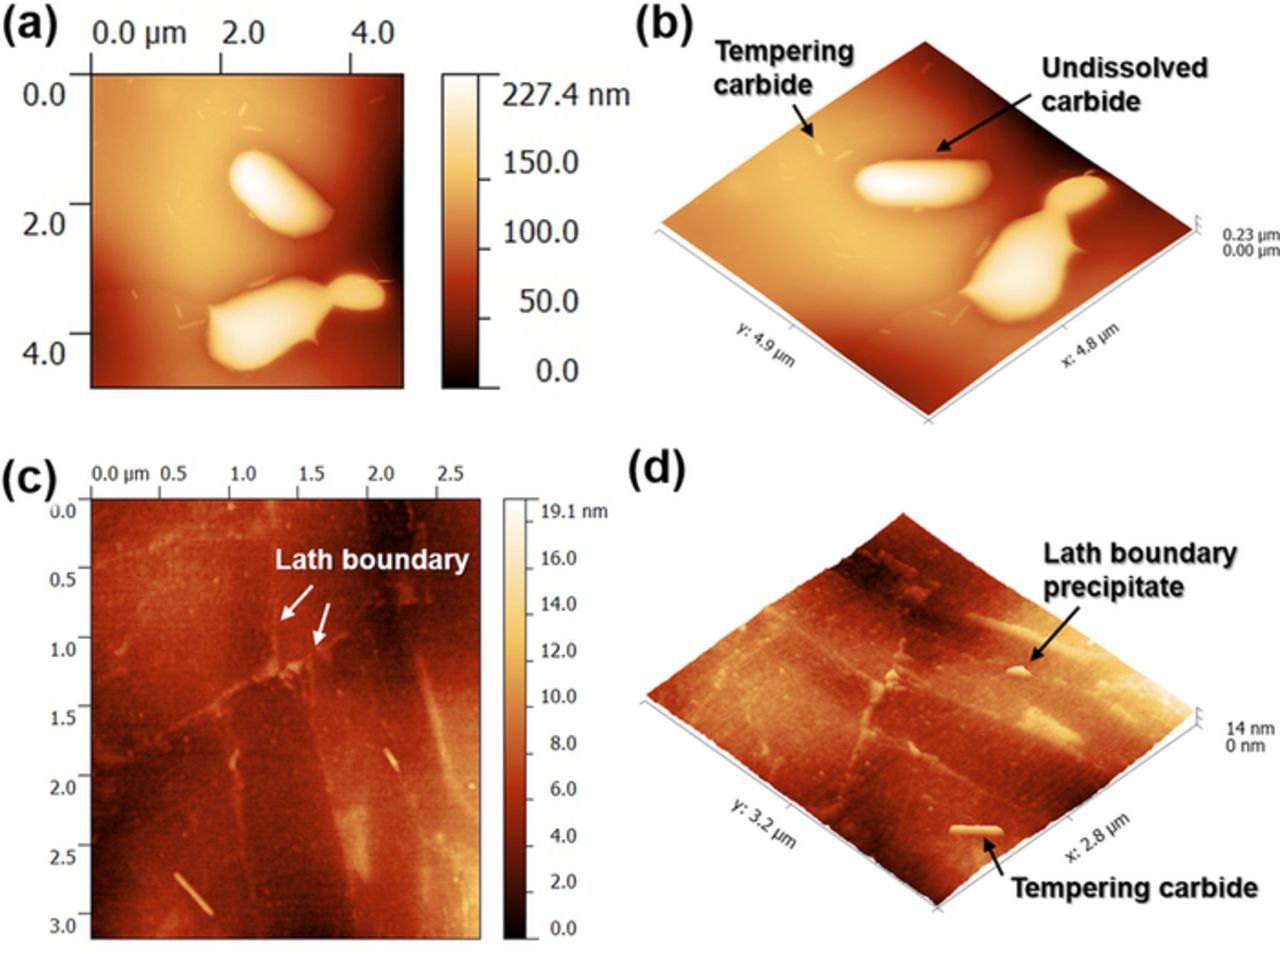
Figure 6. AFM topography mapping showing precipitate distribution with different sizes and shapes: (a+b) showing undissolved and tempered carbides, (c+d) showing lath boundaries and lath boundary precipitates.
Corrosion studies
SKPFM local volta potential mapping
Figure 7 displays the SKPFM maps showing local Volta potential differences of the sample surface. The carbides were seen being salient in the microstructure and the martensite laths exhibited large surface roughness, shown in Figure 7a. Chemical polishing led apparently to topographical heterogeneity with inter-lath boundaries showing less attack than intra-lath martensitic regions. Potential variations of up to 60 mV were measured across martensitic regions with steep gradients measured at inter-lath boundaries, shown in Figure 7b. The average Volta potential difference measured over the martensite matrix was 110 ± 30 mV with a potential roughness (RamV) of 8 ± 2 mV. Salient carbide particles, as earlier characterized as carbides, showed an average Volta potential difference of 70 ± 10 mV with a RamV of 2 ± 1 mV. There is a Volta potential difference of ≈40 mV between the martensite and the precipitates, indicating galvanic coupling. The potential difference measured over the carbides was less than that over the matrix, indicating higher electrochemical nobility of the carbides than α'.

Figure 7. SKPFM results showing (a) topography map and (b) the corresponding Volta potential differences map obtained from an area of 20 μm × 20 μm. Both profiles are sectioned along martensite laths.
Higher resolution Volta potential differences maps were obtained from a region containing carbides (Figure 8). Potential differences of up to 260 mV were measured between microstructure constituents, with large potential difference measured adjacent to carbides, as shown in Figure 8b. The corresponding topography map, Figure 8a, showed that this region might be associated with a precipitate that was not outstanding from the surface. Such features were observed only on a few regions but always situating next to the carbide.
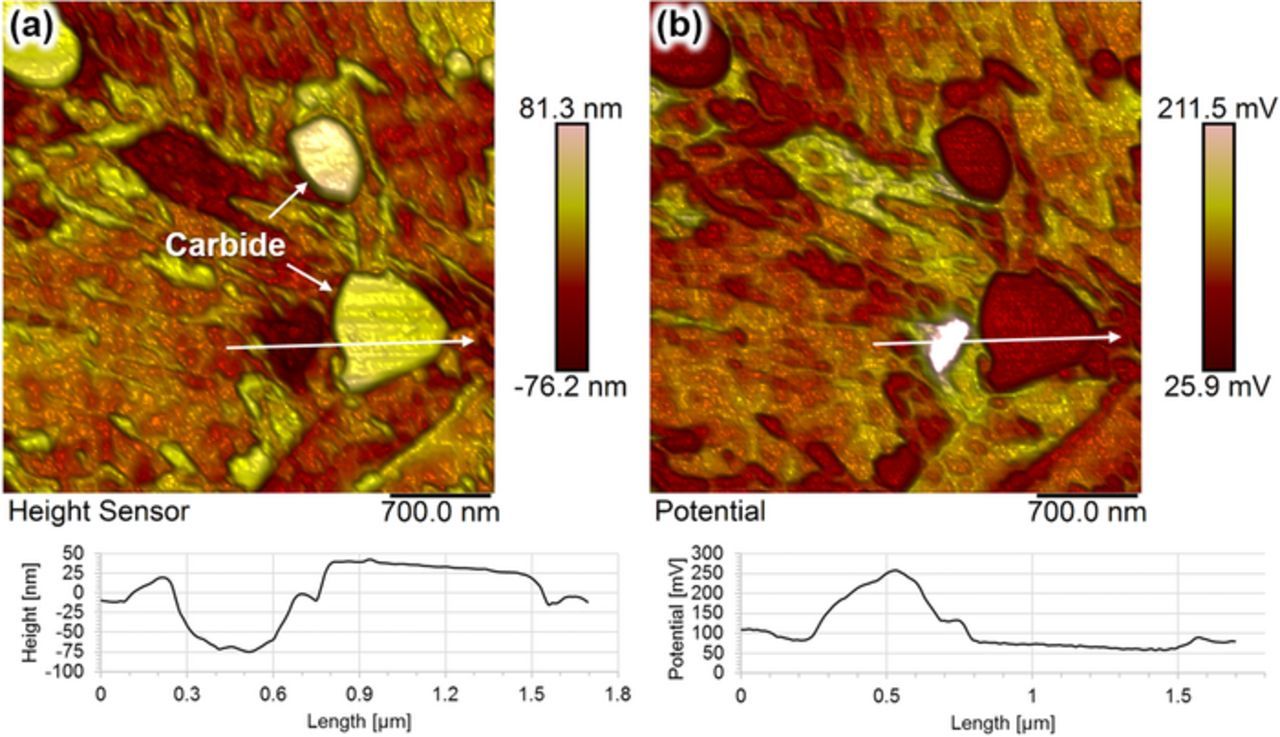
Figure 8. High-resolution SKPFM mapping showing (a) topography map and (b) the corresponding Volta potential difference map obtained from an area of 4 μm × 4 μm. The profile in each map is a section along two precipitates.
Electrochemistry
The OCP in 0.1 M NaCl vs. time plot is given in Figure 9, which represents three measurements. Potential fluctuations have been observed from the onset through the entire recording time, indicating metastable localized corrosion events. The frequency of fluctuations was observed to be more during the first 20 minutes and became less with further exposure. The OCP moved slightly to noble values from −112 mV in the beginning to −97 mV at the end. The width of the potential drops varied during the first 40 minutes with the lowest being at −206 mV, and then the metastable corrosion activity reduced significantly.
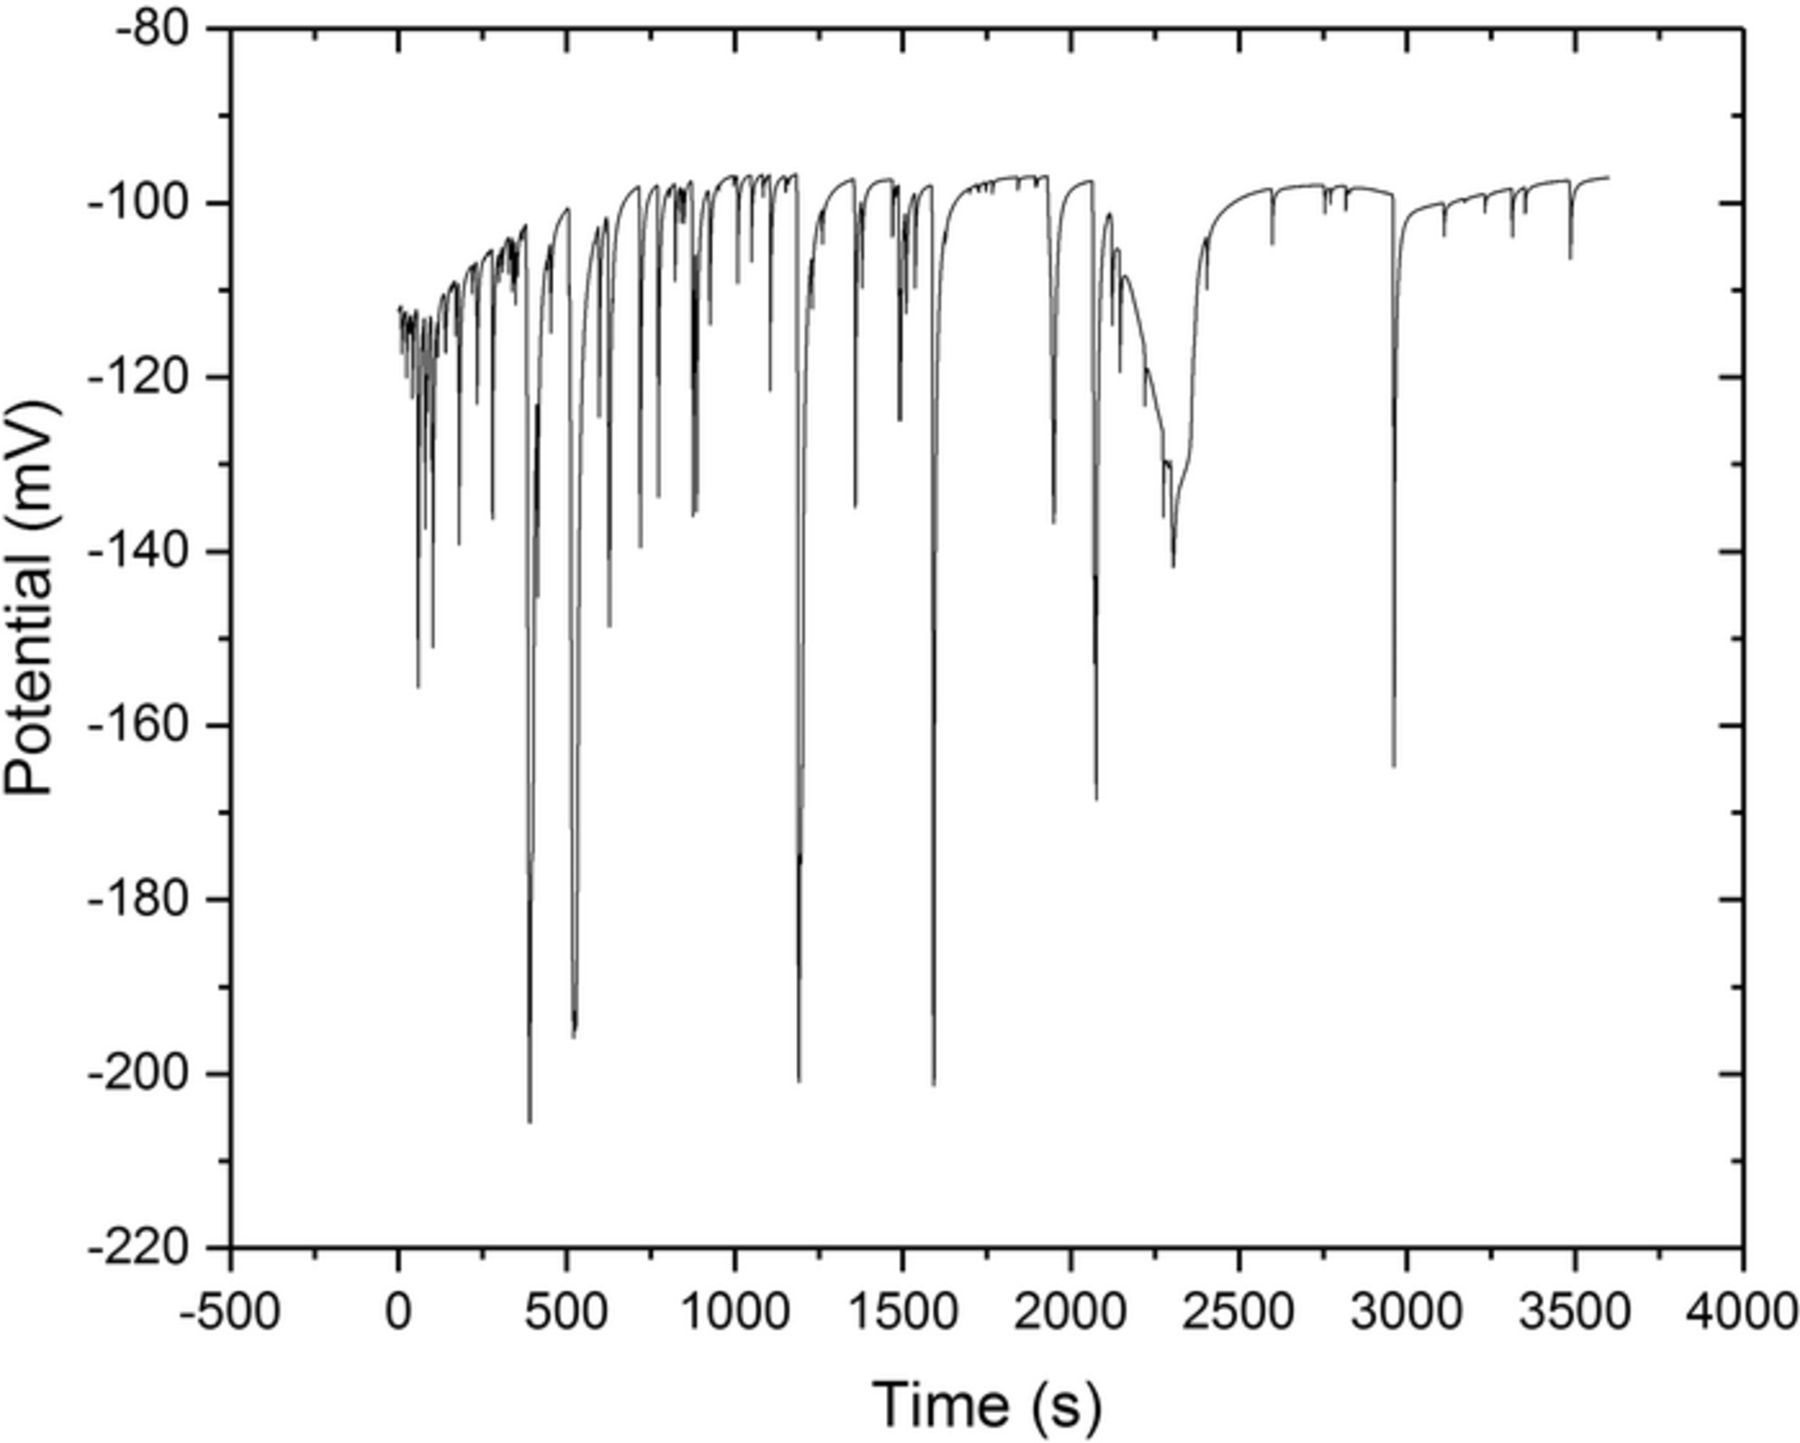
Figure 9. OCP vs. Time plot in a 0.1 M NaCl at room temperature showing metastable corrosion activities. The potential is versus Ag/AgCl. The graph is representative for all three OCP measurements.
Figure 10 displays the cyclic polarization behavior in 0.1 M NaCl electrolyte, which is representative for all three measurements. A corrosion potential (Ecorr) of −125 mV and a corrosion current (icorr) of 1.72·10−7 A/cm² was obtained from the data. In the anodic part of the polarization curve, metastable corrosion activities were seen. A pitting potential (Epit) of 117 mV was measured, apparent from the steep increase in current density. A large loop in the cyclic polarization curve suggests a weak tendency to re-passivate i.e. localized corrosion will propagate substantially once stable pitting has initiated. Some electrochemical parameters obtained from the cyclic potentiodynamic polarization measurements are summarized in Table II.
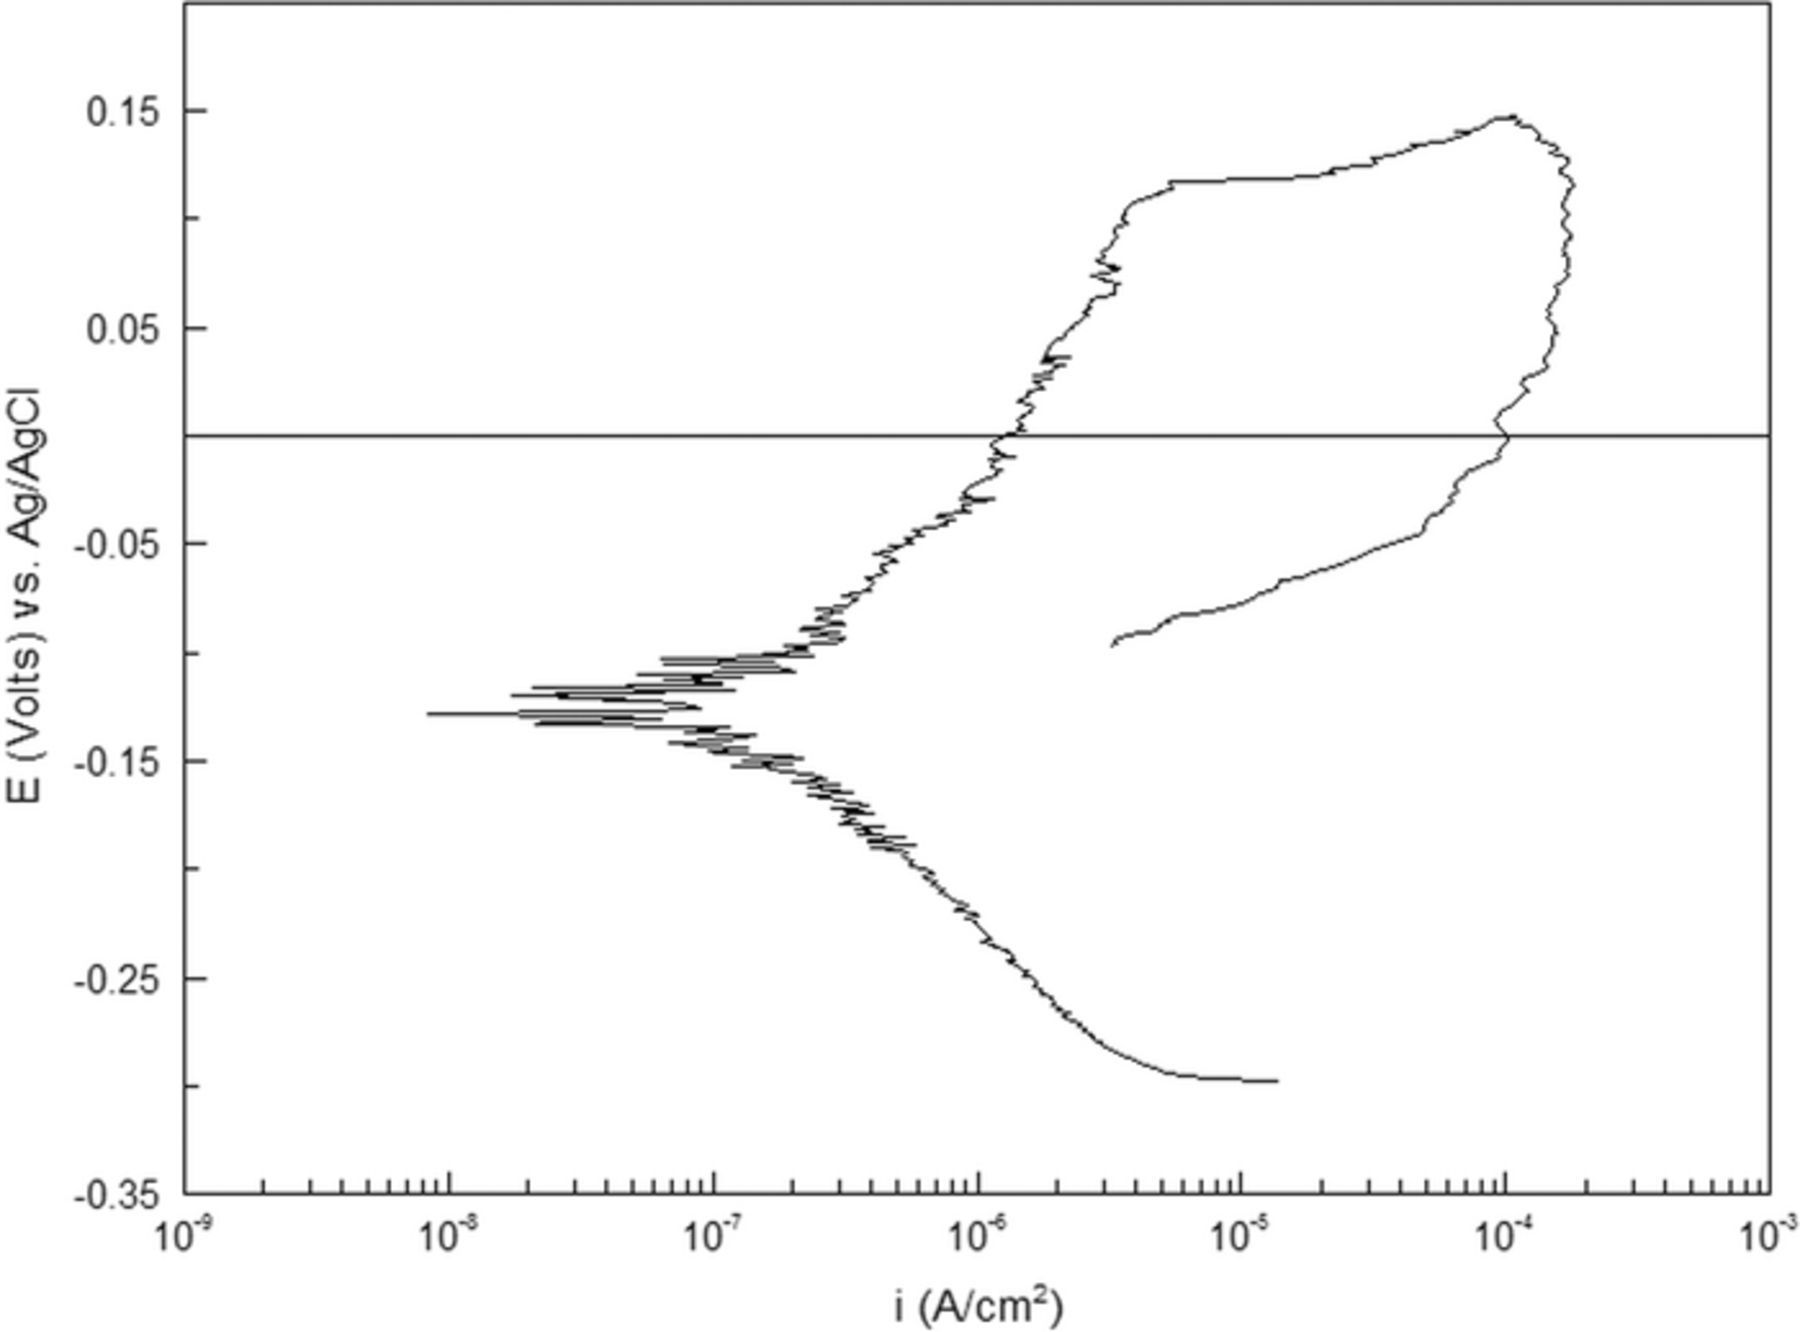
Figure 10. Cyclic potentio-dynamic polarization curve for the sample in a 0.1 M NaCl solution at room temperature. The graph is representative for all three polarization measurements.
Table II. Electrochemical data obtained from cyclic potentio-dynamic polarization measurements giving average values obtained from three experiments.
| Ecorr (mVAg/AgCl) | icorr (A/cm2) | Epit (mVAg/AgCl) |
|---|---|---|
| −131 ± 10 | (1.35 ± 0.42) · 10−7 | 77 ± 35 |
In-situ corrosion observations
Figure 11 summarizes the in-situ corrosion AFM measurements. Cross-sectional topography analyses showed the roughness of martensite changed from Ra = 6.9 ± 1.3 nm to 4.5 ± 0.7 nm during 24 hours of exposure. Predominant attack was observed on inter-lath boundaries. There was a positive height change in average of 9 nm ± 0.7 nm measured between the apex of carbides and the martensitic matrix, indicating preferential dissolution occurring on the martensitic matrix. Pronounced localized corrosion attack was observed on adjacent sites of some precipitates, with a maximum local dissolution depth of 5 nm. Localized corrosion was seen to occur on certain regions only, as highlighted in Figures 11a + 11c. No clear change in height was measured for the particle, whereas a decrease in height and width between inter-lath regions was observed, as can be seen through the line profiles in Figures 11e + 11f. The carbide particle size appeared to be relatively larger and the distance between the carbide particles was relatively smaller at the end of the exposure, again, indicating preferential dissolution of the matrix adjacent to carbide particles.
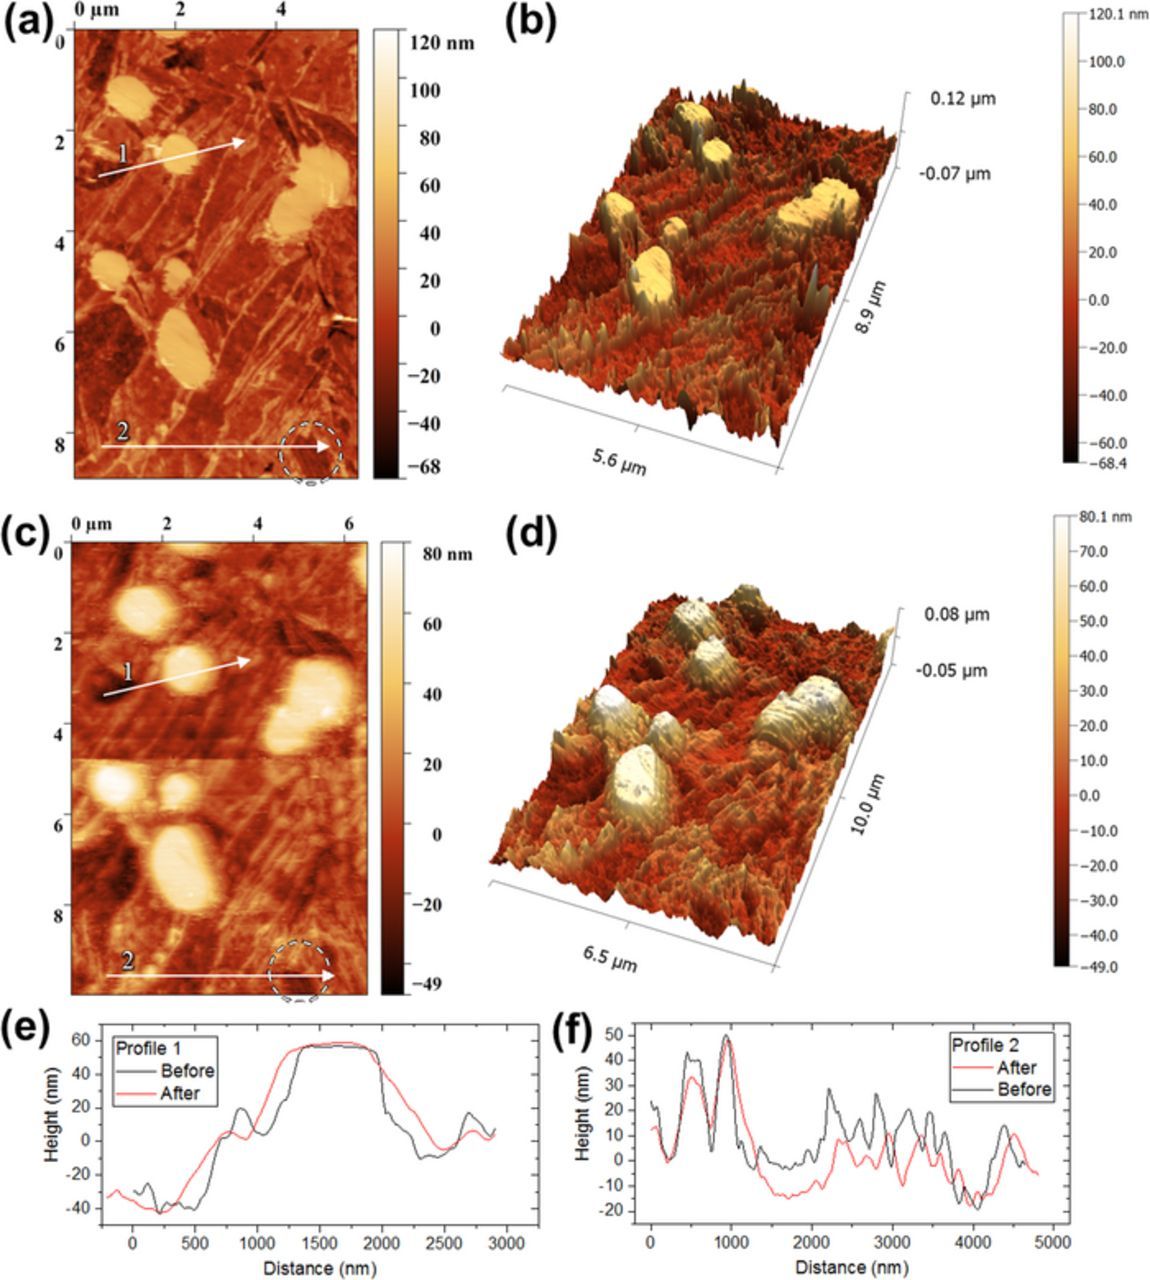
Figure 11. In-situ AFM maps showing corrosion events occurring on adjacent sites of precipitates: (a+b) before corrosion, and (c+d) after 24 hours of exposure to 0.1M NaCl at room temperature, (e+f) height profiles for line 1 and 2 in (a+c) showing topographical changes occurred.
Post-polarization surface morphology analysis
Figure 12 shows the surface of the sample after cyclic polarization. Preferential dissolution occurred on adjacent sites of carbide interphase regions. Furthermore, localized corrosion attack seemed to occur preferentially only along some of the carbide precipitates, whereas the periphery of the most of the smallest particles seemed not to have been affected.

Figure 12. BSE-SEM micrographs showing localized corrosion events occurred after the cyclic polarization measurement.
Discussion
Microstructure – prediction vs. reality
A linear increase of length with increasing temperature is typically associated with thermal expansion,35 and the transformation of austenite to martensite is accompanied by volumetric expansion.36 Since a linear portion after the martensitic transformation at room temperature was not observed, it can be inferred that the transformation was incomplete during the heat-treatment, suggesting the presence of retained austenite.35 Carbide formation during rapid cooling may have occurred (known as quenching carbides), and they usually precipitate along grain boundary regions during quenching.35 Moreover, nanometer-sized salient features were seen on AFM topography maps and suggested the existence of tempering carbides in the microstructure, typically being Fe3C.8
Thermocalc predicted M7C3 and austenite at austenitization temperature of 1020°C. XRD examination confirmed the presence of both M7C3 and retained austenite. Phase prediction by Thermocalc, in general, showed good agreement with XRD and microstructure examinations. However, Thermocalc can only predict stable phases for a given temperature, and cannot predict non equilibrium phases such as α', Fe3C and chromium carbides formed during quenching and tempering, as they involve kinetics, which is not considered in phase equilibrium calculations. It should be noted that two non-identified peaks were seen in the XRD data as indicated by the question marks in Figure 5. The peak positions do not correspond to VC carbide. Further research is needed to elucidate this observation.
Corrosion behavior and influence of microstructure
Volta potential mapping showed larger potential differences over martensitic regions than on carbide precipitates and indicated the matrix phase as electrochemically less noble than the precipitates. In addition, large potential gradients along carbide/matrix interphase regions were measured suggesting that these regions could be more susceptible to corrosion during exposure to corrosive electrolytes. Large potential differences among microstructure constituents would indicate galvanic coupling in which the matrix would be expected as the local anode and carbides as the local cathode.13–15 However, steep potential gradients along carbide/matrix interphase boundary regions were measured with much larger potential differences than between carbide and the matrix, therefore, carbide/matrix interphase boundary regions would be expected to behave most anodic than any other sites in the microstructure. Carbides are typically associated with chromium depletion adjacent to them, a phenomenon known as sensitization due to a resulting loss of corrosion resistance.37–39 High anodic activity would therefore be expected to occur preferentially on sensitized regions.
In-situ corrosion analyses showed preferential attack on sites adjacent to precipitates and inter-lath regions, which are in good agreement with the SKPFM assessments. Most localized corrosion attack occurred on sensitized regions and indicated highest anodic activity, whereas inter-lath seemingly corroded less. Apparently, intra-lath regions behaved cathodic. In contrast, inter-lath regions typically contain relatively high stored energies,40 and microstructures showing strain localization are, in general, more susceptible to localized corrosion.14,15
The OCP and polarization measurements showed significant potential and current fluctuations indicating corrosion activities. Such events are typically associated with metastable pitting activity; however, both SKPFM and in-situ corrosion analyses showed that these were more likely due to localized corrosion attack related to the microstructure. Localized corrosion may occur already at Ecorr owing to the material's susceptibility to chloride corrosion. Nevertheless, the low corrosion current density measured is in good agreement with the minor attack occurred under OCP conditions. The material was still in its passive state since metastable localized corrosion events did not develop into stable pitting, at least with 24 hours of exposure as can be seen from the in-situ AFM results. However, the polarization curve showed weak passivity, as evidenced by the linear increase of current density with potential and a narrow passive range.
The cyclic polarization curve also indicates that there is a weak tendency for re-passivation once stable pitting occurred, at least until OCP. The current-potential response after stable pit initiation (large hysteresis loop) shows that, once pitting initiates, there is a high tendency for pit propagation for this material.41,42 These observations are in line with those of Taji et al. who also observed similar polarization behavior of AISI 403, tempered at 300°C, in 3.5 wt% NaCl and concluded susceptibility to localized corrosion under the free natural corrosion potential.43
In summary, the corrosion studies showed that grade 420 martensitic stainless steel is susceptible to localized corrosion in 0.1 M NaCl. There are preferentially-active sites in the microstructure, particularly carbides interphase regions, that are more prone to corrosion.
Conclusions
- The microstructure of grade 420 martensitic stainless steel, tempered at 250°C, contains M7C3, M23C6, and M3C carbides, and retained austenite.
- Both SKPFM measured Volta potential differences mapping and in-situ corrosion AFM measurements showed higher electrochemical nobility of the carbides than the martensitic matrix. Regions in the microstructure with highest susceptibility to localized corrosion are regions adjacent to carbides, followed by inter-lath regions.
- Open-circuit potential and cyclic potentiodynamic polarization measurements showed metastable local corrosion events which could develop into stable pitting in 0.1 M NaCl. Re-passivation of metastable corrosion sites was observed, whereas a weak tendency for re-passivation, upon stable pitting, was seen, and indicated a risk for localized corrosion in chloride-containing medium.
Acknowledgment
The authors acknowledge the financial support by Uddeholms AB, Hagfors, Sweden. Amanda Forsberg, Uddeholms AB and Christer Soderstrom, Uddeholms AB are thanked for their support in dilatometry and XRD experiments. Special thanks are also directed to Dr. Seshendra Karamchedu, Uddeholms AB and Robin Nilsson, Uddeholms AB for the fruitful discussions about XRD and SEM analyses. The support of Dr. Majid Sababi, Dr. Mattias Forslund, and Dr. Fan Zhang, Surface and Corrosion Science, KTH during AFM measurements is appreciated.