
Abstract
A green to orange emitting nitridosilicate based phosphor was developed for white-LED application. Observed broad-band emission in green to orange range is originated from Eu2+ and Yb2+-trap site of double doped SrSi2O2N2:Eu2+,Yb2+ nitridosilicate phosphor. Energy transfer between activator ions was confirmed by measuring of decay time of the green-emission as energy donor. The effect of co-doping by different ratio of activator ions on the photoluminescence properties was studied. Emission of the obtained phosphor is function of activator ion contents, and by increasing the Yb2+ concentration, the red emission dominants over green emission. The obtained phosphor was combined with InGaN blue-LED chip (λ = 450 nm) to create white-light. The color balance control was realized by two steps. At first green to orange ratio was optimized by adjusting concentration of Eu2+ and Yb2+ ions. At second step, by increasing amount of phosphor powder the CIE coordinates were shifted from [0.2805; 0.2014] to [0.4071; 03789]. At optimized condition generated white light has color rendering index about 89. The LED based on the developed single-phase double-color emitting nitridosilicate phosphor and blue-LED chip showed high color stability against wide range of forward-bias current (100 to 500 mA at 3 V).
Export citation and abstract BibTeX RIS
Currently, InGaN-based white light-emitting diodes (LEDs) draw considerable attention as a next generation of lighting due to their several advantages over incandescent lamps, such as high efficiency, environmentally friendly character, reliability, miniature size, a long life, etc.1,2 The most common way to create a white-light is the combination of InGaN blue LED chip and Y3Al5O12:Ce3+ (YAG) yellow phosphor.3 However, the application of these white LEDs is limited due to the fact, that the output light cannot realize a desirable color balance for a true color rendering without red light component. To overcome this problem, multiple phosphor-based LED has been applied to enhance red luminescence.4 Multiple-phosphor approach shows several advantages over YAG:Ce3+ + blue LED chip approach, such as sufficient color rendering (Ra), high efficiency and brightness.5 Nevertheless, different thermal quenching of the individual phosphors causes aberration in color rendering against input power, as well as increases the production cost for real application. On the other hand, the different phases of phosphors lead to decreasing of luminous efficiency due to the re-absorption in the multiple-phosphor based LED. Highly stable color rendering against an input power has been achieved by utilizing full-color emitting single-phase phosphor, based on oxide and silicate compositions.6–9
Recently, the nitridosilicate and oxynitridosilicate based down-conversion phosphors show outstanding stability against temperature and high luminous efficiency.10–19 J. Ruan et al. reported photoluminescence properties and structure of the Eu2+ and Yb2+ doped SrSi2O2N2 oxynitridosilicate phosphor showing broad-band emissionin green to orange range with full width at half maximum 170 nm and external quantum efficiency about 16% under 450 nm excitation.17 The authors confirmed the energy transfer from Eu2+ to Yb2+ ions. This paper reports the structure and photoluminescence properties of double-color emitting SrSi2O2N2:xEu2+, yYb2+ oxynitridosilicate. The obtained phosphor was used as a single light convertor in combination with blue-emitting LED chip to create warm white light with high color rendering index and stable CIE against wide range of forward-bias current.
Experimental
Si3N4, SrCO3, Eu2O3 and Yb2O3 were used to synthesize SrSi2O2N2:Eu2+,Yb2+ green to orange emitting phosphor. All ingredients with at least 3N purity were purchased from Aldrich Company and used without any further purification. The stoichiometric amount of the starting materials were mixed thoroughly by an agate mortar using ethanol, dried 2 h in an oven at 120°C. As prepared powder mixtures were packaged in an alumina crucible, and subsequently, fired at 1400°C for 8 h in a horizontal alumina tube furnace in the N2/H2 (5%) gas flow. Eu2+ concentration was fixed at 2 at% with respect to that of Sr2+ ion, the meantime the amount of Yb2+ ion was varied from 0 to 8 at%. A slightly sintered sample has been obtained after firing, which later on, was preliminary grinded into a fine powder. As-prepared phosphor powder was applied to generate white light LED. The obtained phosphor powder mixed with silicon resin (The Dow Chemical Company, EG6301A and EG6301A) then the mixture was packed on top of InGaN based blue-emitting chip, and dried at 120°C for 2 h.
Phase composition analyzes were carried out by using X-ray diffractometer (Rigaku D/max IIIC, Rigaku, Japan; with Cu Kα (λ = 1.542 A°) at RT. The microstructure of the synthesized powder was evaluated using scanning electron microscope (S-5000, Hitachi Ltd., Tokyo, Japan). The photoluminescence spectra were recorded at room temperature using a fluorescent spectrophotometer (F-700, Hitachi Ltd., Tokyo, Japan) with a 150 W Xe lamp as an excitation source. Decay time was recorded by streak camera C4334 (Hamamashu, Japan). The quantum efficiency was recorded using integrated sphere method. Thermal quenching was tested using PTE-VUVD2L-100.
Results and Discussion
Figure 1a shows the X-ray diffraction patterns of the obtained powder singly doped and co-doped by two ions, e.g. Eu2+ and Yb2+. The peaks of the X-ray diffraction patterns of all samples are matched fairly well to those of the SrSi2O2N2 reference (JCPDS 49-0840). Several unindexed peaks at 27 to 31° (corresponding peaks are marked with "*") of unknown phase are present, which have been also reported in previous studies.17–19 However, compared to the results reported by J. Ruan et al. obtained product consists of almost a single phase, and does not contain significant amount of impurities, such as Sr2SiO4. With introducing of Yb2+ the new peak arises at 28° (corresponding peak is marked with "o"), which can be seen in several samples, however, its origin is not clear. The ionic radii of Eu2+ (1.17 Å, 6-coordination number)18 and Yb2+ (1.14 Å, octahedral coordination)20 are close to that of Sr2+ (1.18 Å, 6-CN.)18 As showed in the previous studies,16,17 Eu2+ and Yb2+ cations preferably occupy the Sr2+-sites in the lattice of SrSi2O2N2. In our experiments negligible displacement of position of the XRD peaks suggests that forming of solid–solution process has occurred when SrSi2O2N2 is doped with Eu2+ and Yb2+. Worth to note, that results obtained are well matched to previously reported researches.16,17 Figure 1b shows the micrograph of the SrSi2O2N2:Eu2+,Yb2+ phosphor. The powder consists of well-crystallized grains with average particle size of 5–10 μm. The powder is well dispersed obviously, although some agglomerates can be observed, too.
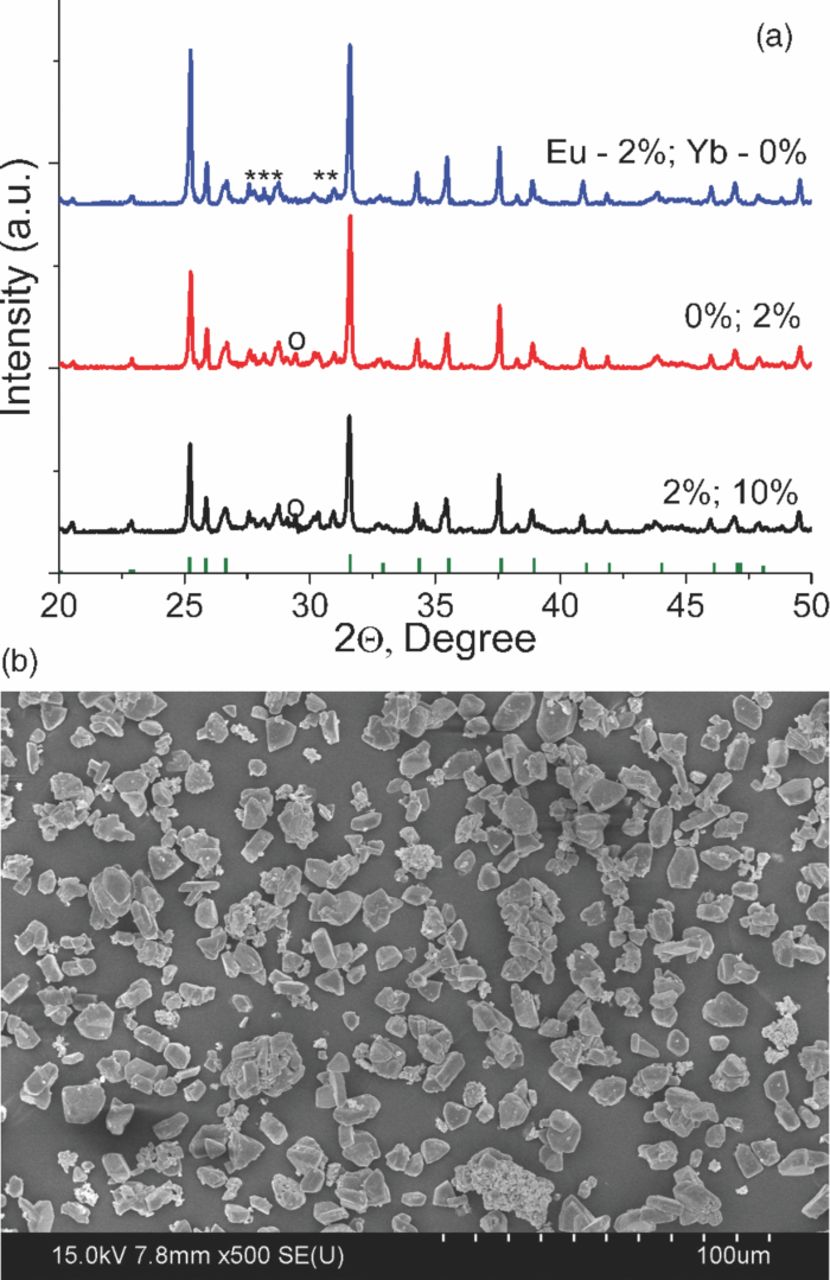
Figure 1. a) XRD patterns of SrSi2O2N2:xEu2+,yYb2+ (x = 0–2, and y = 0–10), phosphor powder prepared at 1400°C for 8 h, reference JCPDS 49-0840 card of SrSi2O2N2 is plotted at the bottom, "*" - unindexed peaks, "o" - unidentified peak. b) SEM image of the phosphor powder synthesized at 1400°C for 8 h.
Figure 2 shows the excitation and emission spectra of Eu2+ and Yb2+-doped SrSi2O2N2 phosphor. The emission spectrum of SrSi2O2N2:Eu2+ phosphor shows a single emission band peaked at 540 nm, which is assigned to the 4f65d1→4f75d0 transition of Eu2+ ion.15–19 The emission is observed at longer wavelengths compared to well known silicate21 or aluminate22 based phosphors due to higher degree of covalency between the activator ion and surrounding ligands.16 The full-width at half maximum (FWHM) of the emission band is 76 nm. The excitation spectra of Eu2+ monitored at 540 nm shows the excitation band in 200–500 nm range. The excitation spectra consist of several unresolved sub-bands attributed to the 4f65d1 excited states of Eu2+ ions.16,17 The spectra of emission and excitation fairly agree to those of reported earlier.14–20 The emission of Yb2+ doped SrSi2O2N2 phosphor is a single emission band peaked at 612 nm attributed to relaxation to 4f135d0 level of Yb2+ ions (FWHM = 130 nm). The excitation spectrum of SrSi2O2N2:Yb2+ phosphor consists of several bands, which is assigned to f-d transition. The unusual red-shifting of the emission band of Yb2+ ion in the SrSi2O2N2:Yb2+ phosphor is observed and well described by V. Bachmann et al.16 Emission was ascribed to an Yb2+-trapped exciton luminescence. Notable, as can be seen the excitation spectrum of the SrSi2O2N2:Yb2+ is partially overlapped with the emission of SrSi2O2N2:Eu2+ phosphor in 470–550 nm range. According to Dexter's theory,23 the energy transfer rate is proportional to the spectral overlap between the energy donor (e.g. Eu2+) emission band and the energy acceptor (Yb2+) absorption band.
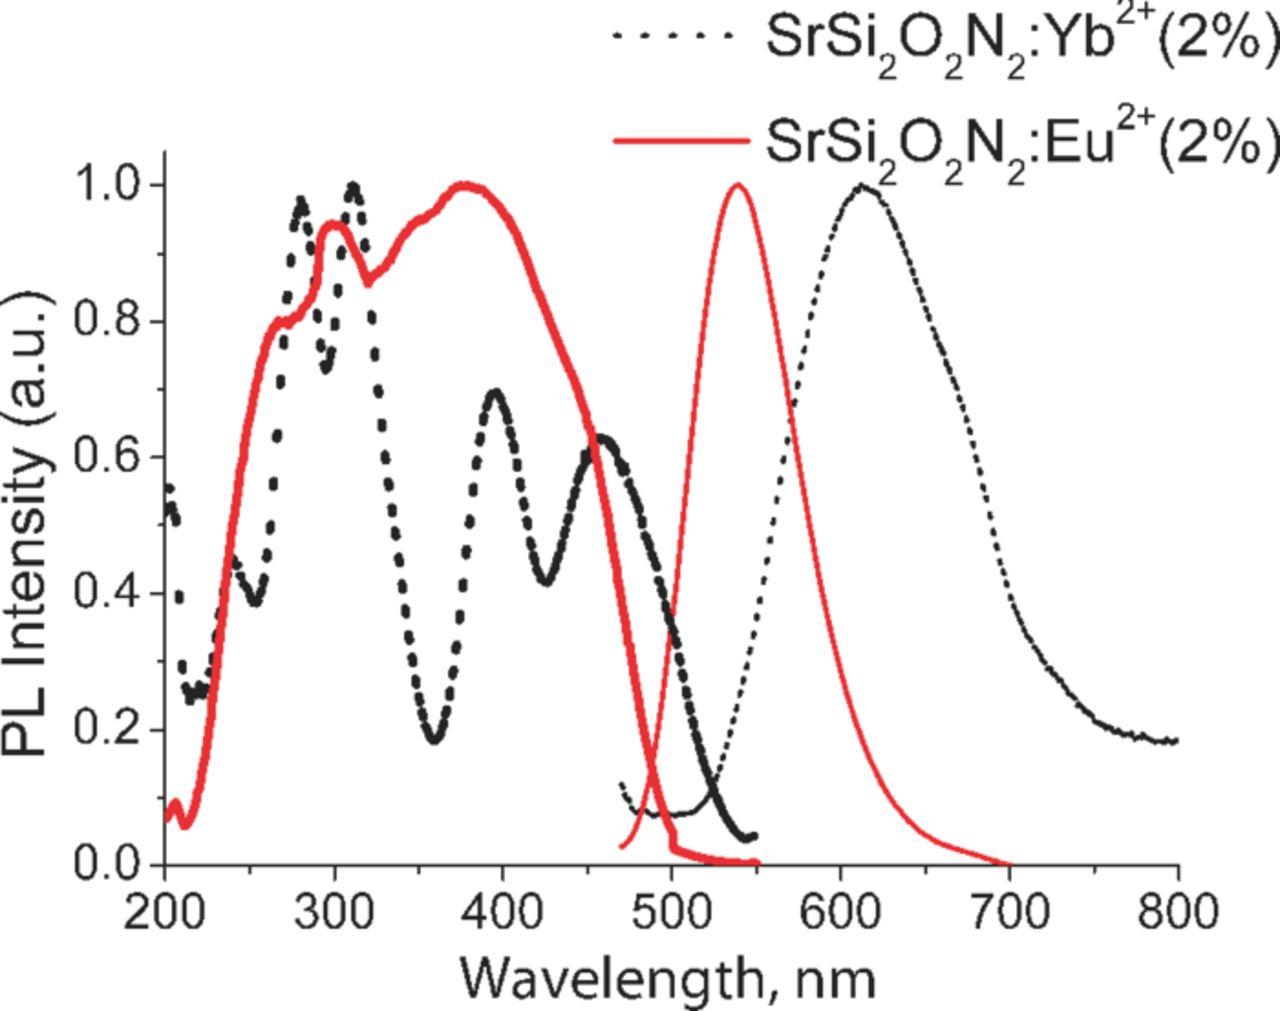
Figure 2. (Color online) Luminescence excitation and emission spectra of SrSi2O2N2:Eu2+ (2% At) and SrSi2O2N2:Yb2+ (2 at%) (recorded at RT).
Figure 3 shows the emission spectra of SrSi2O2N2 phosphor co-doped with Eu2+ (2 at%) and Yb2+ (1–8 at%) ions. The obtained phosphor shows broad band emission, which can be well decomposed into two Gaussian curves peaked at 540 and 612 nm (doted lines in figure 3, showed the decomposed curves for 4% Yb2+ ion contents). Those two sub-bands are characteristically for single doped SrSi2O2N2 phosphor as shown above. As content of Yb2+ ion increases in the SrSi2O2N2:xEu2+,yYb2+ phosphor, the green emission (λem. = 540 nm) originated from Eu2+ decreases and, consequently, orange emission from Yb2+-trapped exciton (λem. = 612 nm) appears. This phenomena may be explained by the energy transfer between the Eu2+ ion emission and Yb2+ ion absorption bands. The curve shape, and emission intensity vs. activator ion concentration trend is similar to that of reported by J. Ruan et al.17 At relatively low concentration range of Yb2+ (1–2 at%) the intensity at 612 nm increases, and then, above 2 at% the PL intensity decreases due to concentration quenching ascribed to the cross relaxation process between trapping site of large number of Yb2+ ions.17 Accordingly the (x, y) CIE coordinates are shifted to the orange region (see inset of figure 3).
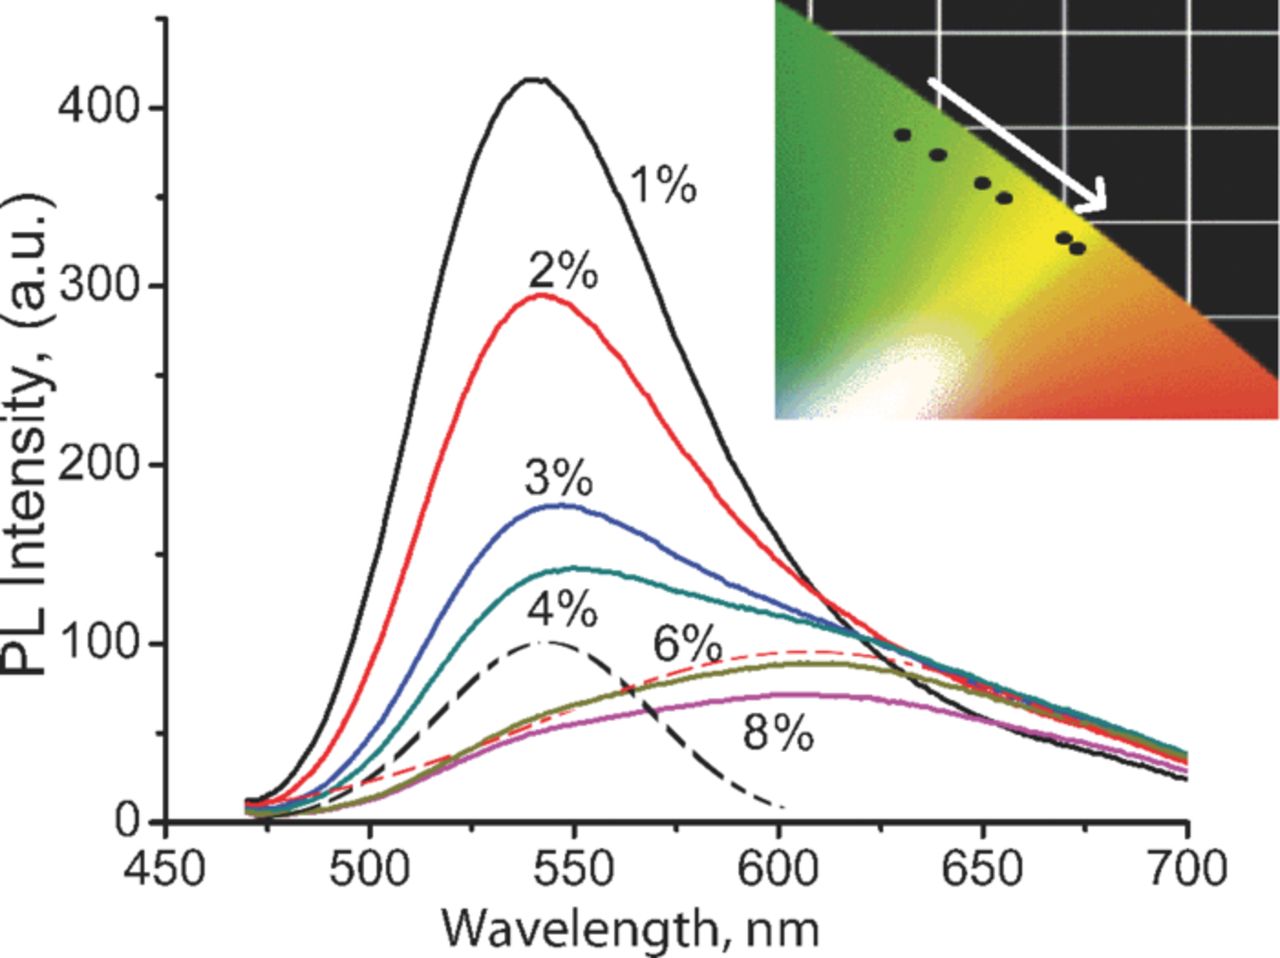
Figure 3. (Color online) PL emission spectra of SrSi2O2N2:Eu2+,Yb2+ green to orange emitting phosphor containing 2 at% Eu and 1–8 at% Yb excited at 450 nm excitation source (recorded at RT). Dashed lines present Gaussian decomposed curves for 2 at% Eu2+ and 4 at% Yb2+ ion content. Inset shows the CIE color chromaticity coordinates depending on Yb2+ ion contents.
The spectral overlap between the Eu2+ emission and Yb2+ absorption bands gives rise to the energy transfer between them. The energy transfer among luminescent centers is verified by decreased values of decay time constant. Figure 4 shows the luminescence decay time curves monitored at 540 nm of the obtained phosphor recorded at room temperature. The luminescence decay curves can be well approximated by double-exponential decay curve given by equation 1.24
![Equation ([1])](https://content.cld.iop.org/journals/2162-8777/2/1/R5/revision1/jss_2_1_R5eqn1.jpg)
Here I is the luminescence intensity; t is the time; A1 and A2 are constants; and τ1 and τ2 are short and long lifetimes for exponential components respectively. Based on the determined values for all aforementioned parameters, the average decay time (τ*) can be calculated by the equation 2.
![Equation ([2])](https://content.cld.iop.org/journals/2162-8777/2/1/R5/revision1/jss_2_1_R5eqn2.jpg)
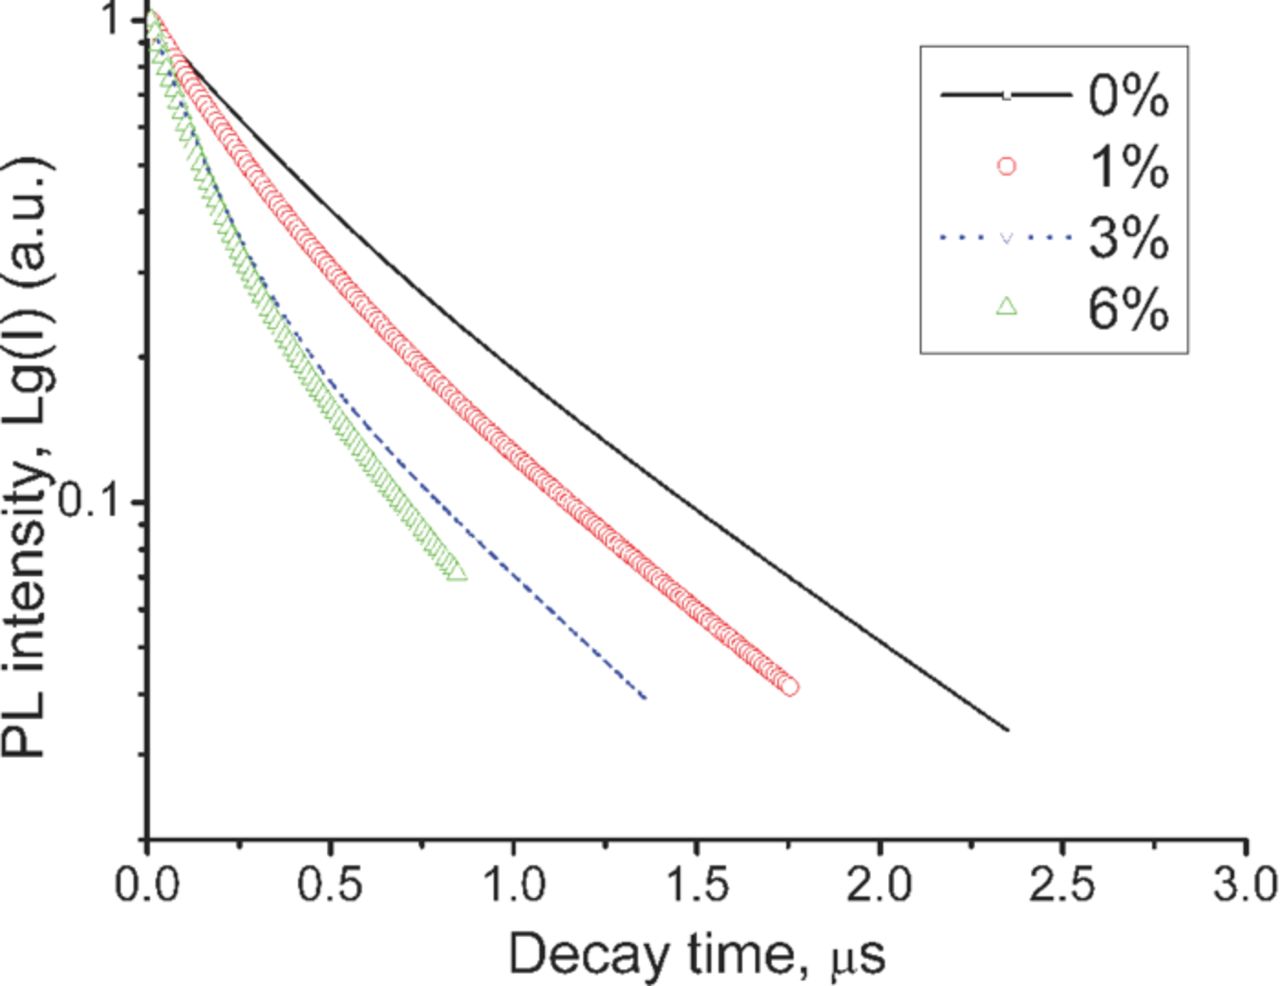
Figure 4. (Color online) Decay curves of the Eu2+ emission (for 540 nm emission) recorded at RT.
The average decay time (τ*) is calculated to be 0.66, 0.56, 0.44, and 0.35 μs for 0, 1, 3, and 6 at% of Yb2+ ion content respectively. The obtained decay time τ* is close to the typical value (1 μs) for the parity and spin allowed 5d–4f emission of Eu2+ ion.6,8,16,17,23,24 By increasing the content of Yb2+ ion the decay time of Eu2+ decreases down to 0.35 μs indicating energy migration to trapping site of Yb2+ ion.
Figure 5a shows the temperature dependence of the luminescence emission of SrSi2O2N2 phosphor co-doped with 2 at% Eu2+ and 6 at% Yb2+. With increasing temperature, the orange component decreases significantly compared to the green component. This phenomenon also supports that the orange emission is originated from Yb2+-trapping site which is sensitive to the temperature variation. CIE coordinates gradually moves from [0.5095; 0.4832] to [0.455; 0.5344] by increasing temperature, which can be well seen on the picture 5b. We also applied the obtained phosphor with 2 at% Eu2+ and 6 at% Yb2+ composition as a down-conversion phosphor for white LED application. Commonly, the mixture of individual green and orange-red emitting down-conversion phosphors are being used to generate white light in combination with InGaN-based blue LED chip.25 Thus, the emission color balance can be easily tuned by varying the amount of each phosphor. In the prepared LED, since only single green to orange emitting phosphor was being used, we varied its amount to achieve the highest color rendering (figure 6, spectra are normalized based on blue emission). Here the shape of curve in green to orange range is different from the corresponding one (2 at% Eu2+ and 6 at% Yb2+) presented in the figure 3, where orange emission is higher compared to green emission. However, this difference is ascribed to the effect of temperature on PL emission. Thus, the curve shape obtained at LED operation (figure 6) is similar to that of in the figure 5a corresponding to 75–120°C range. Notably, this temperature range is matched with the operating condition of the LED chip. At relatively low amount of phosphor compared to encapsulation resin, which indicated by "m1", the blue emission dominates (CIE x = 0.2805; CIE y = 0.2014). By increasing the total amount of light converting phosphor by m1 < m2 < m3 < m4, emission from blue range gradually moves to white area, and then to green-orange area (m4 sample, CIE x = 0.4071; CIE y = 0.3789). Inset of figure 6 graphically indicates the CIE coordinates for corresponding LED chips.
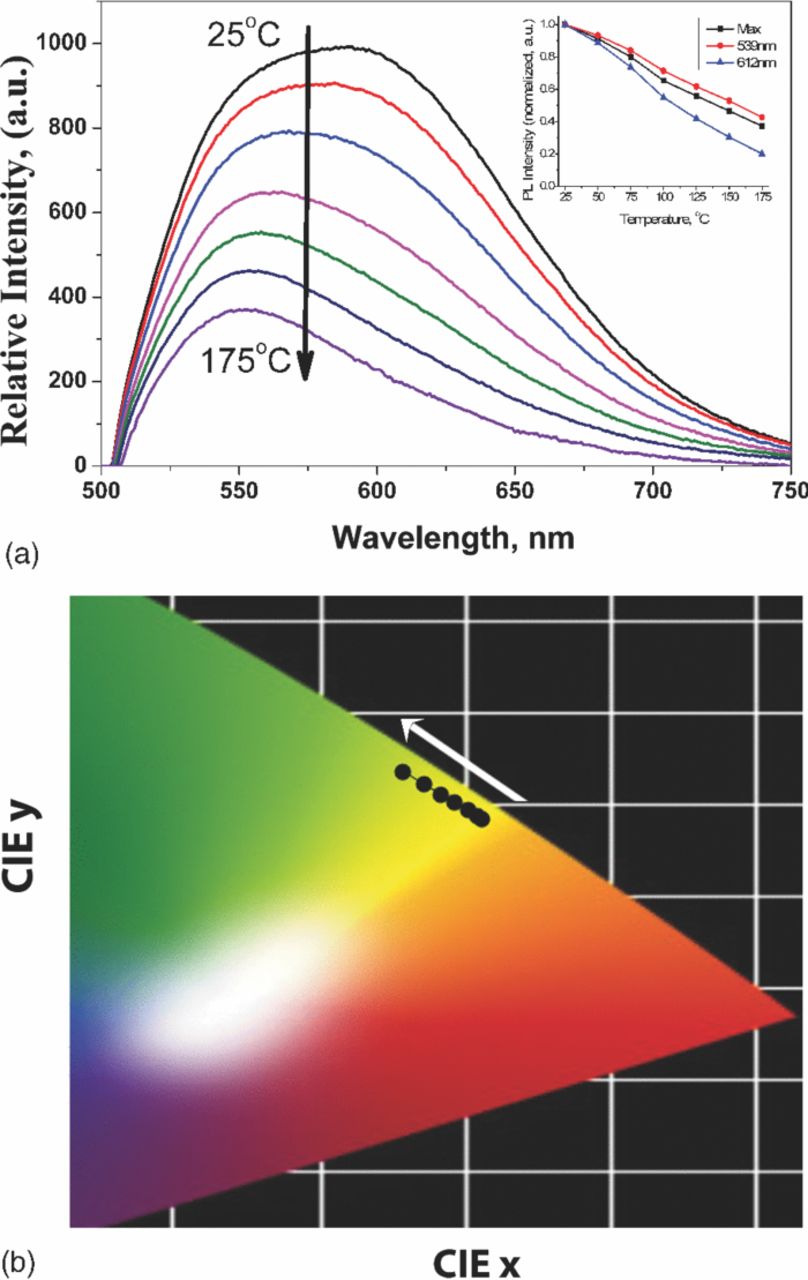
Figure 5. a) (Color online) PL emission spectra of 2 at% Eu2+ and 6 at% Yb2+ co-doped SrSi2O2N2 nitridosilicate phosphor depending on temperature. The inset shows emission intensities dependency from the temperature at maximum emission point, at 540 and 612 nm emissions. b) CIE coordinates depending on temperature.
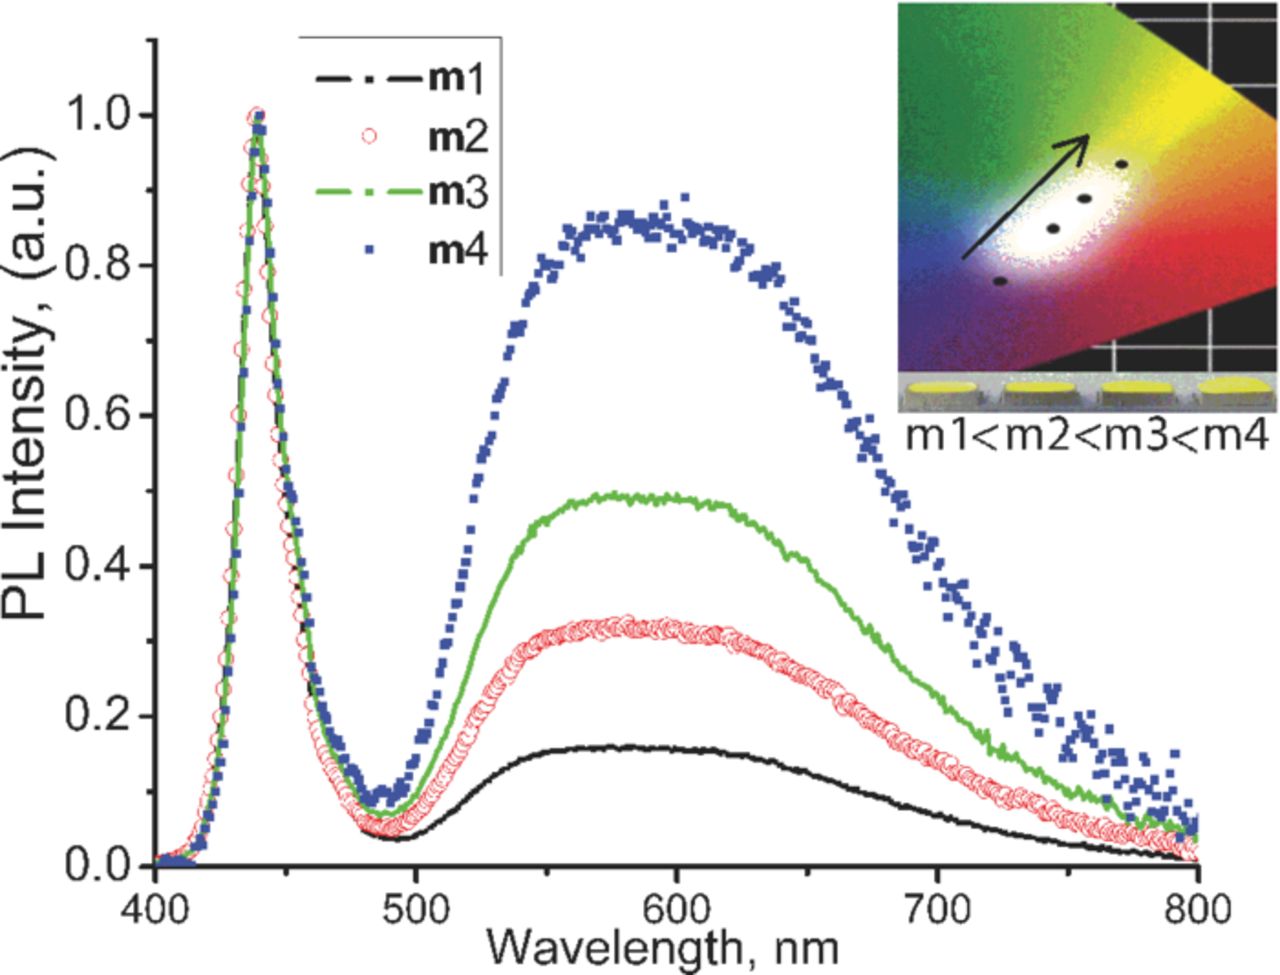
Figure 6. (Color online) Emission spectra of LEDs based on SrSi2O2N2:Eu2+Yb2+ (2 at% Eu2+ and 6 at% Yb2+) as a down-conversion phosphor and InGaN blue LED chip (λ = 450 nm). The spectra are normalized based on the blue emission. The amount of phosphor powder used in LED increases in m1 < m2 < m3 < m4 order. The inset shows the CIE chromaticity coordinates of LEDs and photo images of the prepared LED chips correspondingly.
After the fine tuning of the phosphor emission characteristics, and the amount of powder used in LED preparation, we could achieve up to Ra = 89 for the color rendering index of the as-prepared white LED. The high Ra has been achieved when the ratio of red to green component in LED spectrum is >1.25 Figure 7 shows the emission spectra of our LEDs based on utilization of further-optimized SrSi2O2N2:xEu2+,yYb2+ (x = 2 and y ≅ 5.5) as a down-conversion phosphor in combination with InGaN blue LED chip (λ = 450 nm). Table I summarizes full set of the general color rendering index Ra and 9 CRI of the prepared LED. As can be seen from the figure 7, by applying the forward-bias current from 100 to 500 mA at 3 V operating voltage the emission coming out from the prepared LED is getting intense. Figure 7 inset shows that the CIE chromaticity coordinate remains stable in wide range of forward-bias current. Table II summarizes the values of the color rendering index (CRI), color correlated temperature (Tcc), and CIE chromaticity coordinates.
Table I. Full set of the general color rendering index Ra and 9 CRI of the prepared LED.
| Ra | R(1) | R(2) | R(3) | R(4) | R(5) | R(6) | R(7) | R(8) | R(9) |
|---|---|---|---|---|---|---|---|---|---|
| 89 | 94 | 93 | 90 | 82 | 93 | 87 | 84 | 88 | 86 |
Table II. Effect of bias current on CIE coordinates, Tcc-color temperature and Ra-rendering index of LEDs based on SrSi2O2N2:Eu2+Yb2+ (2 at% Eu2+ and 5.5 at% Yb2+) as a down-conversion phosphor and InGaN blue LED chip (λ = 450 nm).
| Bias Current, mA | CIE x | CIE y | Tcc | Ra |
|---|---|---|---|---|
| 100 | 0.3699 | 0.2920 | 3425 | 89 |
| 200 | 0.3705 | 0.2937 | 3425 | 89 |
| 300 | 0.3702 | 0.2946 | 3485 | 89 |
| 400 | 0.3691 | 0.2944 | 3510 | 89 |
| 500 | 0.3682 | 0.2937 | 3534 | 89 |
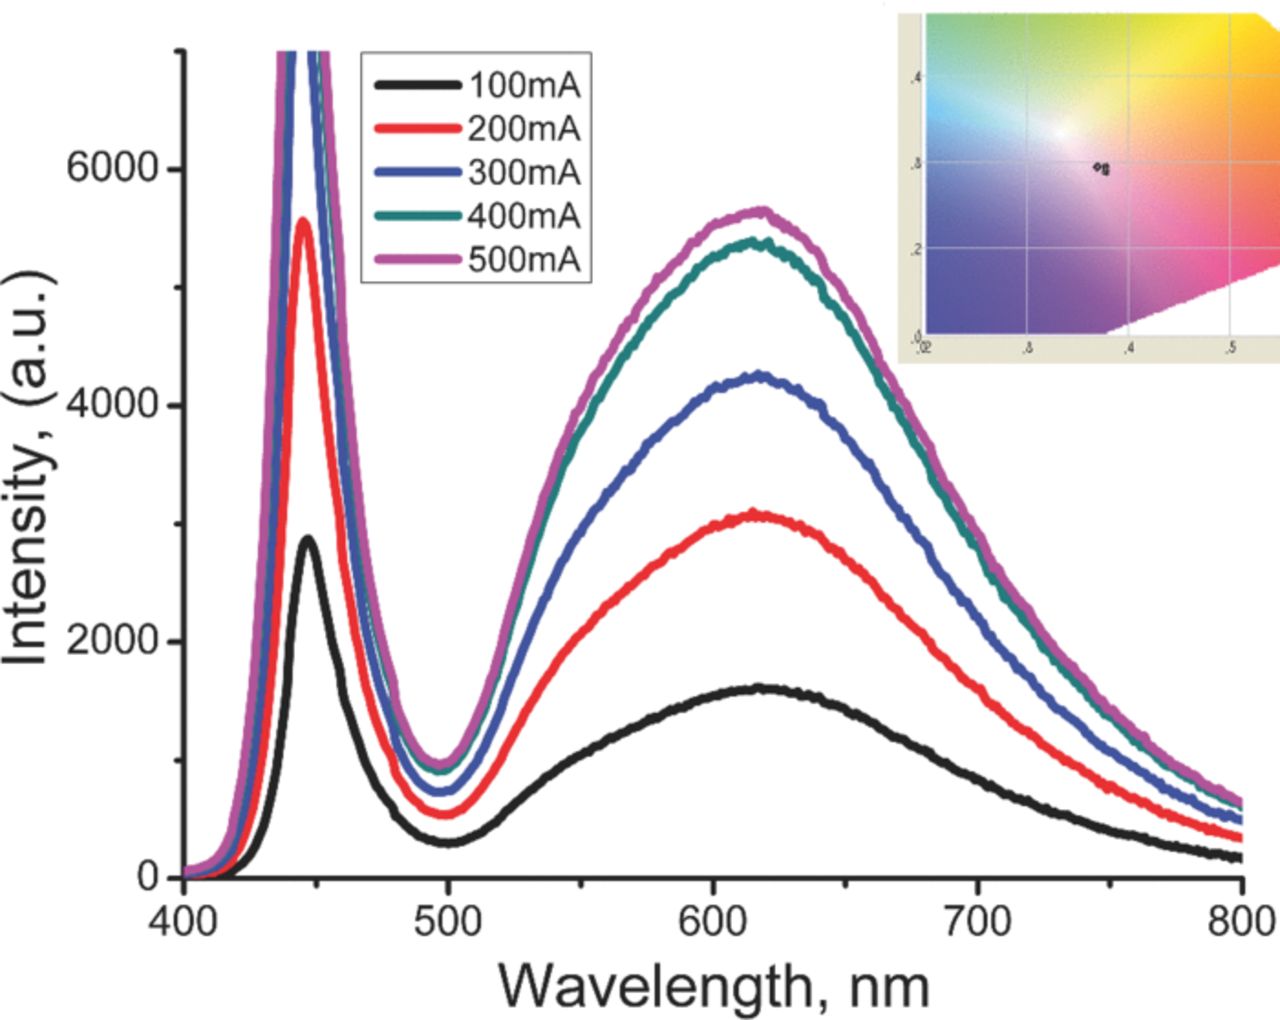
Figure 7. (Color online) Effect of bias current on Emission spectra of prepared LED based on SrSi2O2N2:Eu2+Yb2+ (2 at% Eu2+ and 5.5 at% Yb2+) as a down-conversion phosphor and InGaN blue LED chip (λ = 450 nm). The inset shows that the CIE chromaticity coordinates remain stable against bias current.
Conclusions
In conclusion, a double-color emitting SrSi2O2N2:Eu2+,Yb2+ oxynitridosilicate phosphor has been developed for singly used in a warm white LED for the first time. The obtained SrSi2O2N2:Eu2+,Yb2+ phosphor shows broad band emission centered at 540 and 612 nm for Eu2+ and Yb2+ ions respectively. The relative ratio of green and orange emissions was found to be dependent on the relative concentration of activator ions in the phosphor. Short decay time of Eu2+ emission confirmed the energy transfer from Eu2+ ion to Yb2+ trapping sites. The fabricated white LED, integrating 450 nm emitting InGaN chip with a double color emitting SrSi2O2N2:Eu2+,Yb2+ phosphor, shows warm white light, high color rendering index, and superior color stability against input power.
Acknowledgment
This work was supported by Components & Materials Technology Development program of Ministry of Knowledge Economy (project - 10036981) and BK21 Program.