Abstract
Electrochemical Impedance Spectroscopy (EIS) is a well-established technique for investigating the loss processes that take place in lithium-ion batteries with different characteristic time constants. Three-electrode setups are needed to separate the contributions of working electrode (WE) and counter electrode (CE), but often suffer from measurement artifacts. This paper is the second part of a two-part paper dealing with the roots of these distortions: (I) electrochemical and (II) geometric asymmetry. The first part presents a theoretical examination by FEM simulation and the second part details the corresponding real-world measurements. The simulation results were confirmed: electrochemical and geometric asymmetry lead to artifacts for point-like reference electrodes but not for mesh reference electrodes. The geometric characteristics of the mesh reference electrode are crucial (thin wire and an open weave are essential). Furthermore, a possible realization of a mesh reference electrode setup is presented, using an aluminum mesh coated with Li4Ti5O12 powder as reference electrode. This combination was then validated by additional measurements in symmetric cells. Additionally, the benefits of using the proposed setup for recording quasi-equilibrium potential curves and for performing rate capability experiments are demonstrated.
Export citation and abstract BibTeX RIS

This is an open access article distributed under the terms of the Creative Commons Attribution 4.0 License (CC BY, http://creativecommons.org/licenses/by/4.0/), which permits unrestricted reuse of the work in any medium, provided the original work is properly cited.
This Part II of the paper presents an experimental work, which validates the simulations of Part I. Part I presents the theory and results of FEM simulations on three-electrode cells, where the working electrode (WE), counter electrode (CE) and reference electrode (RE) differ by geometric characteristics and placement.
Lithium-ion batteries receive ever-growing attention due to their potentially high energy and power densities, which would be essential for automotive applications. Electrodes with improved energy density are needed to increase vehicle ranges, but in practice only those with long lifetimes, good rate capability and a high safety level will be selected. Candidate materials are usually assessed by a combination of different electrochemical measurements, including capacity tests and impedance measurements.
Electrochemical Impedance Spectroscopy (EIS) is well established for identifying dominant loss processes in electrodes, and across different time-scales.1 Such studies are usually performed in half-cell setups, using lithium metal as the counter electrode.2 However, this type of counter electrode often dominates the sum of impedance contributions and adds a stochastic component to the measurement data.3,4 To investigate the working electrode (WE) without influences from the counter electrode (CE), a three-electrode setup is necessary. This means that a third "reference" electrode (RE) is inserted into the cell, providing a constant reference potential by ensuring a constant lithium-ion activity. The setups for such measurements can be challenging and often lead to measurement errors. Several groups have already detected these errors and some possible solutions have been proposed to minimize measurement artifacts in three-electrode setups.5–10 Approaches with different materials, such as pure lithium metal7,8 or lithium iron phosphate,11 as well as with different geometries, mostly point-5 or ring-shaped,8 have previously been reported in literature. La Mantia et al.12 very recently presented a promising novel setup using an LFP-coated stainless steel mesh. A detailed discussion of the various approaches published, thereby considering their advantages and drawbacks, can be found in part I.
While the first part investigated the roots of measurement artifacts in three-electrode setups by using FEM simulations, this second part covers the topic of the corresponding laboratory measurements.
In Part I, two fundamental effects were found to cause distortions and artifacts in half-cell impedance spectra: Firstly, the effects of geometric asymmetry, which can result from different sizes of working and counter electrode or a shift of the electrodes relative to each other. Secondly, the effects of electrochemical asymmetry, which means that the working and counter electrodes experience different loss processes (polarization resistance and/or characteristic frequency). Both effects are usually unavoidable in real measurement setups: geometric asymmetry is almost always present, especially for measurements with a lithium metal electrode which is often punched to have a slightly smaller diameter. This enables an easier assembly of the cell due to the ductile and sticky nature of metallic lithium. Additionally, a minimal shift is hardly avoidable during the assembly inside the glove box. Electrochemical asymmetry always occurs in real cells, since their working and counter electrodes are non-identical (except for symmetric cells, which cannot be cycled). The results of Part I indicate that both types of asymmetry effects cause spectrum artifacts. The geometry of the reference electrode is a crucial factor in the appearance of artifacts. Three different geometries were investigated by FEM simulations in Part I: point-like, wire and mesh reference electrodes. For a point-like reference electrode, the effects show strong impacts and cause large artifacts. For wire and mesh geometries the effects can be considerably decreased, or negligible.
The simulation results are verified in this part of the paper (Part II) by measurements on two of the setups: The point-like reference electrode geometry which is the most commonly used setup and at the same time provides the most defective results, and the mesh reference electrode geometry which provides the best results. Furthermore, the mesh reference electrode setup is easier to assemble than a wire reference electrode and yields also more reproducible results.
For the point-like reference electrode, a commercial housing is available from EL-Cell called ECC-Ref. 13. This housing can be adapted with some effort for the application of a wire or mesh reference electrode. But the assembly is very time consuming and circuitous, as the housing is not constructed for these types of reference electrodes. You would have to prepare and coat a mesh with a diameter of 18 mm, then spot-weld a thin wire to the mesh and thread this wire through the hole of the cell's insulation sleeve, originally conceived for the point-like reference electrode. Furthermore, a wire reference leads to additional difficulties such as inhomogeneous compression of the separator and irreproducible alignment of the wire between the electrodes. Consequently, Part II focuses on only two of the three geometries for validating the basic findings of the simulations in Part I.
The point-like reference electrode geometry is realized in the ECC-Ref housing from EL-Cell13 with a lithium metal reference electrode. The mesh geometry is assembled in an in-house developed cell housing. Due to the soft nature of lithium metal, no metallic lithium meshes can be manufactured. Coating of a metallic copper or nickel mesh by electrodeposition leads also to problems since the lithium grows in a dendritic manner and not as a homogeneous and dense layer. Therefore, we decided to coat a metallic mesh with an active material that provides a stable potential in the commonly used electrolytes. Many uncoated mesh gauges are available on the market. We chose an aluminum mesh with a wire thickness of 50 μm and mesh size of 75 μm and used a coating of lithium titanium oxide (Li4Ti5O12 (LTO)), which- due to its two-phase lithiation behavior-, provides a stable potential of 1.56 V versus Lithium and can thus serve as a Reference 11. The suitability of this LTO-coated aluminum mesh as a reference electrode was evaluated with additional measurements which considered the stability of its potential and the influence of the mesh impedance on the measured half-cell impedance. These confirmed the results of the FEM simulations in Part I. Furthermore, the newly proposed three-electrode setup with LTO-coated aluminum mesh as reference electrode has been validated by additional measurements in symmetric cells (two identical electrodes).
It is worth noticing, that EL-Cell recently presented another new geometry applying a ring-shaped reference electrode setup with small lithium reservoirs along a steel ring (PAT series).13 This setup has the advantage that it can work with just one Viledon FS 3005–25 separator, which is a promising approach and will be subject of future work. A review of alternative approaches and their pros and cons is given in the introduction of Part I.
Experimental
EIS was performed using a multichannel 1470E cell-test system (Solartron) with Multistat software (Scribner). All measurements were performed in climate chambers (Weiss WK1180, Vötsch VT4002) in order to guarantee a stable temperature of 25°C. Impedance spectra were measured between 1 MHz and 100 mHz.
Two different three-electrode setups were compared to investigate the influence of reference electrode geometry and materials on the EIS results.
Setup A applies a point-like lithium-metal reference electrode, assembled in the ECC-Ref housing from EL-Cell.13 The reference electrode is placed at the rim of the separator.
Setup B is an in-house developed experimental cell housing, containing an aluminum mesh coated with Li4Ti5O12 (LTO) powder as reference electrode.
For both setups, a NMC (LiNi0.6Mn0.2Co0.2O2) cathode was chosen as the working electrode, (6.8 mAh/cm2, Umicore) and cut to a diameter of 18mm. This working electrode was chosen because of its high reproducibility in microstructure characteristics and impedance measurements.
A lithium metal foil (Sigma Aldrich, thickness: 0.38 mm) was used as the counter electrode and cut to a diameter of 17.5 mm. Due to its sticky nature, the lithium metal was punched with a slightly smaller diameter than the working electrode and separator (both with a diameter of 18 mm) to enable easier assembly and to reduce the risk of internal short circuits. The electrolyte is based on an EC:DMC (1:1) solvent mixture and contains 1 M LiPF6 as the conducting salt.
The cell assembly and preparation were carried out in an argon atmosphere, ensuring oxygen and water contents below 0.1 ppm (MBraun glove box). Before performing the impedance measurements the cell was cycled five times with a C/5 current to ensure complete cathode formation.
Setup A – lithium point-like reference electrode
In setup A (Figure 1), the point-like lithium reference is placed at the rim of the glass fiber separator (diameter: 18 mm, thickness: 1.55 mm). Figure 2a shows the experimental cell housing from El-Cell. The lithium metal is pressed into the sleeve before assembly (Figure 2b) and contacted by the contact pin.
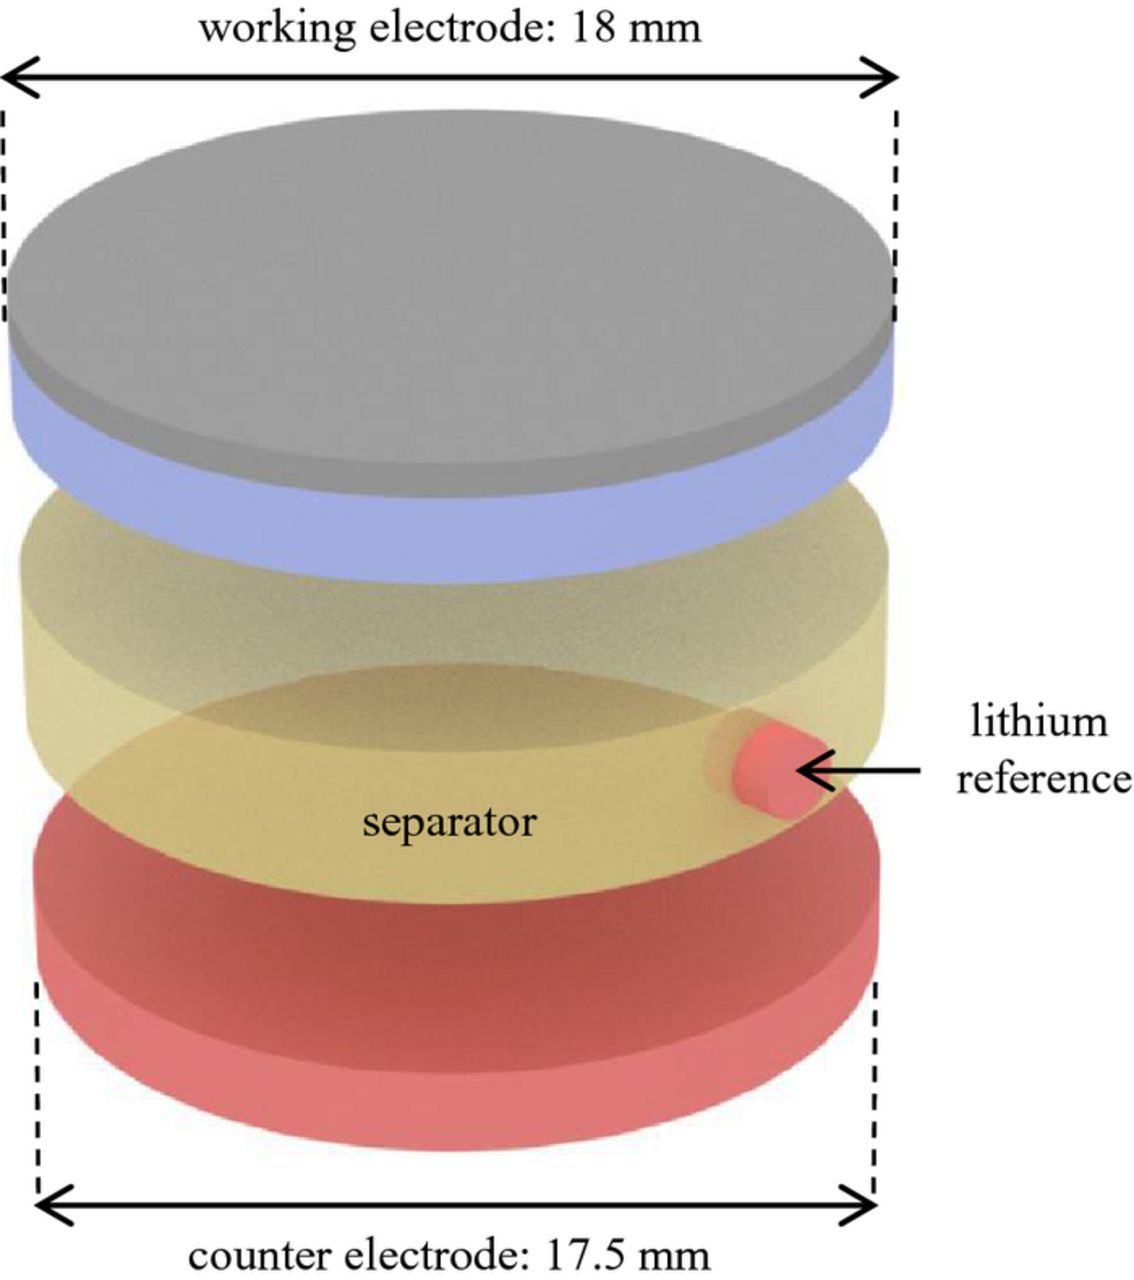
Figure 1. Visualization of setup A – a point-like lithium reference electrode, employed in a cell with a NMC working electrode of 18 mm, a glass fiber separator of 18 mm and 1.55 mm thickness, and a lithium metal counter electrode of 17.5 mm.
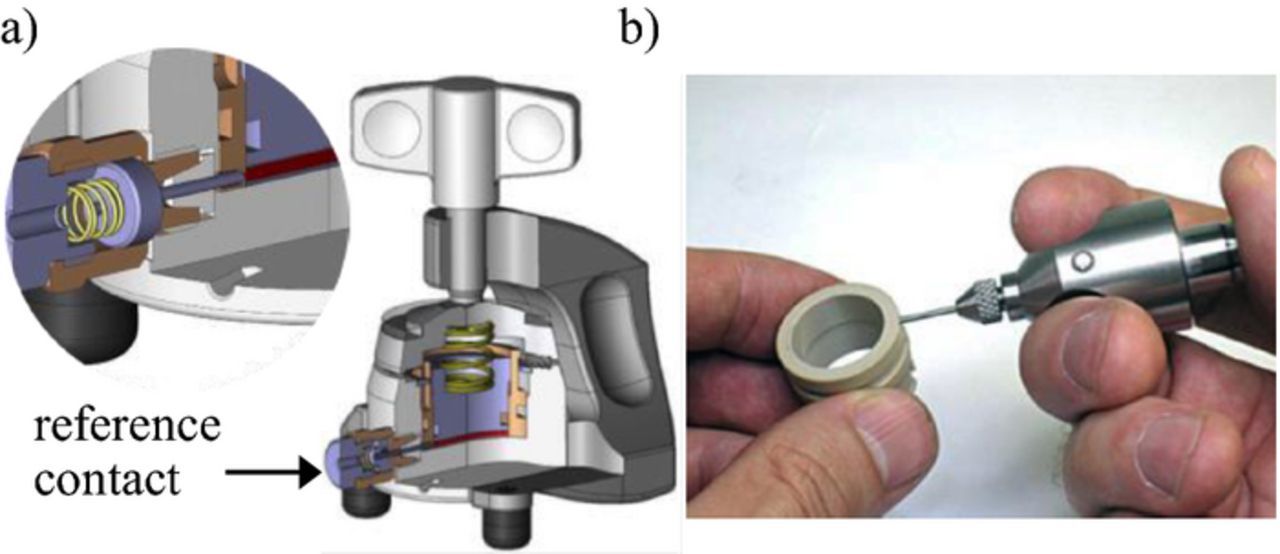
Figure 2. a) Experimental cell housing from EL-Cell for using a point-like lithium reference electrode. b) The lithium metal is pressed into the sleeve.
Setup B – mesh reference electrode (Li4Ti5O12 (LTO) powder coated aluminum mesh)
In setup B, an Li4Ti5O12 (LTO)-coated aluminum mesh is used as reference electrode, offering two beneficial properties: the mesh geometry is minimizing displacement artifacts and the LTO provides a durable, highly stable reference potential. Figure 3 shows the LTO-coated aluminum mesh sandwiched by two separators, between the working and counter electrode. The glass fiber separators are 18 mm in diameter with a thickness of 220 μm. The mesh is cut to 21 mm; this larger diameter is necessary for contacting the reference electrode without short-circuiting. Notice that only 18 mm in diameter of the mesh are in contact with the electrolyte.
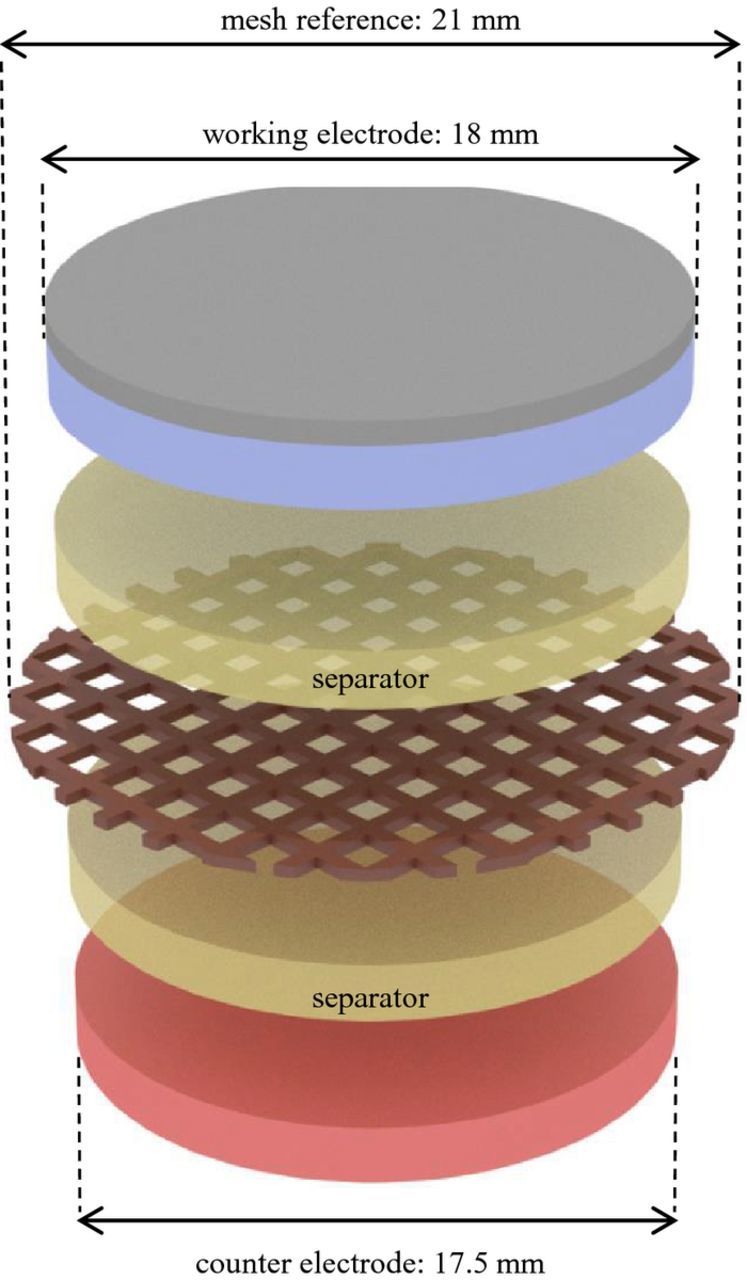
Figure 3. Visualization of setup B – an aluminum mesh with a diameter of 21 mm is coated with LTO powder as reference electrode, placed between two glass fiber separators of 18 mm and a thickness of 220 μm each with a NMC working electrode of 18 mm and a lithium metal counter electrode of 17.5 mm.
Figure 4 shows the in-house developed experimental cell housing. The components are easy to assemble and the design accommodates different thicknesses of electrodes and separators. The reference electrode is always aligned in exact symmetry between the working and the counter electrode fixed by the sleeve, which enables reproducible measurements. The housing is four-point-contacted at the bottom and top for counter and working electrode, while the voltage of the reference electrode can be measured at the center contact. The contacts (bottom, top and reference) are made of stainless steel while the sleeve and middle-section are made of PEEK (Polyetheretherketone).
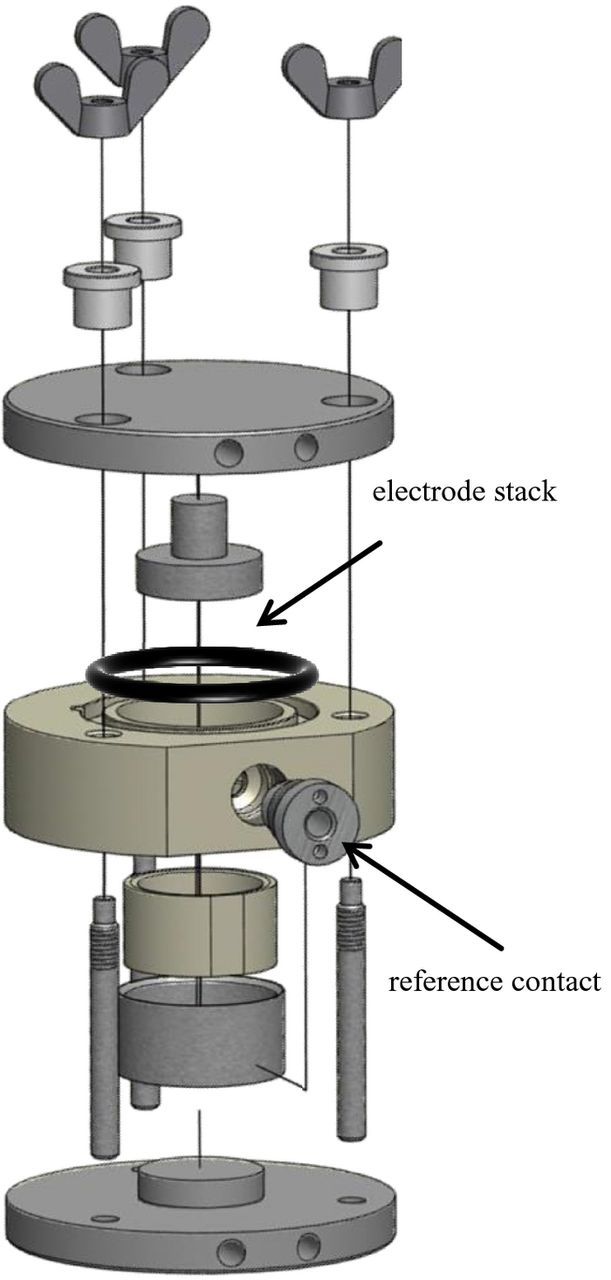
Figure 4. In-house developed experimental cell housing for setup B, where a mesh reference electrode is placed between two separators. The voltage of the reference electrode is measured at the center reference contact, while counter and working electrode have four-point-contacts at the bottom and top.
Preparation of a Li4Ti5O12(LTO)-coated aluminum mesh as reference electrode
The aluminum mesh was coated with Li4Ti5O12 (LTO) before cell assembly. To coat the mesh, we mixed 85% fine-grained LTO powder (TOHO Titanium LT131201) with 10% water-based binder powder (MTI Corporation, EQ-Lib-520L) and 5% carbon black (TIMCAL C-NERGY SUPER C45) and dissolved this mixture in H2O (LTO:H2O 3:1). Before coating, the aluminum mesh was etched for 6 s in fuming hydrochloride acid (37%) for removing the aluminum oxide, which arises in contact with air and afterwards cleaned by isopropanol. The aluminum mesh was than dip-coated with the slurry (Figure 5a). Finally, the coated meshes were vacuum dried at 120°C for three hours for ensuring a stable binder matrix without residual solvents. These preparation parameters were found to be adequate, as they provide reproducible results and a long-term stable potential of the reference electrode, as demonstrated in the 3.2
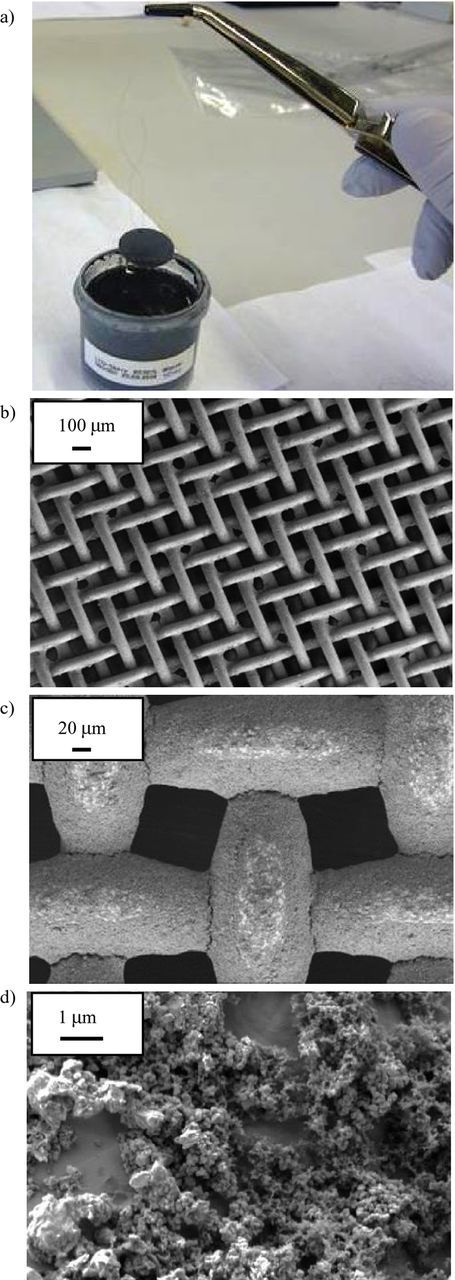
Figure 5. Preparation of a Li4Ti5O12 (LTO)-coated aluminum mesh: a) the aluminum mesh is dip-coated with the LTO slurry and dried in vacuum at 120°C for three hours b-d) SEM-images of LTO-coated aluminum mesh at different magnification, showing a homogenous thin coverage of the mesh structure.
SEM micrographs of the LTO-coated aluminum meshes are shown in Figures 5b–5d at different magnifications. Before conducting impedance measurements one should ensure stable potentials by lithiating the LTO using a low current (0.05 mA versus the lithium metal counter electrode). A capacity of 275 μAh was "charged" into the LTO-coated aluminum mesh (Figure 6). Finally, the coated mesh was used as reference electrode in the three-electrode setup.
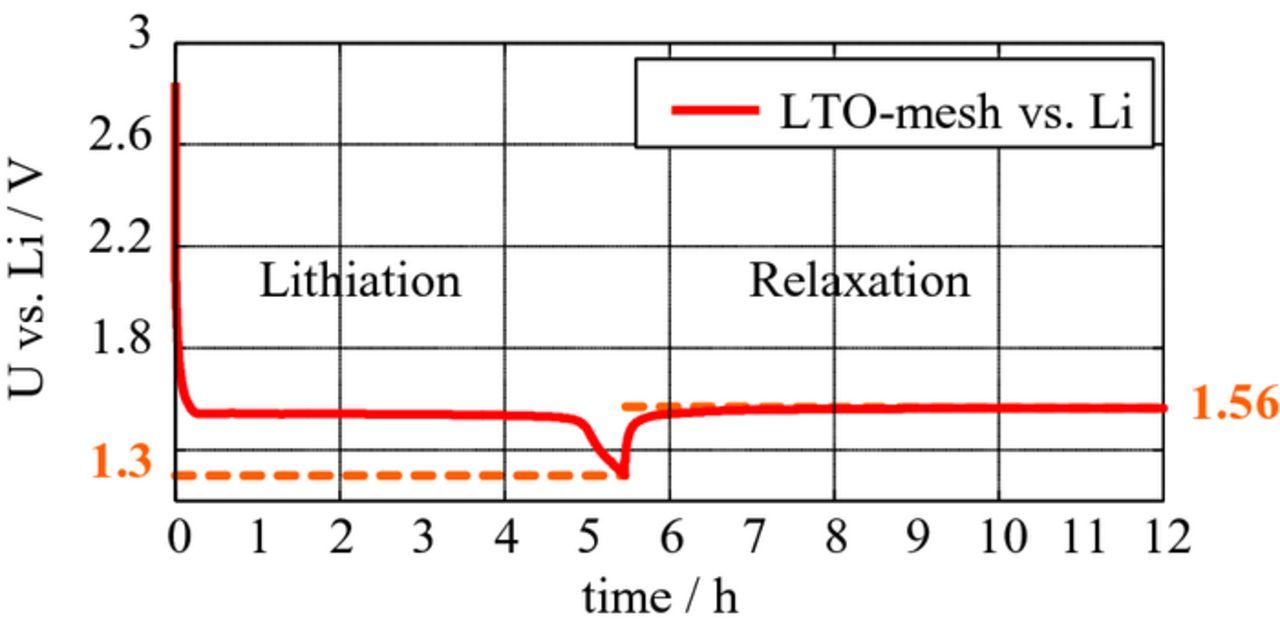
Figure 6. Voltage of LTO versus lithium metal during lithiation: A small current of 0.05 mA was applied until the cutoff voltage (1.3 V) was reached. The subsequent relaxation demonstrates a steady potential of 1.56 V versus lithium metal.
Results
Experimental investigation of different reference electrode designs
In Part I, two basic mechanisms potentially leading to artifacts in impedance measurements were identified. The first mechanism is called geometric asymmetry: different sizes of working and counter electrode, leading to a radial current flux.
The second mechanism originates from an electrochemical asymmetry, since the working and counter electrodes in a real electrochemical system (full-cell) show differing loss processes (different polarizations and characteristic time constants). This causes a frequency-dependent inhomogeneity of the current density at the location of the reference electrode.
Both mechanisms occur in the setups investigated in this study, two different electrodes are chosen and are then cut to different diameters. Therefore, the effects of the mechanisms which were theoretically investigated in Part I can now be examined regarding the most suitable reference electrode design. In this section geometry and material choices will be discussed.
Setup A –point-like lithium reference electrode
Figure 7 shows an impedance spectrum measured in setup A (lithium point-like reference electrode) at SOC 80 and a temperature of 25°C.
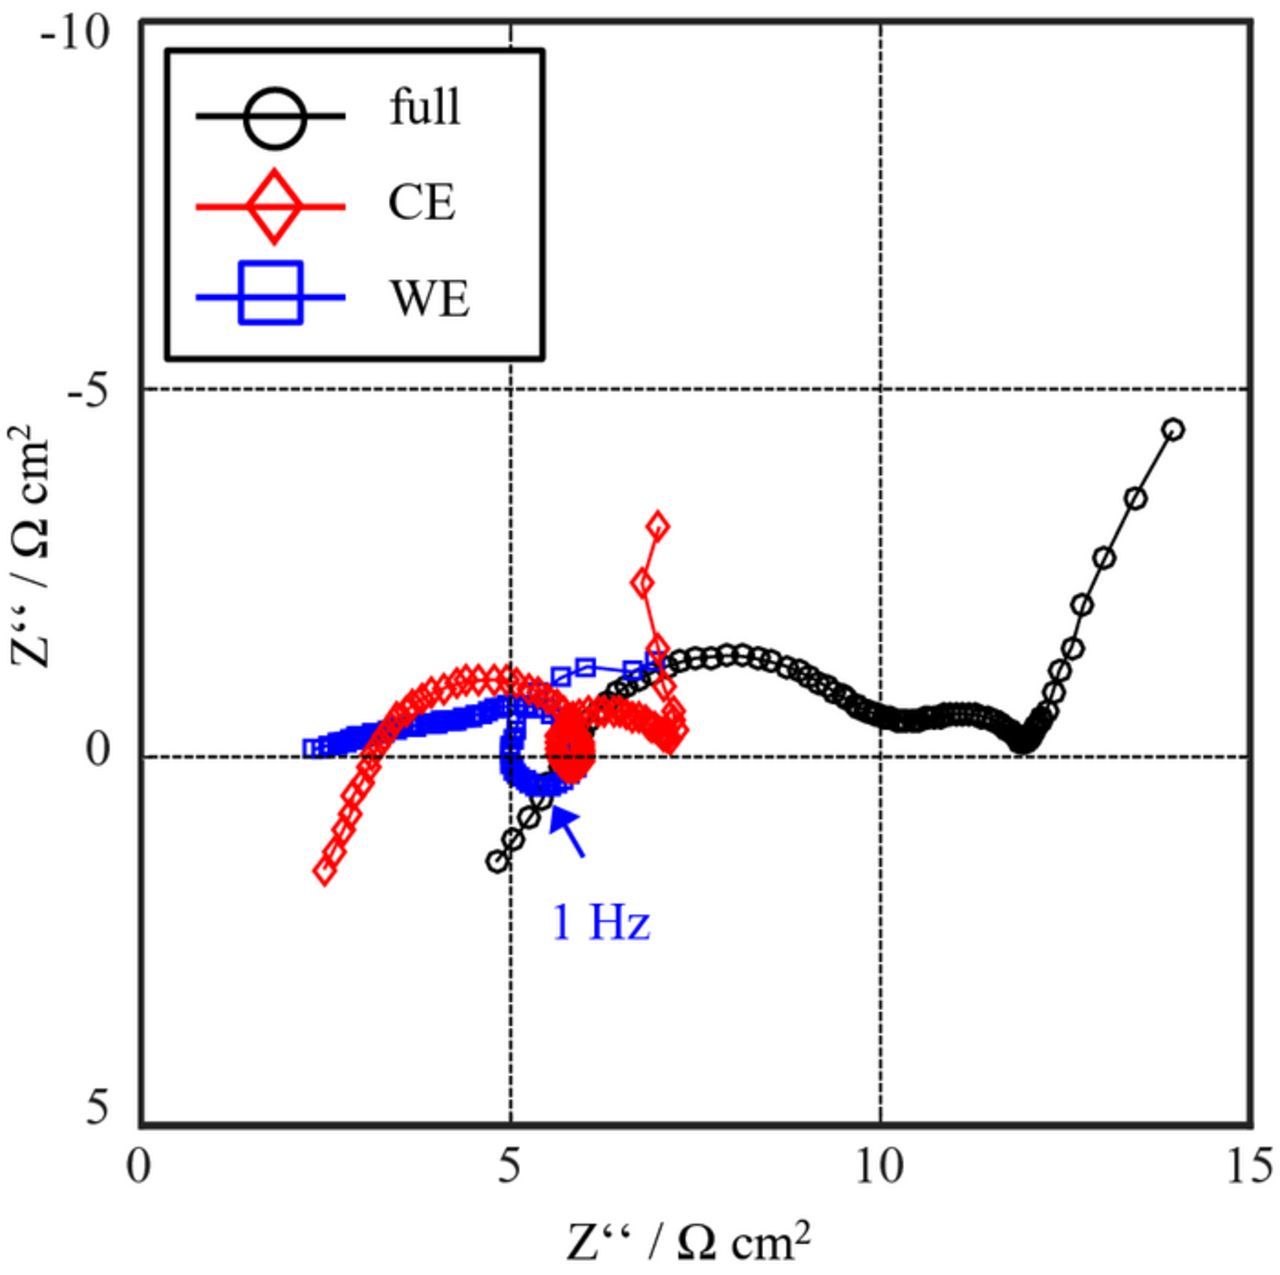
Figure 7. EIS measurement of setup A (point-like lithium reference electrode) at SOC80 and 25°C.
The half-cell impedances of WE and CE measured versus the point-like reference electrode exhibit significant artifacts. The impedance of WE features a loop, which is a clear indicator of erroneous measurements.
The reason for these artifacts can be fully explained by the findings from Part I. The first cause is the geometric asymmetry, since the counter electrode is 0.5 mm smaller than the working electrode, which leads to an inhomogeneous current density in the electrolyte.
The second cause is the electrochemical asymmetry, which means that the working and counter electrodes provide different polarization resistances and time constants. This causes a frequency-dependent inhomogeneity of the current distribution in the electrolyte.
Both error sources (the electrochemical and geometric asymmetries) occur in our measurement setup. Consequently, a combination of both effects causes the large artifacts in the spectrum shown in Figure 7; as a result the point-like reference electrode measures an incorrect reference potential at non-open-circuit conditions.
The simulation results from the first part (Figure 4 in Part I) clearly show that the artifacts observed in Figure 7 are dependent on the position and geometry of the reference electrode. Therefore, the next experiment investigates setup B, with mesh geometry as reference electrode.
Setup B – mesh reference electrode (Li4Ti5O12 (LTO)-coated aluminum mesh)
Figure 8 shows an impedance spectrum measured in setup B (LTO-coated aluminum mesh) at SOC 80 and 25°C. In contrast to the measurement of setup A, the spectra do not feature any loops or evident artifacts.
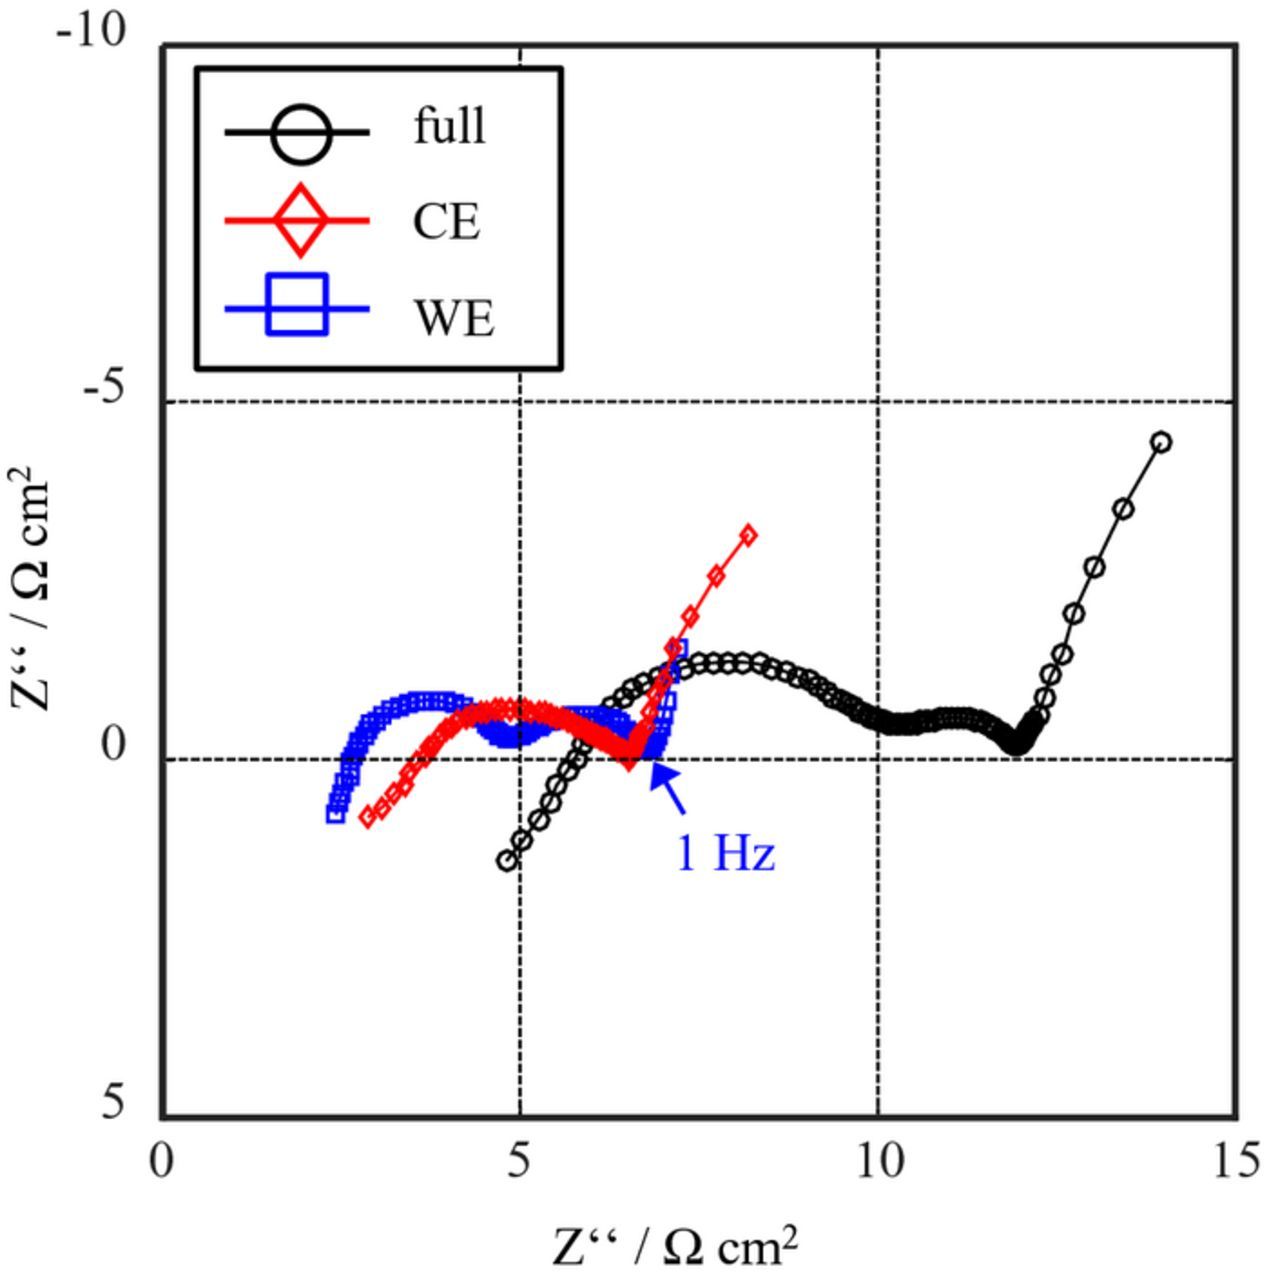
Figure 8. EIS measurement of setup B (LTO-coated aluminum mesh as reference electrode) at SOC80 and 25°C.
A validation of setup B was conducted by additional symmetric cell measurements. A symmetric cell was assembled with two cathodes, which were previously charged to SOC 80. The cathode impedance was obtained by dividing the spectrum of the symmetric cell by two and correcting the difference of the ohmic resistance due to different thicknesses of the separators. The results were compared to the cathode impedance measured in setup B versus the LTO-coated aluminum mesh reference (Figure 9). As the setups contain different separators (1.55 mm between the two cathodes in symmetric cell and 220 μm between reference electrode and cathode in setup B), the ohmic resistance of the electrolyte, as well as the salt concentration in the electrolyte at the location of the cathode differ. While the effect of the different ohmic resistances can be easily corrected (as described above), the latter effect of the electrolyte salt concentration profile is affecting the characteristics of the cathode impedance spectrum at low frequencies (f < 1 Hz). The time constant can be estimated based on the electrolyte salt diffusivity (3.5 · 10− 10 m2/s) and the transport length (220 μm for the thinner separator, neglecting porosity and tortuosity effects) to be in the order of 138 s.14 Consequently, the measurements are only compared up to a minimum frequency of 1 Hz.
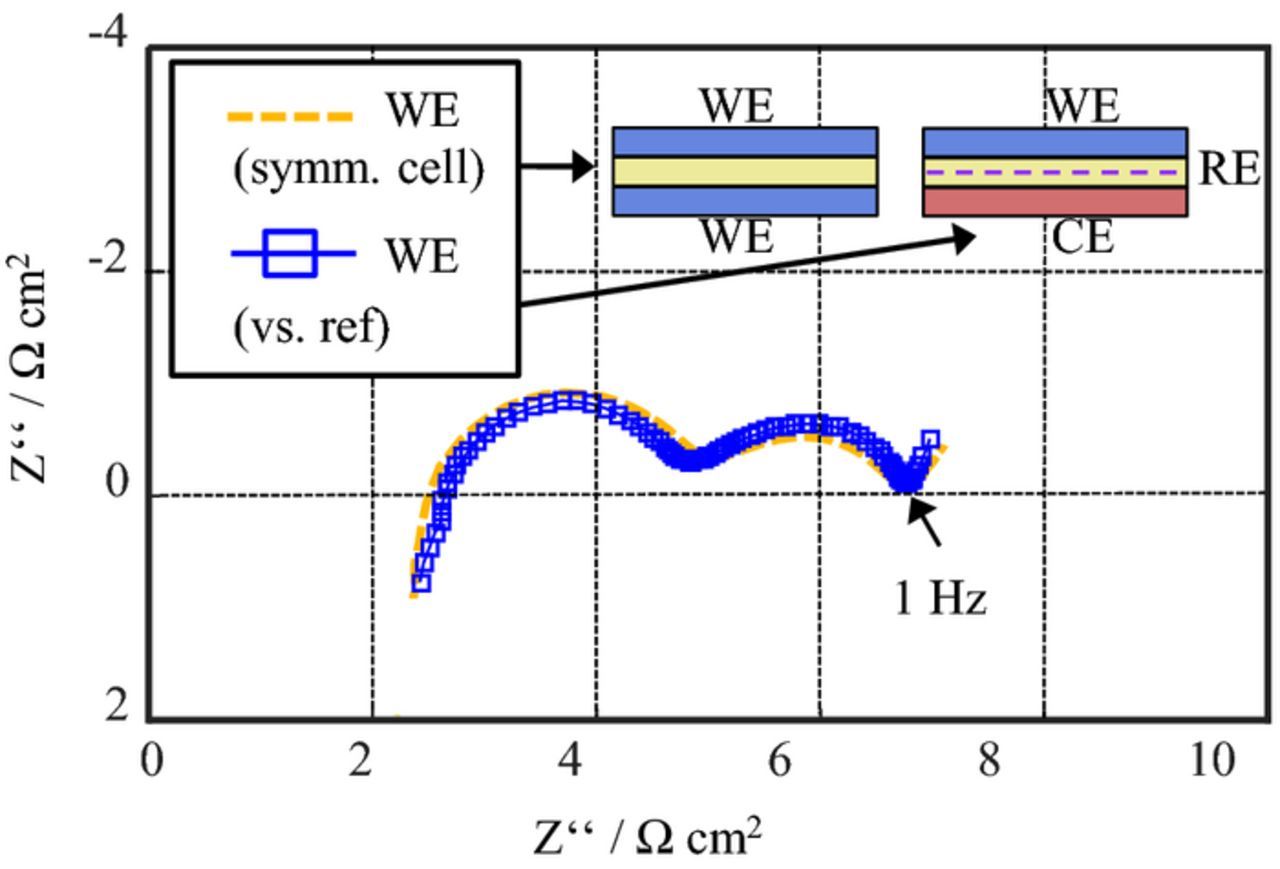
Figure 9. Comparison of cathode impedance measured in Setup B (WE versus reference electrode) and in a symmetric cell at SOC 80.
Overall, Figure 9 shows a good agreement of both spectra, which validates the suitability of the setup for accurate measurements. It only shows small deviations, which are probably caused by a slight SOC mismatch.
While electrical and geometric asymmetries are still present in the setup, they do not falsify the measurement results, as it was the case for point-like reference electrodes. In Part I FEM simulations showed that the impedance distortions caused by asymmetries are negligible for mesh reference electrodes. This is because the mesh mainly measures the potential between the electrodes, where the current distribution is homogenous. Furthermore, the electrolyte does not exceed the two electrodes, although the reference electrode mesh is larger (21 mm) than the electrodes (WE: 18 mm CE: 17.5 mm), as the separators soaked with the electrolyte on both sides of the mesh are only 18 mm in diameter. This is important for accurate measurements, as was shown in Part I.
These measurements confirm the findings based on the FEM simulations in Part I.
Choice of reference electrode material and dimensions
The task of a reference electrode is to provide a stable and well-known potential as a reference, so the main requirement on its material is a stable potential over a long time-period. This can be realized in two ways. One possibility is to choose bare lithium metal as reference electrode. Since this is not always feasible (lithium metal is not malleable as a mesh) a second possibility is to choose a two phase system, e.g. Li4Ti5O1211 or LiFePO4,15 which provides a stable potential over a wide SOC range. For this study we chose LTO and applied it as a coating on an aluminum mesh. The long-term stability of the potential of such a reference electrode was investigated by lithiating a LTO-coated aluminum mesh and recording its voltage versus lithium metal over time.
Figure 10 demonstrates that the LTO-coated aluminum mesh provides a stable potential of 1.56 V over a very long time period (70 days), thereby fulfilling the main material requirement.
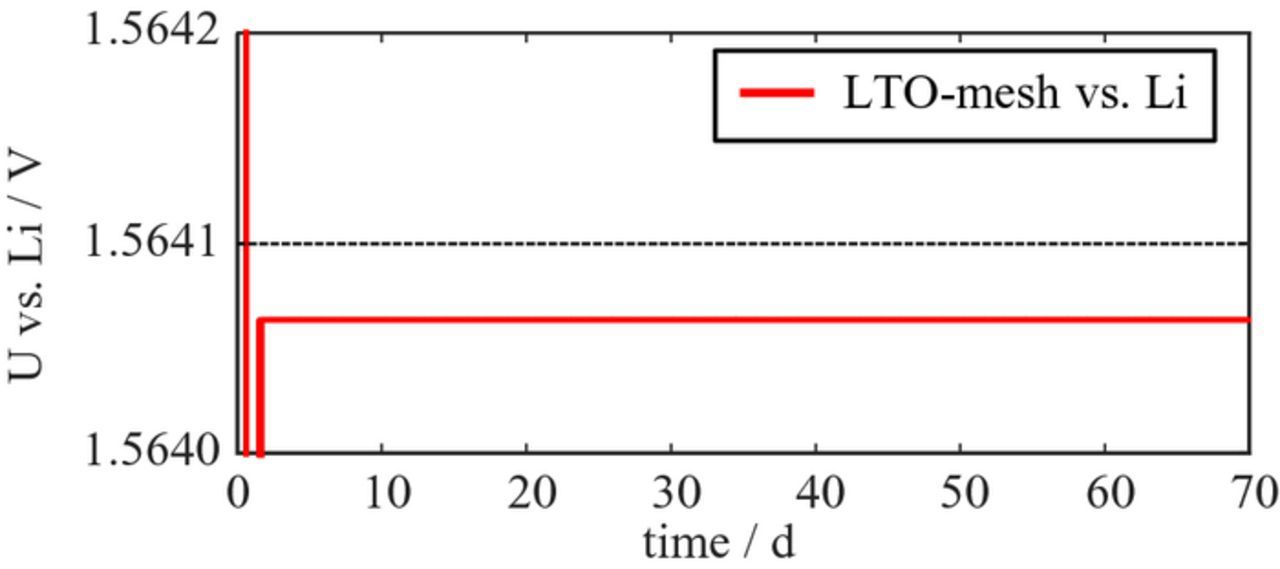
Figure 10. Potential of LTO-coated aluminum mesh (after initial lithiation) versus lithium metal over 70 days.
Another important aspect is the reference electrode impedance, which is strongly affected by the mesh geometry (see also Part I). The large input impedance of the measuring instrument is able to prevent a current flow through the reference electrode, not, however, a current flow by an oxidation at one side and reduction at the other. This becomes relevant only in the case of a mesh geometry as the point-like reference electrode offers only a very small surface area for in- and outflow and thus exhibits a large impedance.
The impedance contribution of the mesh reference electrode is caused by the coexistence of two current paths. The ions can either diffuse and migrate through the electrolyte in the mesh openings, or they can participate in charge transfer reactions on both sides of the mesh, which are coupled by the electronic conductivity of the mesh.
The impedance of the reference mesh (resulting from the two parallel paths) was determined in Part I to be:
![Equation ([1])](https://content.cld.iop.org/journals/1945-7111/164/2/A80/revision1/d0001.gif)
The assumption for this is that the electronic conductivity of the mesh is much higher than the electrolyte conductivity. RCT is the charge transfer resistance of the mesh (sum of upper and lower sides of the mesh) which is assumed to show the behavior of an RC element, while τ is its characteristic time constant. REL is the impedance contribution of the electrolyte within the mesh openings. In the second form of the equation one can see that it still represents a RC element.
The values for the charge transfer resistance RCT and the time constant τ of the mesh are determined by symmetrical cell measurements, consisting of two LTO-coated aluminum meshes which were previously lithiated (Figure 11). The parameters for the sum of upper and lower sides of the mesh are determined as:
![Equation ([2])](https://content.cld.iop.org/journals/1945-7111/164/2/A80/revision1/d0002.gif)
![Equation ([3])](https://content.cld.iop.org/journals/1945-7111/164/2/A80/revision1/d0003.gif)
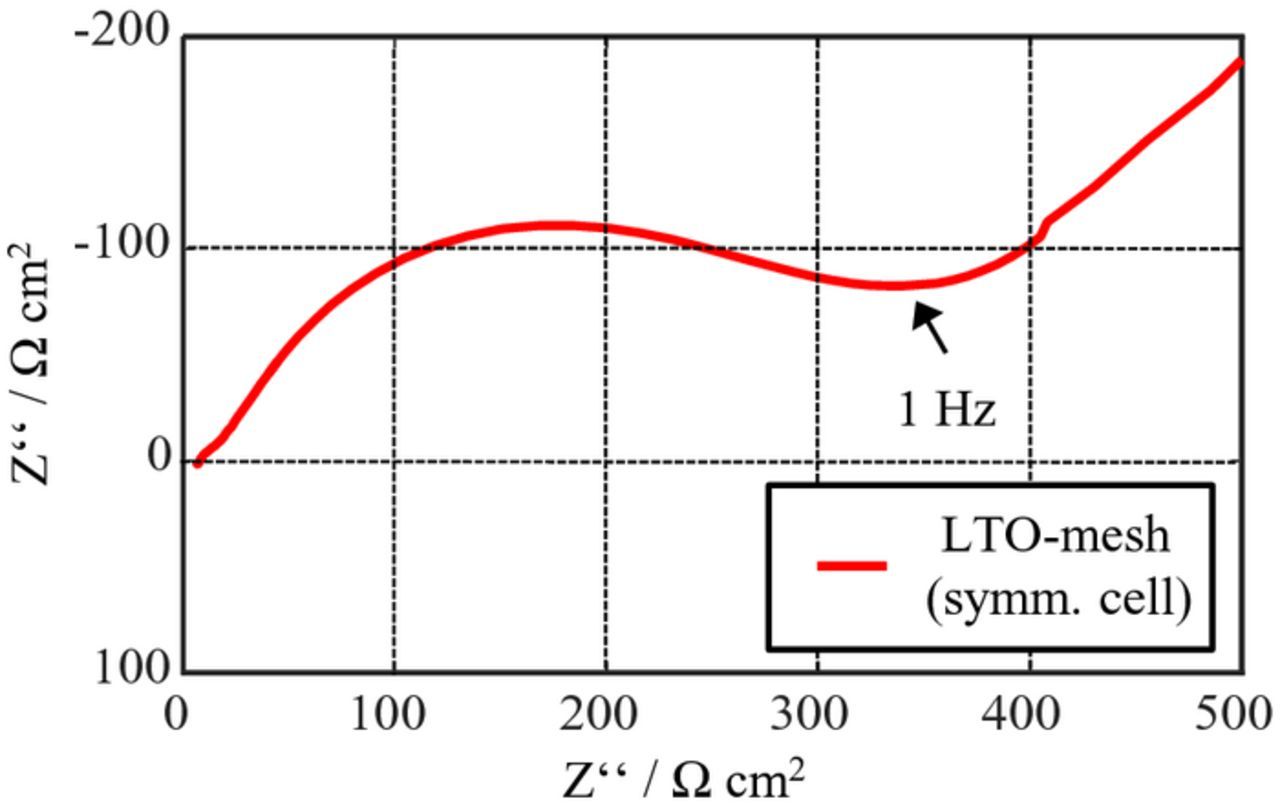
Figure 11. Impedance of an LTO-coated aluminum mesh measured in a symmetric cell. The impedance of two meshes is shown, which corresponds to the impedance of the lower and upper sides of a single mesh.
The impedance contribution of the electrolyte can be calculated with a mesh thickness of 100 μm and 56% open area as:
![Equation ([4])](https://content.cld.iop.org/journals/1945-7111/164/2/A80/revision1/d0004.gif)
(with l = 100 μm; A = 1.94 cm2, σ = 1.2 S/m).
With these values the impedance of the additional polarization process caused by the two parallel current paths can be determined to:
![Equation ([5])](https://content.cld.iop.org/journals/1945-7111/164/2/A80/revision1/d0005.gif)
Consequently, the polarization of the additional process is very small with 0.43 Ω. The characteristic time constant of the process is determined to 1.7 · 105 s, corresponding to a frequency of 9 · 103Hz. This frequency is within the investigated frequency range and therefore could have an influence on the measurement results. In our case, based on the simulations in Part I, the maximum contribution to a half-cell impedance from the reference electrode would be 0.215 Ω. Compared to the polarization resistance of the cathode of about 5 Ω the possible contribution is small. However, it might be necessary to consider it if the high-frequency part of the spectrum is interpreted. In other cases it could distort results, especially for electrodes with lower impedances.
It would therefore be necessary to increase the characteristic frequency of the mesh impedance or to decrease the polarization, which can be done by reducing the electrolyte resistance REL or by increasing the charge transfer resistance RCT of the mesh. Both results can be achieved by increasing the size of the mesh openings and reducing the thickness of the wires.
These results confirm the simulation results of Part I, which indicate that a thin and sparse mesh geometry provides better results with smaller artifacts compared to a thick and dense mesh.
Mesh reference electrode for non-equilibrium measurements
Until now, the suitability of a mesh reference electrode has only been discussed for application in electrochemical impedance spectroscopy. In the following section, its benefits in non-equilibrium measurements such as quasi-OCV curves and C-rate tests will be discussed.
Quasi-OCV curves
Since obtaining a true OCV potential curve from relaxation measurements is a very time consuming method, quasi- or close-to-equilibrium measurements are commonly used instead. In such a measurement, the electrode of interest is assembled in a half-cell with a lithium metal counter electrode and continuously discharged using a very small current (e.g. C/10), assuming that the overvoltages due to polarization effects can be neglected.
To demonstrate the benefit of a reference electrode and to validate the presented setup in such a measurement, a LiFePO4-cathode was assembled in a three-electrode setup with a lithium metal counter electrode and a LTO-coated aluminum mesh as reference electrode. The cell was cycled using a current of C/20. Both, the full-cell and the half-cell voltage between LiFePO4 cathode and lithium metal counter electrode were recorded. The LiFePO4 working electrode was chosen due to the very characteristic shape of the OCV-curve of LiFePO4, which provides a flat voltage plateau over almost the complete SOC range.
Figure 12 shows a C/20 discharge of the LiFePO4 (LFP)/lithium metal cell with LTO mesh reference electrode.
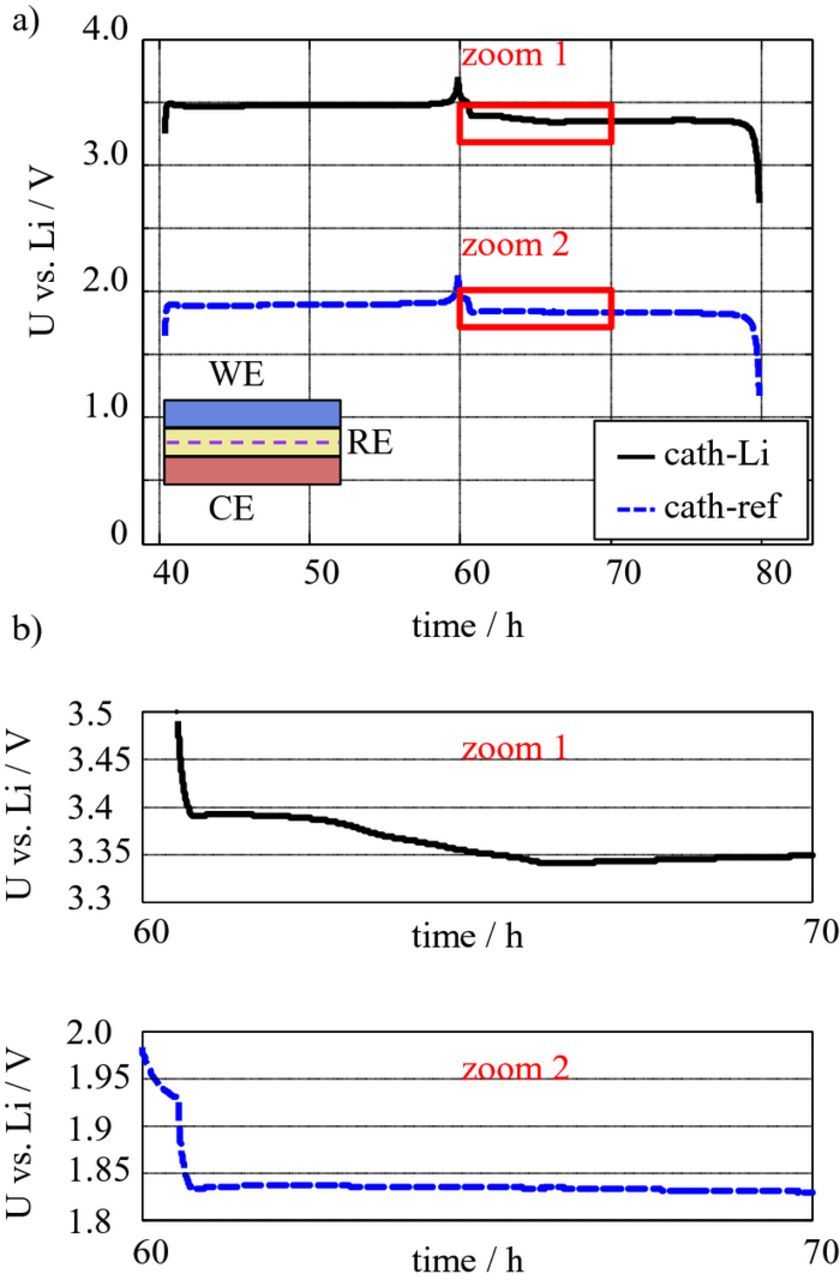
Figure 12. a) potential curves of cathode versus lithium metal counter electrode (solid black) and cathode versus reference electrode (dashed blue). b) zoom into cathode voltage versus lithium metal counter electrode (top), and into cathode voltage versus reference electrode (bottom). The potential curve of cathode versus lithium metal counter electrode features a step which cannot be observed in the voltage of cathode versus reference electrode.
The close-to-equilibrium discharge curve of the LFP-cathode versus lithium metal counter electrode (black) shows a characteristic plateau at 3.4 V, attributed to the two-phase reaction of the (1 – x) FePO4 + xLiFePO4 system.16 This plateau can also be observed in the cathode voltage versus reference electrode at 1.84 V. The difference between the potentials corresponds to the potential of the LTO-reference versus lithium of 1.56 V. The enlargements reveal a step in the voltage plateau for cathode versus lithium metal counter electrode, which is not visible in the voltage plateau of cathode versus reference electrode voltage. This step is not a characteristic of the LFP-cathode, but caused by the changing surface and therefore impedance of the lithium metal counter electrode. This experiment indicates that a quasi-equilibrium measurement in a half-cell without reference electrode can lead to wrong results, by interpreting the varying overpotentials at the lithium counter electrode as material characteristics of the working electrode. Thus, using a reliable reference electrode is strongly recommended for recording close-to-equilibrium OCV curves. The suitability of the LTO-coated aluminum mesh as reference electrode for these measurements was shown, which does not mean that other reference electrodes as the point-like lithium reference are not applicable as well for performing quasi-OCV measurements.
C-rate testing
New materials and electrode designs are commonly measured with a lithium metal counter electrode to investigate their charge and discharge rate performance. The additional overpotentials that are introduced by the lithium counter electrode are usually neglected.17–19
Figure 13 shows the setup for performing C-rate tests in a three-electrode setup, by applying the cutoff voltage between WE and RE. Figure 14 a shows the discharge curves of a cathode at different discharge rates, measured versus both, the lithium counter electrode and the LTO mesh reference, whereby the constant voltage of the LTO reference electrode of 1.56 V is added. The difference between the voltage curves corresponds to the overpotential of the lithium metal counter electrode shown in Figure 14b. Even at low currents, the difference is obvious in both, the obtained discharge capacity and the discharge voltage. This effect becomes increasingly pronounced with higher discharge rates. As Figure 14c clearly shows, the rate capability of an electrode can be strongly underestimated. It is therefore strongly recommended, that a three-electrode setup is also used for discharge experiments. Even though, the cell design with a mesh reference electrode has a higher electrolyte resistance due to the mesh and the two separators, it yields better results than the commonly used two-electrode cell with a lithium counter electrode without reference electrode.
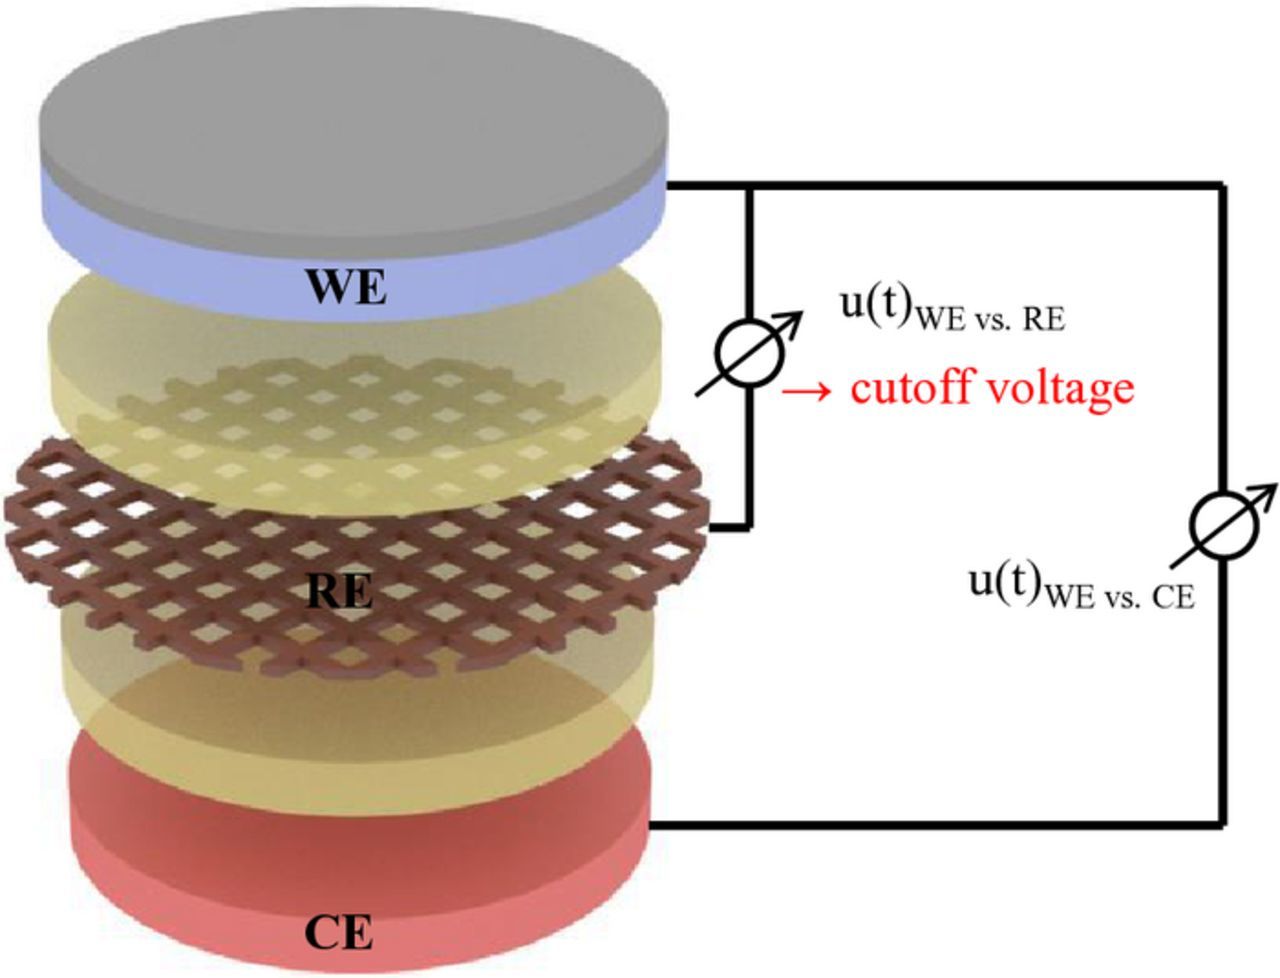
Figure 13. Measurement setup for performing C-rate tests in a three-electrode setup with reference electrode: the cutoff voltage is applied between WE and RE.
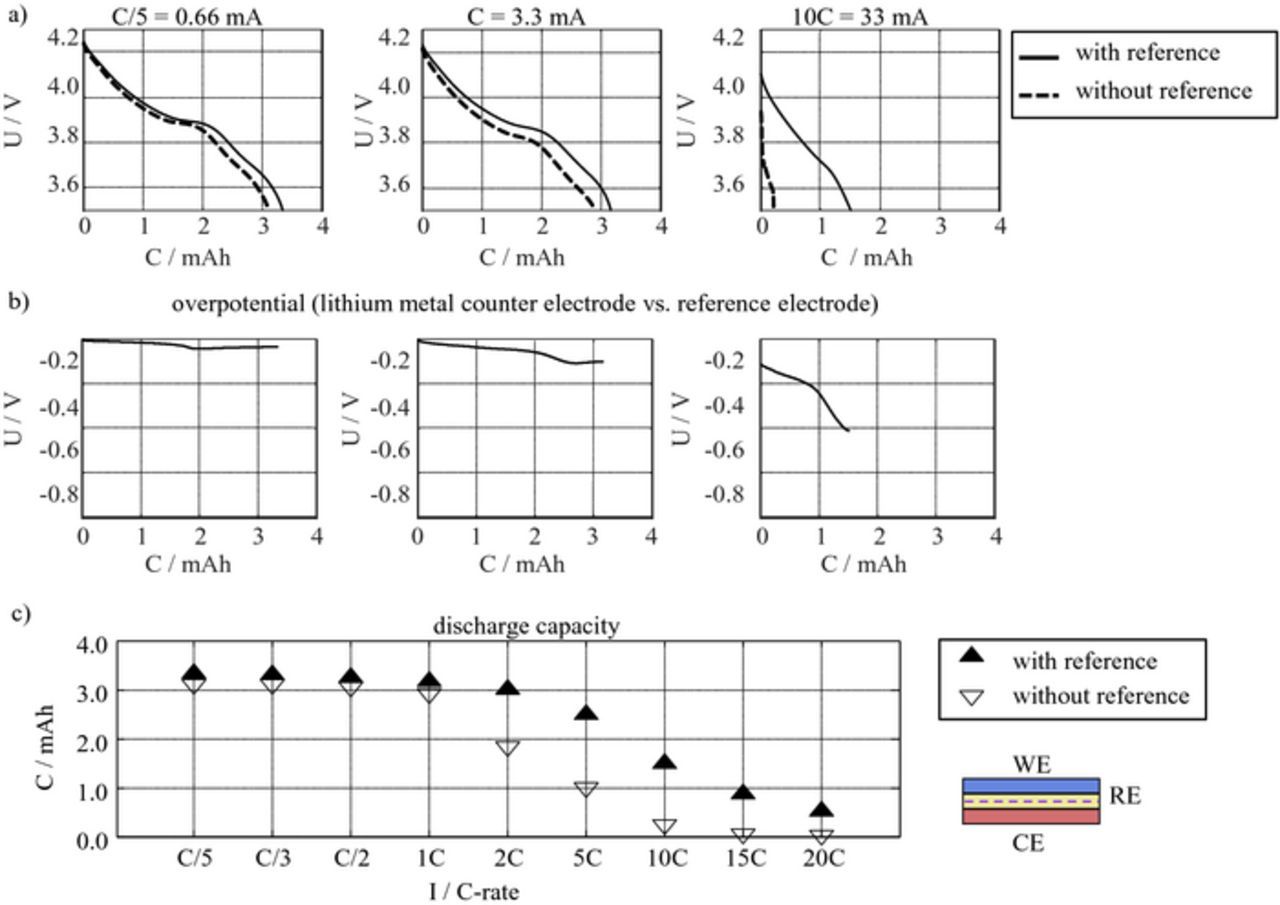
Figure 14. Comparison of C-rate test in a three- and two-electrode setup: a) potential curves b) overpotential of lithium metal CE and c) obtained cathode capacities. The capacities of the two-electrode setup are significantly lower (especially for high C-rates) caused by the overpotential of the lithium metal counter electrode.
A ring-shaped Lithium metal reference electrode recently presented by EL-Cell (PAT series) can probably provide even better results, because a very thin Viledon FS 3005–25 separator between working and reference electrode further minimizes the contribution of the electrolyte resistance. The applicability of the PAT series housing for C-rate testing will be subject of future work.
Conclusions
Part I of this paper used FEM simulations to show that two fundamental effects can cause measurement errors in a three-electrode setup: geometric asymmetry and electrochemical asymmetry. Geometric asymmetry can be caused by different sizes of working and counter electrode or a shift of the electrodes against each other. Electrochemical asymmetry means that the working and counter electrodes can have different loss processes (polarization and time constant). Both effects lead to artifacts in the half-cell impedance when measured by a point-like reference electrode, due to inhomogeneous current densities. However, the effects are considerably decreased for wire or mesh reference electrodes. These effects and the resulting distortion in half-cell impedance spectra were theoretically investigated in Part I.
This publication is Part II of the paper and validates the simulation results by experimental measurements. Therefore, a setup was chosen which provides both error sources: The counter electrode was punched to a diameter 0.5 mm smaller than the diameter of the working electrode (geometric asymmetry) and we selected non-identical working and counter electrodes, thus providing different loss processes (electrochemical asymmetry). Impedance measurements were conducted in two different setups: with a point-like lithium metal reference electrode (Setup A) and with a Li4Ti5O12 (LTO)-coated aluminum mesh as reference electrode (setup B). For the point-like reference electrode we choose the housing ECC-Ref by El-Cell. As there is no experimental cell housing commercially available with an integrated mesh reference electrode and the integration of a mesh in the ECC-Ref housing is very cumbersome, we developed our own cell housing applying an LTO-coated aluminum mesh as reference electrode. The simulation results of Part I were confirmed by the measurements: The half-cell impedance spectra measured by the point-like reference electrode showed artifacts which appear as loops, whereas the LTO-coated aluminum mesh delivered accurate measurement results.
Furthermore, the innovative setup with LTO-coated aluminum mesh as reference electrode placed between working and counter electrode was validated by additional measurements on symmetric cells.
Further important aspects for accurate results include the choice of reference electrode material and its dimensions (mesh size and thickness), as well as the choice of an appropriate counter electrode. These aspects were discussed and investigated for the proposed setup.
In addition to the application in electrochemical impedance spectroscopy, the suitability and advantages of the mesh reference electrode for recording quasi-equilibrium potential curves and for rate performance analysis was demonstrated.
In summary, the following requirements have to be fulfilled to obtain accurate measurement results with a three-electrode setup:
- (1)Stability of reference electrode potential: The reference electrode has to provide a steady and well defined potential during measurement time. E.g. lithium metal and Li4Ti5O12 (LTO) fulfill this requirement.
- (2)Minimizing geometric asymmetry: Ideally, counter and working electrode should be of the same size and perfectly aligned. Since this is not always feasible, the geometric asymmetry should be as small as possible.
- (3)Minimizing the impact of asymmetries: Neither electrical nor geometric asymmetry can always be entirely avoided. It has been shown by simulations and measurements that a mesh reference electrode minimizes the distortions caused by electrical and geometric asymmetries.
- (4)Minimize the impact of reference electrode impedance: This aspect becomes important for the mesh reference electrode, as the coexistence of two transport paths through the mesh and through the electrolyte leads to an additional polarization process which can potentially influence the impedance spectrum and has to be considered. To minimize this contribution, the mesh should, preferably, be as thin and sparse as possible.
List of Symbols
| LiPF6 | Lithiumhexafluorophosphate |
| RCT | charge transfer resistance |
| REL | resistance of the electrolyte |
| Zmesh | impedance contribution of the mesh |
Acknowledgments
The authors gratefully acknowledge Jake Packham for proof-reading the manuscript. The team from EL-Cell is acknowledged for providing experimental cell housings and the valuable discussion.