Abstract
The determination of corrosion rate for Mg and Mg alloys by electrochemical methods is complicated by several factors, including the intense hydrogen evolution (HE) that accompanies Mg dissolution, so hydrogen gas collection is often used. In the present paper a new gravimetric method for hydrogen gas collection, originally developed by Curioni, is evaluated as an alternative to the common volumetric method. The gravimetric method is based on the buoyant force exerted by the H2 produced by dissolving Mg when the gas is accumulated in a submerged container. The accuracy of the method is investigated using a Pt electrode and its suitability for the study of Mg corrosion behavior is examined using a high purity Mg specimen. The suitability of the new experimental set-up for the study of anodic HE (also termed Negative Difference Effect (NDE)) is also evaluated. The gravimetric method exhibits higher sensitivity to HE detection than the volumetric method both in the absence and in the presence of an external polarization. Real-time HE detection during dynamic polarization was found to allow clear and rapid assessment of the effect of polarization on HE. Possible artifacts and experimental limitations of the gravimetric experimental method are discussed.
Export citation and abstract BibTeX RIS

This is an open access article distributed under the terms of the Creative Commons Attribution 4.0 License (CC BY, http://creativecommons.org/licenses/by/4.0/), which permits unrestricted reuse of the work in any medium, provided the original work is properly cited.
Magnesium (Mg) and Mg alloys are materials that combine a very low density with good mechanical properties. These characteristics make Mg alloys excellent candidates for a wide variety of applications, from automotive transportation1,2 to orthopedic biodegradable implants.3–6 However, Mg alloys exhibit an elevated reactivity in aqueous environments, resulting in very high corrosion rates that have limited their use so far. For this reason, intense research is being carried out with the aim of improving the corrosion resistance of these materials. Accordingly, the determination of the corrosion behavior of Mg and its alloys under certain experimental conditions of interest represents an important tool to evaluate the suitability of Mg alloys for different applications.
The corrosion rate of metals can be assessed by different means, the most common being weight loss and electrochemical methods. Despite being widely utilized in corrosion rate determination, these approaches have some limitations.7 Weight loss measurements are simple and well established but inaccuracies can result from the cleaning process (i.e. overestimation or underestimation of the corrosion rate as a consequence of an insufficient or excessive cleaning after immersion, respectively). Moreover, weight loss measurements provide only an average corrosion rate and this rate will often change during the total time of experimentation. Electrochemical methods, mainly potentiodynamic polarization (from which Tafel fitting or extrapolation analysis can be performed), linear polarization resistance (LPR) measurements and electrochemical impedance spectroscopy (EIS), are reliable and reproducible methods that provide, unlike weight loss measurements, information not only about the instantaneous corrosion rate but also about the reaction mechanisms involved in the process. However, these methods have important shortcomings for the evaluation of Mg and its alloys because of difficulties in accurately assessing the Tafel slopes.8 Anodic potentiodynamic polarization of Mg and Mg alloys initially exhibit a very low apparent Tafel slope, representative of an ideally non-polarizable electrode behavior, followed by a bending of the curve. Dissolution of Mg and its alloys is accompanied by intense hydrogen evolution (HE) in aqueous electrolytes. This HE occurring during Mg dissolution increases in rate rather than decreases with increasing potential, due to the formation anodic H2,2,9–11 which has been commonly referred to as the Negative Difference Effect (NDE). The H2 bubbles produced at the dissolving Mg surface create a resistance to current flow from a distant counter electrode, and the increasing rate of HE with increasing dissolution rates causes a continually increasing resistance. This resistance combined with the increasing net anodic current results in progressively larger ohmic potential drops that are difficult to assess accurately. The distortions in the shape of the polarization curve make accurate determination of the Tafel slope difficult. HE increases during cathodic polarization result in the same situation.
HE is the primary cathodic reaction accompanying Mg dissolution because of the very low corrosion potentials (Ecorr) in the range of –1.5 to –1.8 V vs. SCE. The large overpotential for the HE reaction (HER) makes this the main cathodic reaction even in the presence of dissolved oxygen. The half reactions associated with the reduction of protons (H+) and water (H2O) in acidic and neutral/alkaline environments, respectively, produce copious HE at these low potentials. The open circuit reactions can therefore be described by:12
![Equation ([1])](https://content.cld.iop.org/journals/1945-7111/162/14/C693/revision1/jes_162_14_C693eqn1.jpg)
![Equation ([2])](https://content.cld.iop.org/journals/1945-7111/162/14/C693/revision1/jes_162_14_C693eqn2.jpg)
![Equation ([3])](https://content.cld.iop.org/journals/1945-7111/162/14/C693/revision1/jes_162_14_C693eqn3.jpg)
where Eq. 1 is the anodic half reaction, and Eqs. 2 and 3 are the cathodic half reactions in acidic and in neutral/alkaline media, respectively. Consequently, under open circuit conditions, where the rate of Mg oxidation is equal to the rate of HE production, it is possible to determine the instant corrosion rate from the rate at which HE occurs on the metal surface throughout the entire time of experimentation. The volumetric HE collection method has been widely used both for corrosion current density determination under open circuit conditions as well as to study the anodic HE exhibited by Mg and its alloys when subjected to anodic polarization.12–19
The most common experimental setup for volumetric HE collection measurements uses an inverted funnel attached to an upside-down burette over the specimen.13 The volume of the H2 evolved can be easily assessed by reading the level of the electrolyte inside the burette during the time of the experiment. Similar to weight loss measurements, volumetric HE collection does not provide information about the corrosion mechanism. Furthermore, H2 bubbles tend to accumulate at the walls of the funnel and the burette, leading an underestimation of the HE rate. As reported by Kirkland et al.,18 one of the main limitations of this technique is that it is not suitable for the study of high corrosion resistant materials or short experimental times, as not enough H2 is produced to allow reliable measurements of the amount of gas produced.
With the aim of overcoming some of these limitations, new experimental setups for HE collection have recently been used. Lebouil et al.20 developed an on-line volumetric method where the H2 produced in flow cell moved to a microfluidic chamber coupled to a rapid video camera, where HE was monitored with the aid of image analysis software. This method, time resolved volumetry, was coupled with atomic emission spectroelectrochemistry to allow for simultaneous measurement of gas evolution and elemental dissolution rates. However, the complexity of this approach makes it unsuitable for standard corrosion studies. Recently, Curioni21 developed another method for real-time HE collection based on the measurement of the hydrostatic force resulting from the accumulation of hydrogen in a submerged container. In this gravimetric setup, the Mg test specimen was mounted below an inverted plastic beaker that was completely immersed into the test solution and connected to a precision balance by a rigid support. The H2 gas produced on the electrode surface accumulated inside the inverted beaker, which decreased its apparent weight by a buoyant force. A video camera was used to measure the change in the measured weight of the beaker. It should be noted that, contrary to the electrochemical methods previously described to determine the corrosion rate of metals, both the volumetric and the gravimetric methods for HE collection do not require an external polarization. Therefore, they provide real-time HE rates without any perturbation of the system under study.
The aims of this work are to develop further the gravimetric method of Curioni21 and to study its suitability for corrosion rate determination of Mg. The accuracy of this new method was evaluated by means of cathodic galvanostatic polarization on a platinum (Pt) electrode, where faradaic reactions due to the electrode dissolution are avoided. The gravimetric method was compared with the traditional volumetric method for HE collection measurements. Additionally, the new method was evaluated for the study of anodic HE on pure Mg. Possible artifacts and experimental limitations of the gravimetric experimental method are also discussed.
Experimental
HE collection was investigated by the traditional volumetric and the new gravimetric methods. The volumetric experimental approach was the same as has been widely used and detailed descriptions can be found elsewhere.13,18 Fig. 1 shows a schematic of the gravimetric set-up. A conventional three electrode configuration was used. The working electrode consisted of a Pt (99.99% purity) or high purity Mg (99.98% purity) test specimen. A saturated calomel electrode (SCE) and a Pt mesh were used as reference and counter electrodes, respectively. All the potentials presented in the present study are thus referred to the SCE.
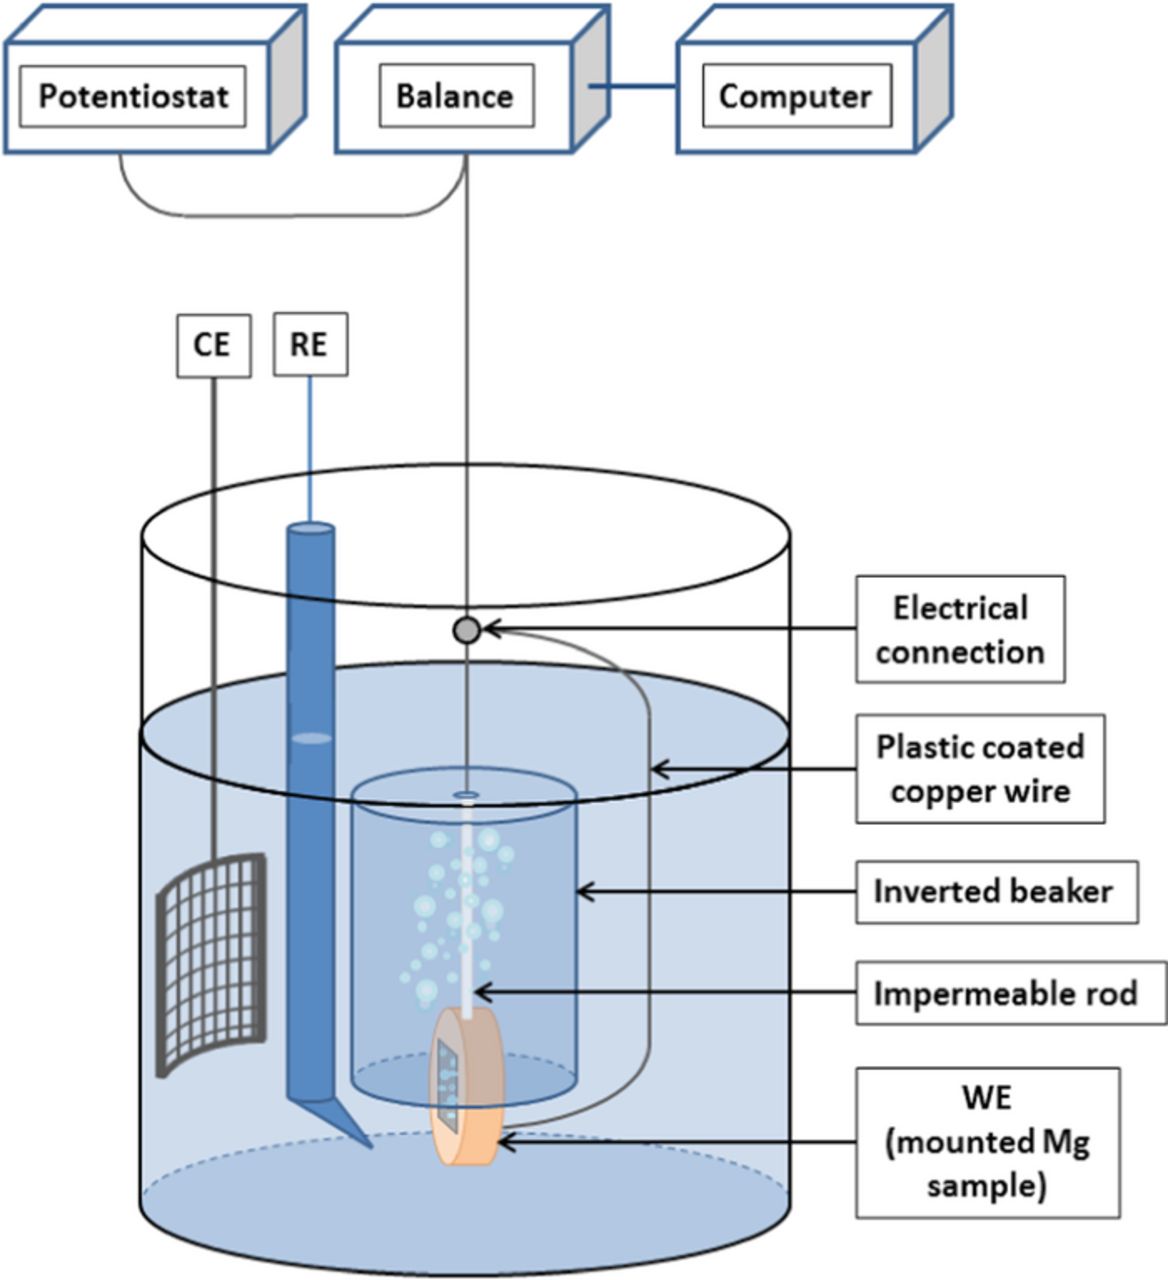
Figure 1. Schematic of the experimental gravimetric setup for hydrogen gas collection using a mounted HP Mg specimen as working electrode.
Because H2 can permeate through polymeric materials,18 the inverted beaker was made of glass to avoid any leaks due to the diffusion of H2. The beaker was attached securely to a fiber that was hung from the bottom of a Mettler Toledo balance (model MS204S) with an accuracy of 0.1 mg. The balance was connected to a computer where the time evolution of the weight was recorded automatically. Mg was mounted in epoxy and a series of silicon carbide papers were used to grind the samples to a 1200 grit finish under ethanol prior to testing. The electrical connection was carried out by attaching a copper wire to the rear part of the metal prior to mounting. The mount was firmly attached to the inverted beaker by means of an impermeable rod. Measurements made on Pt used a foil that was firmly attached to the impermeable inverted beaker using lacquer paint. A plastic coated copper wire was used to connect the Mg or Pt sample to the potentiostat to enable the electrochemical measurements. Prior to the beginning of the experiments, the air inside of the inverted beaker was mechanically removed with the aid of a plastic tube attached to a bulb pump.
The accuracy of the gravimetric method for HE collection was evaluated applying different cathodic current densities over the range of –1 to –70 mA/cm2 on the Pt electrode using a test solution of 1 M NaCl with a density value equal to 1.037 g cm–3. Anodic HE was studied by applying different anodic current densities over the range of +1 to +25 mA/cm2 on a high purity Mg (HP Mg) electrode using a 0.1 M NaCl solution with a density value equal to 1.001 g cm–3. Galvanodynamic polarization measurements were carried out on the HP Mg electrode in separate experiments using a 0.1 M NaCl solution. Cathodic and anodic galvanodynamic polarization measurements were performed separately, scanning downwards and upwards at 0.1 mA/cm2s from the open circuit potential (OCP), respectively.
Solution density values were calculated with Stream Analyzer software from OLI Systems. All solutions were prepared from laboratory grade reagents and with high purity water of 18.2 MΩ cm (Millipore system). All the experiments were performed thermostatically at 25°C using a double jacketed cell connected to a circulating thermostatic bath.
The OCP of the samples was monitored for 10 min prior to the application any polarization to allow the system to reach both a stable potential and a steady weight. A Gamry Instruments Reference 600 potentiostat/galvanostat controlled by the Gamry Framework software was used to perform the electrochemical experiments.
Physical Principle
The gravimetric method for HE collection is based on the hydrostatic force produced by the volume of electrolyte displaced by the evolved H2. Fig. 2 shows a schematic of the corresponding system. The downward force measured by the balance is the sum of several vertical forces. The total mass of the beaker, sample, and connecting rod and fiber, mbeak, is assumed to be constant. The dissolution mass of Mg will be shown below to be insignificant. Another downward force is associated with the head of solution between the beaker and the solution surface. An upward buoyant force results from the accumulation of hydrogen gas in the inverted beaker. The net force measured by the balance is therefore:
![Equation ([4])](https://content.cld.iop.org/journals/1945-7111/162/14/C693/revision1/jes_162_14_C693eqn4.jpg)
where ρe and ρH2 are the density of the electrolyte and hydrogen gas, respectively, g is the gravitational acceleration (9.8 m/s2), A is the cross-sectional area of the beaker interior, and h1 and h2 are the depths of the beaker and H2/solution interface below the surface, respectively. Assuming that h1 and mbeak are constant and that ρH2 is small compared to ρe, the change in mass measured by the balance, mnet, will be equal to ρeAΔh = ρeVH2 where Δh and VH2 are the height and volume of the hydrogen gas column collected by the beaker. The hydrogen volume as a function of time, or the HE rate, is thus:
![Equation ([5])](https://content.cld.iop.org/journals/1945-7111/162/14/C693/revision1/jes_162_14_C693eqn5.jpg)
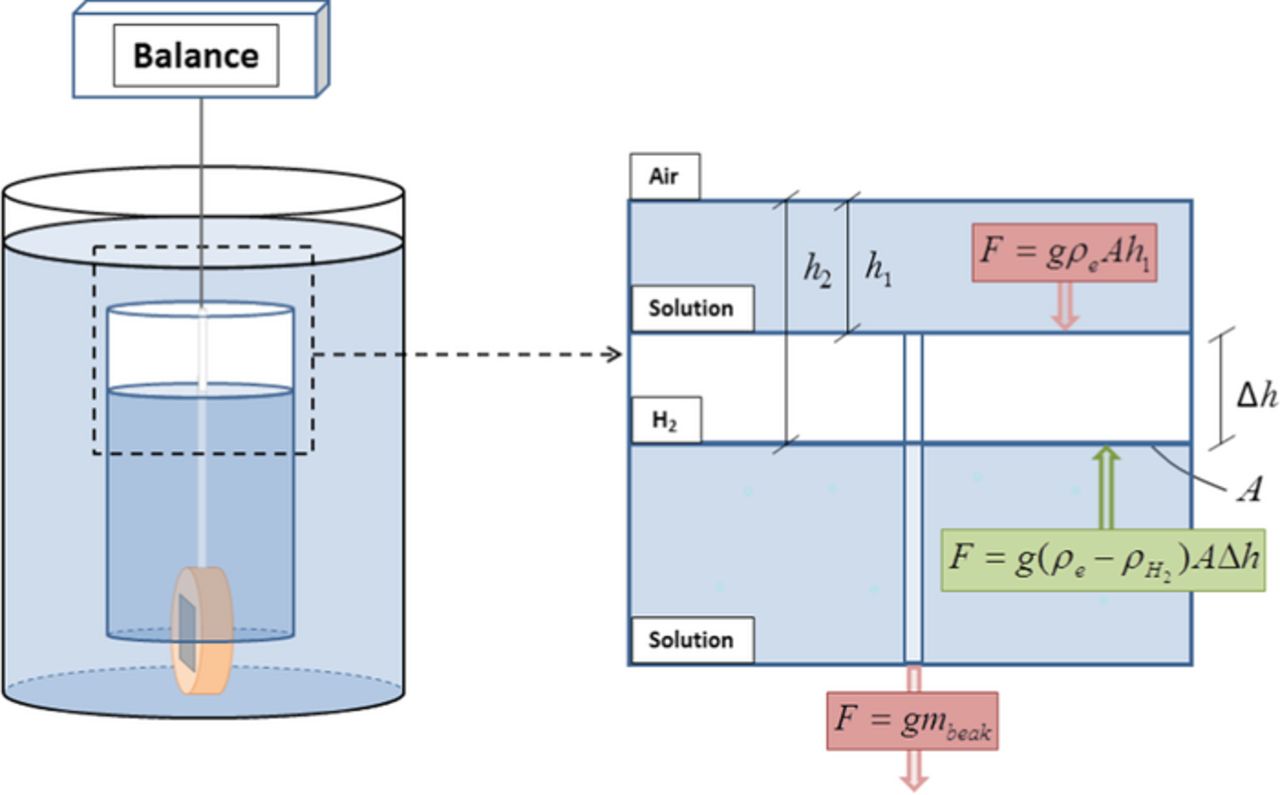
Figure 2. Schematic of the forces acting on the gravimetric method for HE collection. Downward forces represented in red color and upward force represented in green color. mbeak is the total mass of the beaker, sample, connecting rod and fiber, ρe and ρH2 are the density of the electrolyte and hydrogen gas, respectively, g is the gravitational acceleration (9.8 m/s2), A is the cross-sectional area of the beaker interior, and h1 and h2 are the depths of the beaker and H2/solution interface below the surface, respectively.
The current density associated with the HER (iHER) are also easily obtained by Faraday's law from the HE rate. In the absence of any external polarization, iHER will be equal to icorr. As observed in Eqs. 2 and 3, it is necessary to take into account that 2 moles of electrons are needed for the production of 1 mole of H2. Considering as an approximation that the H2 accumulated inside the inverted beaker behaves as an ideal gas, each mole of H2 produced will occupy approximately 24.45 liters at 25°C and 1 atm. It is important to realize that, as pointed out by Curioni,21 the buoyant force associated with the produced hydrogen gas is much greater than the mass loss associated with the Mg corrosion reaction that produced the gas. For example, the mass loss associated with 1 mole of Mg dissolution would be 24.3 g, whereas using a density value for the electrolyte of 1.037 g cm–3, the buoyancy associated with the mole of hydrogen generated by the corrosion reaction would be about 25355 g. The gravimetric approach can therefore provide a continuous and sensitive measure of the Mg corrosion rate. Another advantage of this gravimetric approach relative to the volumetric method is that, ideally, all of the hydrogen bubbles generated are sensed, even those remaining on the sample surface, which still create a buoyant force.
The effect of pressure: Water and atmospheric pressure
As mentioned above, the volume of gas produced per mole of H2 can be approximated by means of the ideal gas law. At constant temperature, this volume will depend exclusively on the gas pressure. Although using standard conditions for pressure (1 atm) could be a reasonable approach, significant differences are observed for deviations from this standard value.18 Consequently, to accurately account for the current associated with the HER, a more realistic pressure for the H2 gas generated needs to be determined.
When H2 gas is produced, a gas/liquid interface is created. Once this interface appears, an evaporative process of the electrolyte takes place. The gaseous phase constituted initially by pure H2 will eventually saturate with evaporated solvent until the equilibrium vapor pressure is achieved. Thus, the gaseous phase accumulated at the top of the inverted beaker as the result of the HER will be composed of H2 and evaporated water vapor coming from the electrolyte. In a mixture of gases, each gas has a partial pressure, which is the hypothetical pressure of that gas if it alone occupied the volume of the mixture at the same temperature. The total pressure (PT) of an ideal gas mixture is the sum of the partial pressures of each individual gas in the mixture. For the volume of gas accumulated at the top of the inverted beaker in the gravimetric set-up, PT would be defined by the following expression:
![Equation ([6])](https://content.cld.iop.org/journals/1945-7111/162/14/C693/revision1/jes_162_14_C693eqn6.jpg)
where PH2 is the partial pressure of the generated H2, Pvapor(H2O) is the vapor pressure for water at a given temperature, and PT has already been described. Because the beaker is fully immersed in the electrolyte, PT will be the sum of the atmospheric pressure (Patm) and the hydrostatic pressure exerted by the column of electrolyte on the top part of the beaker. Consequently, the partial pressure of the volume of produced H2 will be described by:
![Equation ([7])](https://content.cld.iop.org/journals/1945-7111/162/14/C693/revision1/jes_162_14_C693eqn7.jpg)
where h1 is the immersion depth, i.e. the distance between the top of the inverted beaker and the solution/air interface (see Fig. 1), Pvapor(H2O) is 0.03 atm at 25°C and the rest of the parameters have been previously described. For low density solutions and/or small immersion depths the second term in the right side of Eq. 7 will be on the order of 1 × 10⁻⁴ atm, and thus could be neglected. However, the importance of considering the real atmospheric pressure has been previously discussed by Kirkland et al.18 and needs special attention.
Atmospheric pressure is caused by the weight of air above the measurement location and this parameter will vary with altitude. At points above the sea level, where the average pressure of 1 atm is taken as a reference, an exponential decrease in the atmospheric pressure is expected according to:22
![Equation ([8])](https://content.cld.iop.org/journals/1945-7111/162/14/C693/revision1/jes_162_14_C693eqn8.jpg)
where P0 is the average pressure at the sea level (1 atm), M is the molar mass of dry air (29 g mol−1), h is the altitude above the sea level and the rest of the parameters have their usual meanings. Note that variation of the atmospheric pressure with local climatic conditions was not considered in the analyses performed in this paper. Considering the average local atmospheric pressure at the location where the experiments were carried out, about a 3% difference in the volume of generated H2 would exist with respect to that assuming an atmospheric pressure of 1 atm. Furthermore, nearly a 7% error would be expected without corresponding corrections for both the vapor pressure and the atmospheric pressure. Note that this difference increases as conditions such temperature and height above sea level increase. For instance, at a local height of 650 m above the sea level and a temperature of 30°C, about a 15% difference in H2 volume would be exhibited.
Following the previous rationale and taking into account the corrected value for vapor and atmospheric pressures, then the gas produced per mole of H2 will occupy approximately 26.12 liters at 25°C. Using Faraday's law, a 140 μg s–1 variation in the buoyant force associated with the mole of hydrogen generated by the corrosion reaction is equivalent to a current of 1 mA (considering a density value for the electrolyte of 1.037 g cm–3, i.e. 1 M NaCl solution). This represents a 10% difference with respect to the expected buoyant force variation under standard conditions. When a 0.1 M NaCl solution was used (density value of 1.001 g cm–3), a 135 μg s–1 variation in the buoyant force was considered equivalent to a current of 1 mA.
Results and Discussion
Accuracy of the gravimetric experimental set-up
To evaluate the accuracy of the experimental method for gravimetric HE collection, galvanostatic polarization measurements were conducted on a Pt foil electrode with a surface area of 1.34 cm2 using different applied cathodic current densities, iapp, for a fixed period of time. A Pt electrode was chosen due to its low reactivity in aqueous media to avoid any interference from corrosion that might occur during polarization. The traditional volumetric HE collection method was also evaluated for comparison. The application of different cathodic current densities represents a reliable procedure to assess the accuracy of both HE collection methods based on the fact that, ideally, the calculated current densities associated with the HER should be equal to the applied cathodic current densities. For this to be applicable, no other electrochemical reaction in competition with HER should occur on the electrode surface. The current was applied for 900 and 1000 s for the volumetric and gravimetric methods, respectively. The longer period was used for the volumetric method because of the need to make a sufficient number of volume readings given the limitations in the accuracy of the burette, 0.1 mL. Measurements were performed every 100 s for a total of 10 measurements. For an applied cathodic current density of 1 mA cm–2, longer experimental times were needed due to the low amount of H2 production. In this case a total experimental time of 6000 s was used with volume measurements carried out every 600 s. For the gravimetric method the high precision balance allowed quantitative and automatic weight measurement every 5 seconds, providing a significantly higher confidence in HE rate determination.
Fig. 3 shows the volume of H2 collected during the application of different cathodic current densities as a function of time in 1 M NaCl solution for the Pt foil electrode using the volumetric experimental set-up. As was observed in previous works on high purity Mg,12,15 the HE rate was linear in all cases although an initiation time or period of lower rate was observed. The duration of this period was dependent on the applied current density value, being longer for lower current densities. This was particularly relevant for the initial stages of experimentation. H2 gas is very soluble in aqueous environments and it is likely that some H2 was lost by dissolution into solution.18 However, the dissolution of H2 in the electrolyte appeared not to be responsible for this initial period of lower HE detection, as will be discussed below. The inset in Fig. 3a shows a magnified view of the initiation period. For applied cathodic current densities below 25 mA cm–2, approximately 500 to 600 s were needed for the volume increase to be linear. For the applied cathodic current density of 1 mA cm–2, Fig 3b, the time needed to observe linearity increased to approximately 1200 s. This confirms the unsuitability of the volumetric method when short immersion times or low current densities are investigated (i.e. low icorr values associated with corrosion resistant materials).
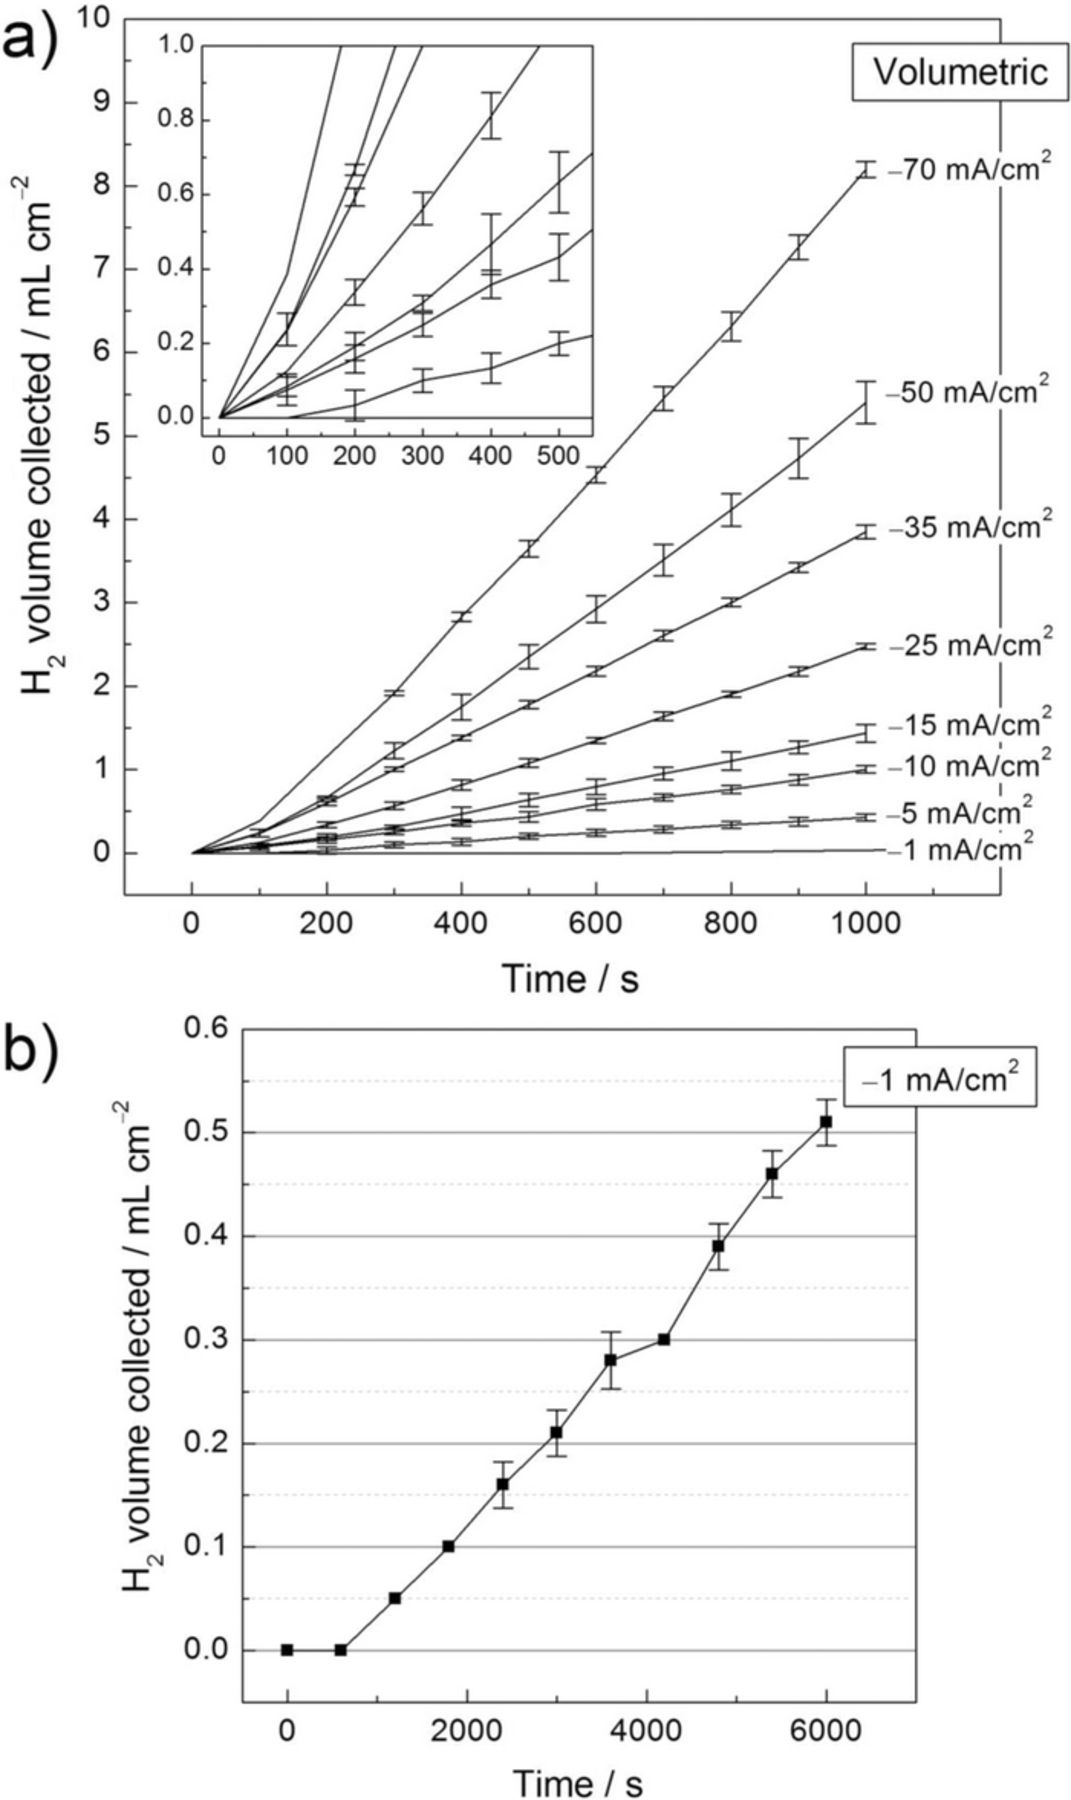
Figure 3. Volume of hydrogen collected as a function of time for the Pt foil electrode using the volumetric setup for HE collection. The solution was 1 M NaCl. Each current density was applied for 1000 seconds (Fig. 3a), with the exception of –1 mA/cm2 that was applied for 6000 seconds (Fig. 3b). Mean values from replicated experiments are presented. The error bars are standard deviation.
Fig. 4 shows the calculated volume of H2 collected during the application of different cathodic current densities as a function of time in 1 M NaCl solution for the Pt foil electrode using the gravimetric experimental set-up. A linear-like behavior was exhibited during the whole time of experimentation where, in contrast to the volumetric method, no initiation time of lower rate was observed at the early stages of polarization. The inset in Fig. 4 shows that a reliable linear region was exhibited within the first minute of experimentation. The experimental conditions, such as applied cathodic current, temperature, volume of electrolyte and working electrode surface, were identical for the two different H2 collection methods. Therefore, it is reasonable to assume that, for each particular current density applied, the same amount of H2 dissolved into the electrolyte independently of the H2 collection method used and that the time of lower HE detection exhibited at the beginning of the volumetric experiments was not caused by H2 dissolution. The slower response of the volumetric method might be associated with the time for bubbles to form, detach from the electrode surface, and travel to the top of the burette. Note that even the bubbles still attached to the sample surface would create a buoyant force in the gravimetric method. It is also possible that more hydrogen would be lost by dissolution into the electrolyte in the volumetric method because of the long travel distance for the bubbles, but this effect is expected to be small. This high sensitivity to HE detection makes the gravimetric method more suitable than the volumetric method for the study of materials with high corrosion resistance, which evolve hydrogen at a slower rate. The gravimetric method also allows for the study of materials with limited size and/or thickness, where complete dissolution of the sample may occur before enough measurements from the burette could be taken for a reliable determination of the HE rate.
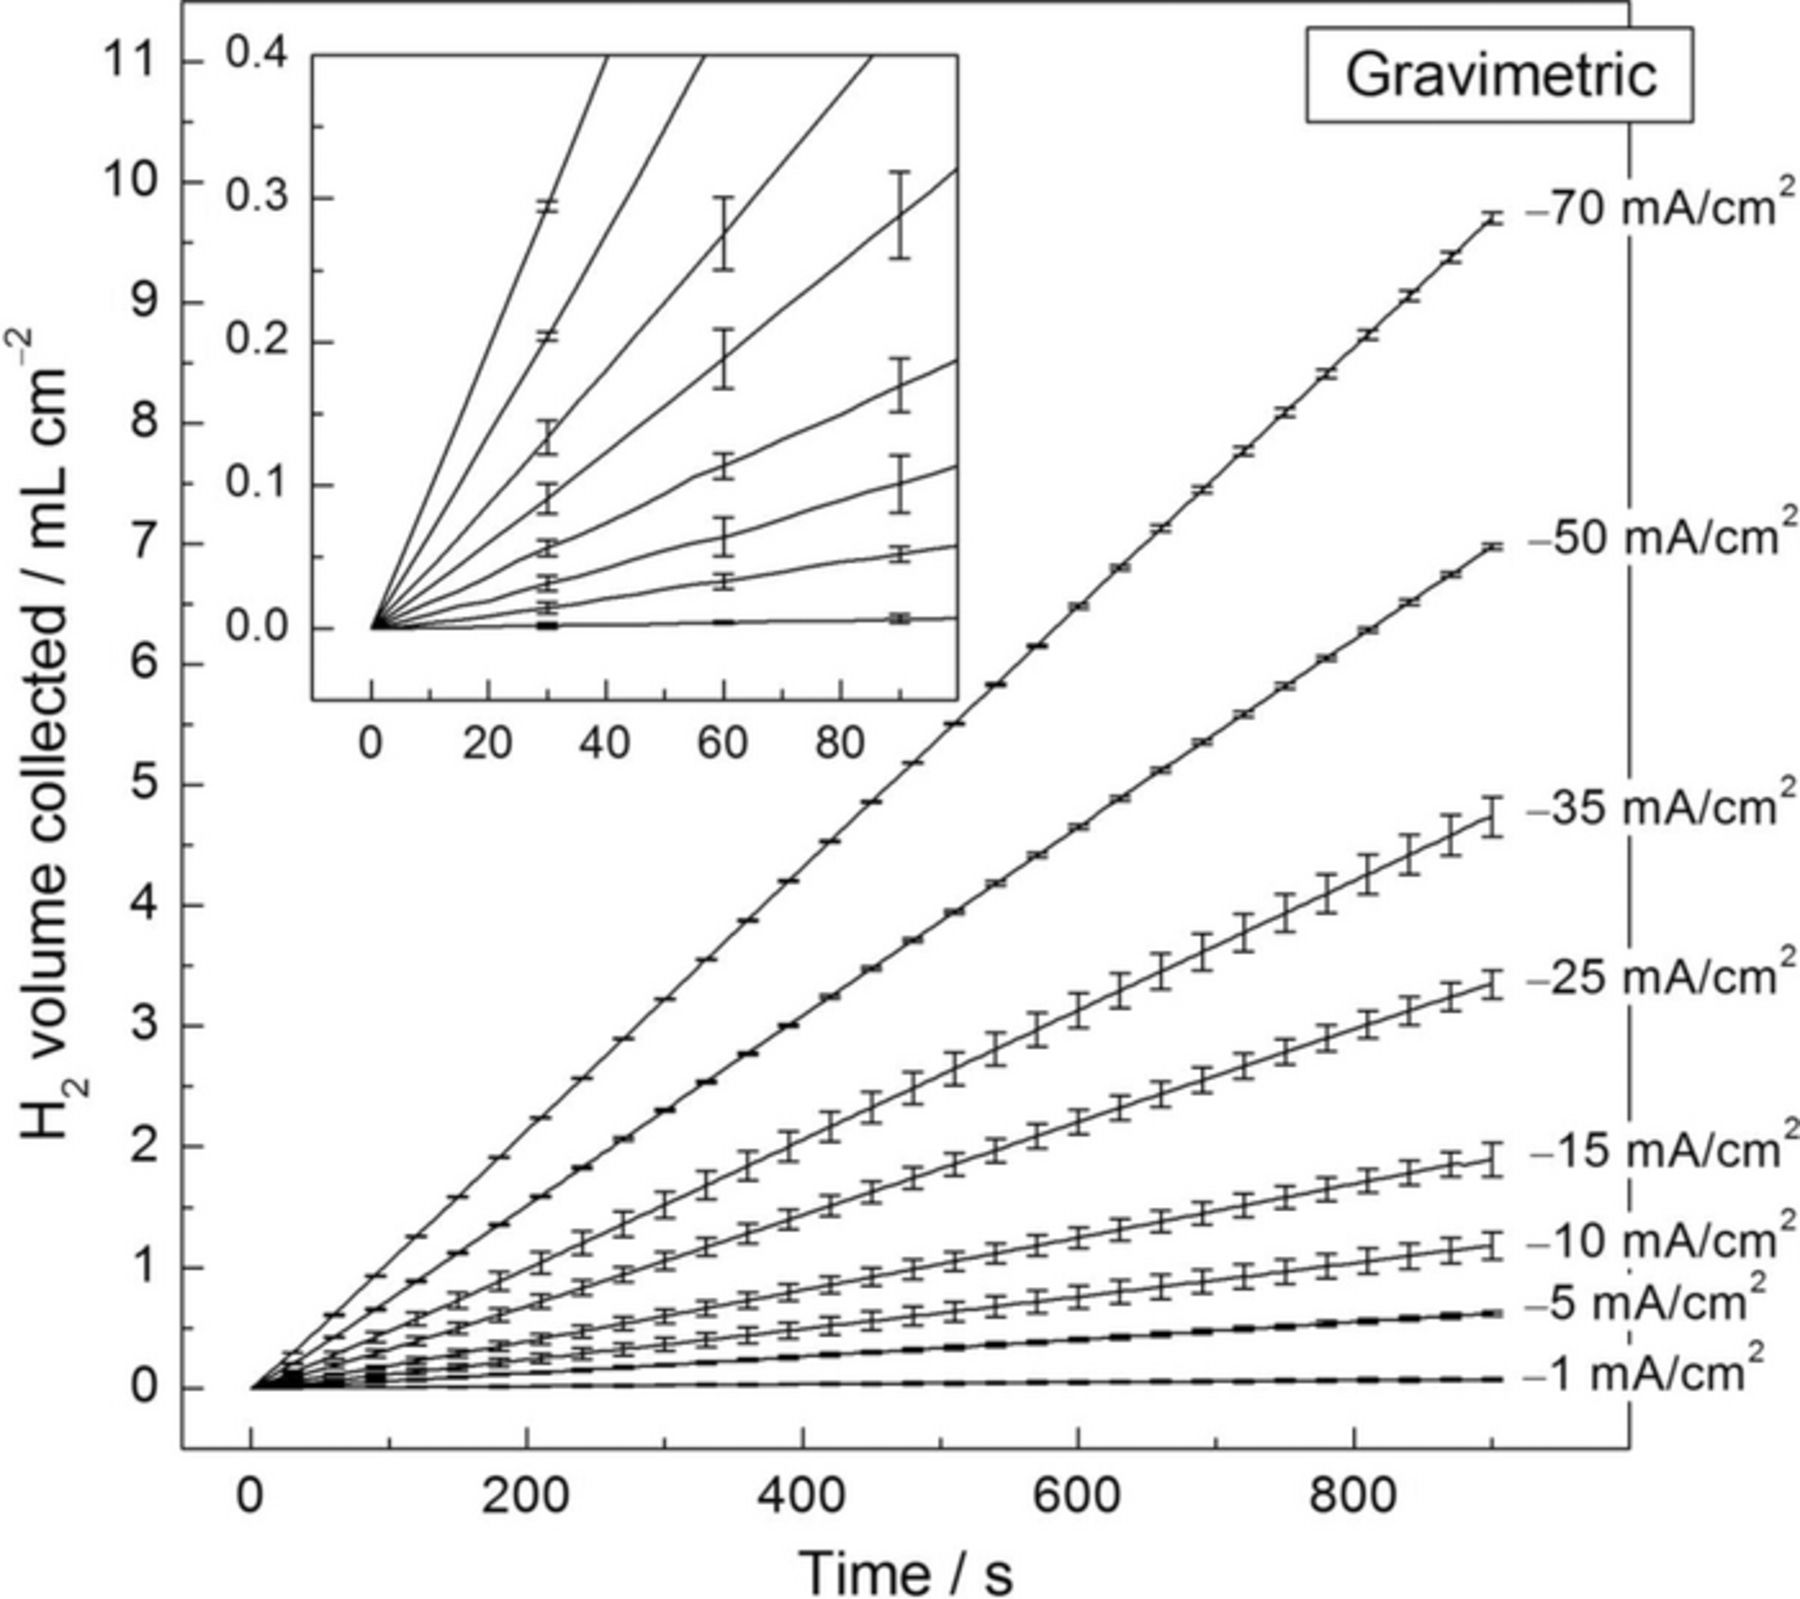
Figure 4. Volume of hydrogen collected as a function of time for the Pt foil electrode using the gravimetric setup for HE collection. The solution was 1 M NaCl. Each current density was applied for 900 s. Points were taken every 5 s. The error bars are standard deviation.
The steady state HE rates were determined from the linear portion of the curves in Figs. 3 and 4 and are plotted in Fig. 5 as current densities as a function of the applied cathodic current density. The dashed lines in Fig. 5 represent the ideal response in HE detection with 100% accuracy (slope of 1) and were added to aid comparison. The expected linear-like behavior was observed for both volumetric and gravimetric methods. For the volumetric method, the iHER values were lower than the applied current densities over the whole range of currents investigated. In contrast, higher values for iHER were observed for the gravimetric method, especially when cathodic current densities higher than 15 mA cm–2 were applied. From the linear fits of the data, the gravimetric method exhibited HE current densities closer to the expected ideal values than the volumetric method, with deviations in the slope of 0.12 and 0.16, respectively, from the theoretical value of 1. The calculated slopes suggest that the volumetric method was able to detect 84% of the H2 produced over the whole range of applied current densities, whereas the gravimetric method detected 112%. However, this should be read with caution since a regression line is the straight line that best approximates all the individual data points. For this reason, to better determine the accuracy of both experimental methods for HE detection, each iHER value should be evaluated individually.
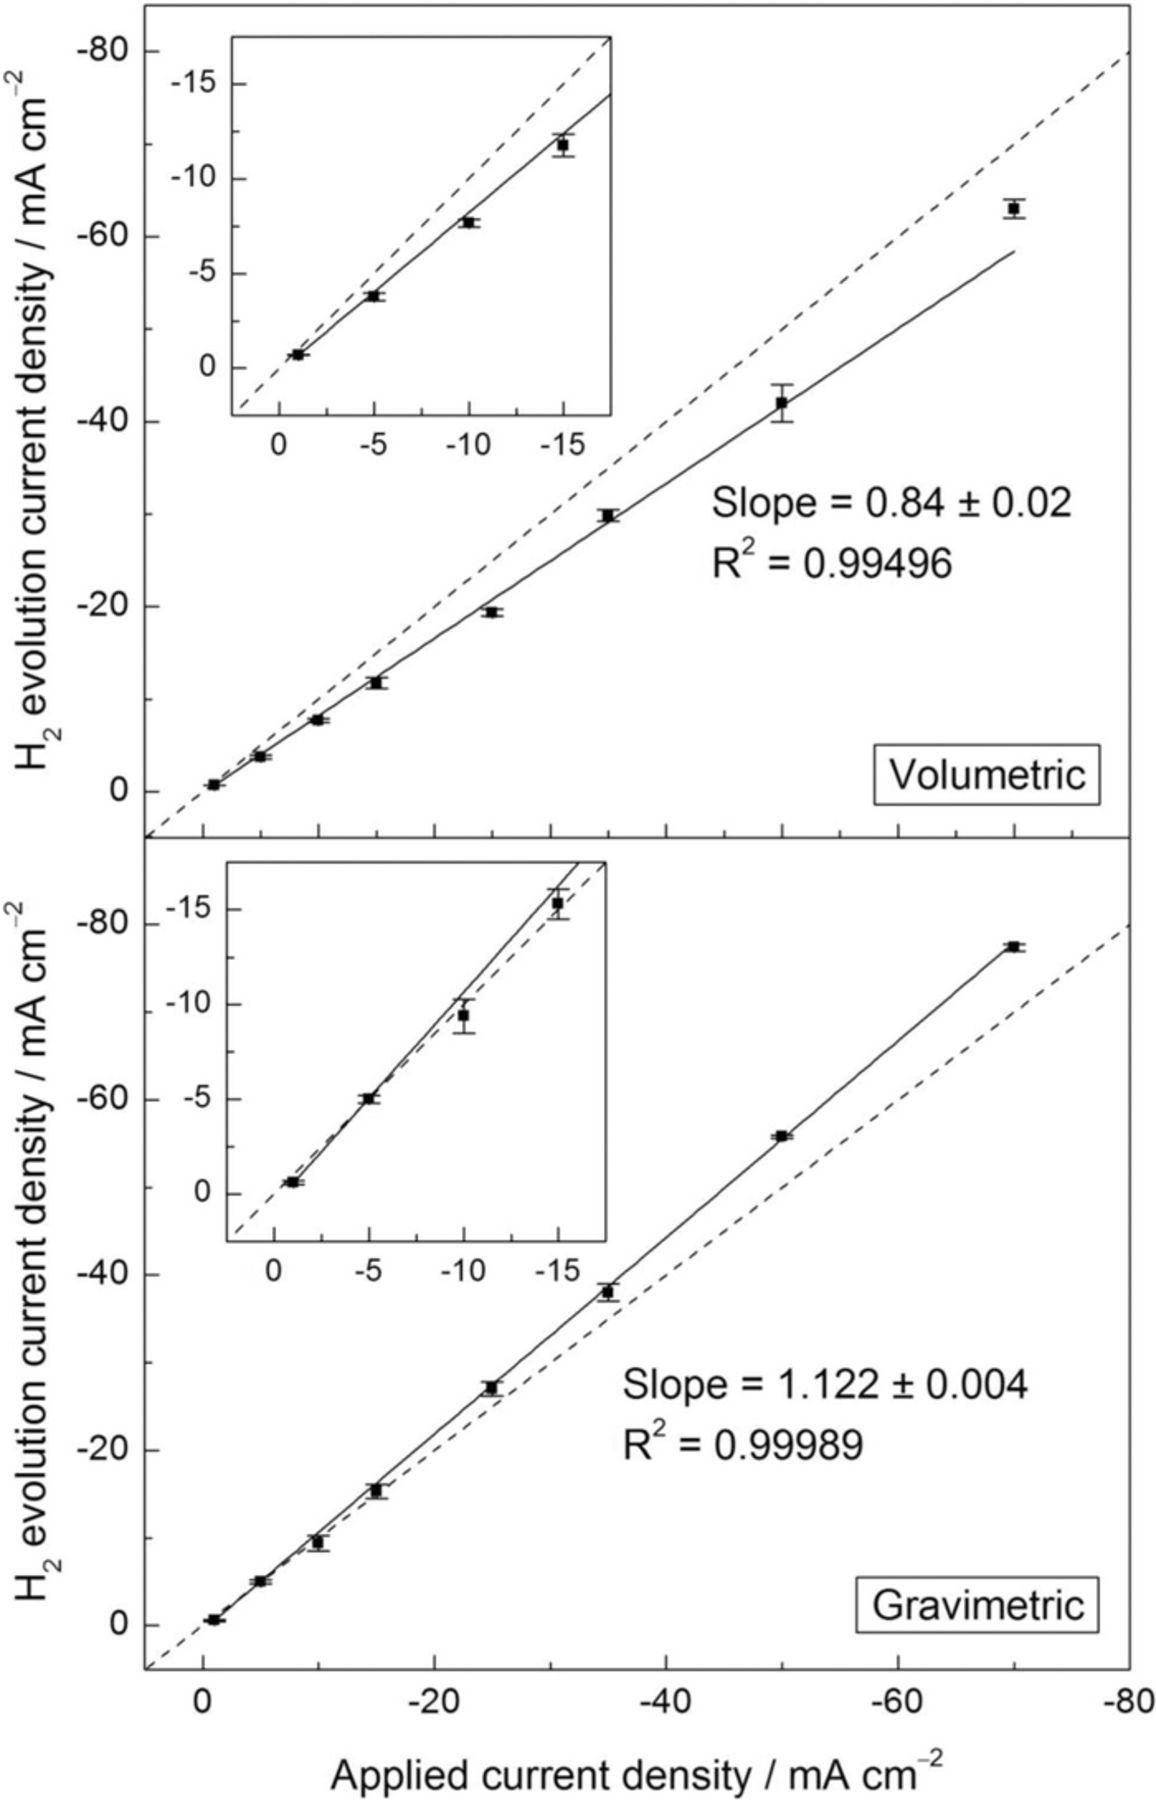
Figure 5. Current density associated with HE for the Pt electrode in 1 M NaCl solution as a function of the applied cathodic current density using the volumetric and the gravimetric method. Current density values were calculated from the steady state HE rates during galvanostatic polarization measurements in Figs. 3 and 4. The error bars are standard deviation. Dashed lines represent the ideal response with 100% accuracy (slope of 1).
Fig. 6 shows the absolute value of the percentage error for the calculated iHER value as a function of the applied cathodic current density. For applied cathodic current densities of 25 mAcm−2 and greater, the gravimetric method exhibited error values very close to 10%, which is shown as a dashed line in the figure and assumed as the threshold below which the experimental values might be considered acceptable. The errors were much less for the low applied current densities. In contrast, significantly higher errors were observed for the volumetric method, particularly for the low applied current densities. This confirms the higher accuracy of HE detection shown in Fig. 5. It is interesting to note that the increase in the applied current density generated two different trends depending on the experimental method. While the error values progressively decreased in the volumetric method as the applied cathodic current density increased approaching the satisfactory threshold, the errors associated with iHER for the gravimetric method increased to a relatively steady value close to 10%. This is a reasonable behavior for the volumetric method because as the HE rate increases, the higher amount of H2 produced saturates the solution surrounding the electrode quicker, leading to a higher HE collection efficiency. Furthermore, it is likely that the copious generation of H2 did not allow bubbles to attach to the electrode surface, neither to the walls of the funnel and the burette, decreasing the underestimation of the HE rate. However, it is somewhat surprising that, for the gravimetric method, higher amounts of H2 were collected with respect to those expected from the cathodic current densities applied, especially for current densities over –15 mA cm–2. The reason for this extra current is not yet clear, but the following points address this issue.
- (a)In an aerated solution such as the one used in the present study, a certain amount of dissolved O2 and N2 are present in the electrolyte. The bubbling of the electrolyte with the produced H2 gas may also lead to removal of some the gases dissolved in it by degasification. As observed in Fig. 6, a relatively steady amount of 10% extra weight was registered using the gravimetric method when the highest current densities were applied. This corresponds to an increase in the hydrostatic force of 1.18 grams as the result of an electrolyte displacement of approximately 1.1 mL for the highest current density (i.e. –70 mA cm–2), that will be considered as the maximum amount of extra weight registered. The solubilities of O2 and N2 gases in an aqueous solution at standard conditions are approximately 5.8 and 10.9 mL/L, respectively.23 Consequently, in the constant volume of 0.6 L of electrolyte used throughout the experiments, a total volume of approximately 10 mL of O2 and N2 gases was contained in the test solution. It is reasonable then that nearly a 10% if it could have been displaced by HE. It is interesting to note that the electrochemical cell was open to air. This may represent a potential source of O2 and N2 to be incorporated to solution. Furthermore, simultaneously to the production of H2 at the working electrode, O2 was produced at the counter electrode at a rate proportional to HE rate so that the test solution was continuously fed with O2 during the whole time of experimentation.
- (b)The solubility of a gas in a solvent is dependent on temperature, meaning an increase in temperature results in a decrease in the gas solubility in an aqueous solution. As discussed by Kirkland et al.,18 an increase in temperature may result in the release of a certain amount of the gases dissolved in the electrolyte, mainly O2 and N2. The electric current flow through the low conductivity region near the electrolyte associated with bubbles may cause Joule heating of the solution near the electrode surface, promoting a decrease in dissolved gas solubility. The amount of heat released by Joule heating is proportional to I2R so it should be stronger at higher applied current density. However, due to the relatively large volume of electrolyte used (approximately 600 mL) it is likely that this effect is negligible.
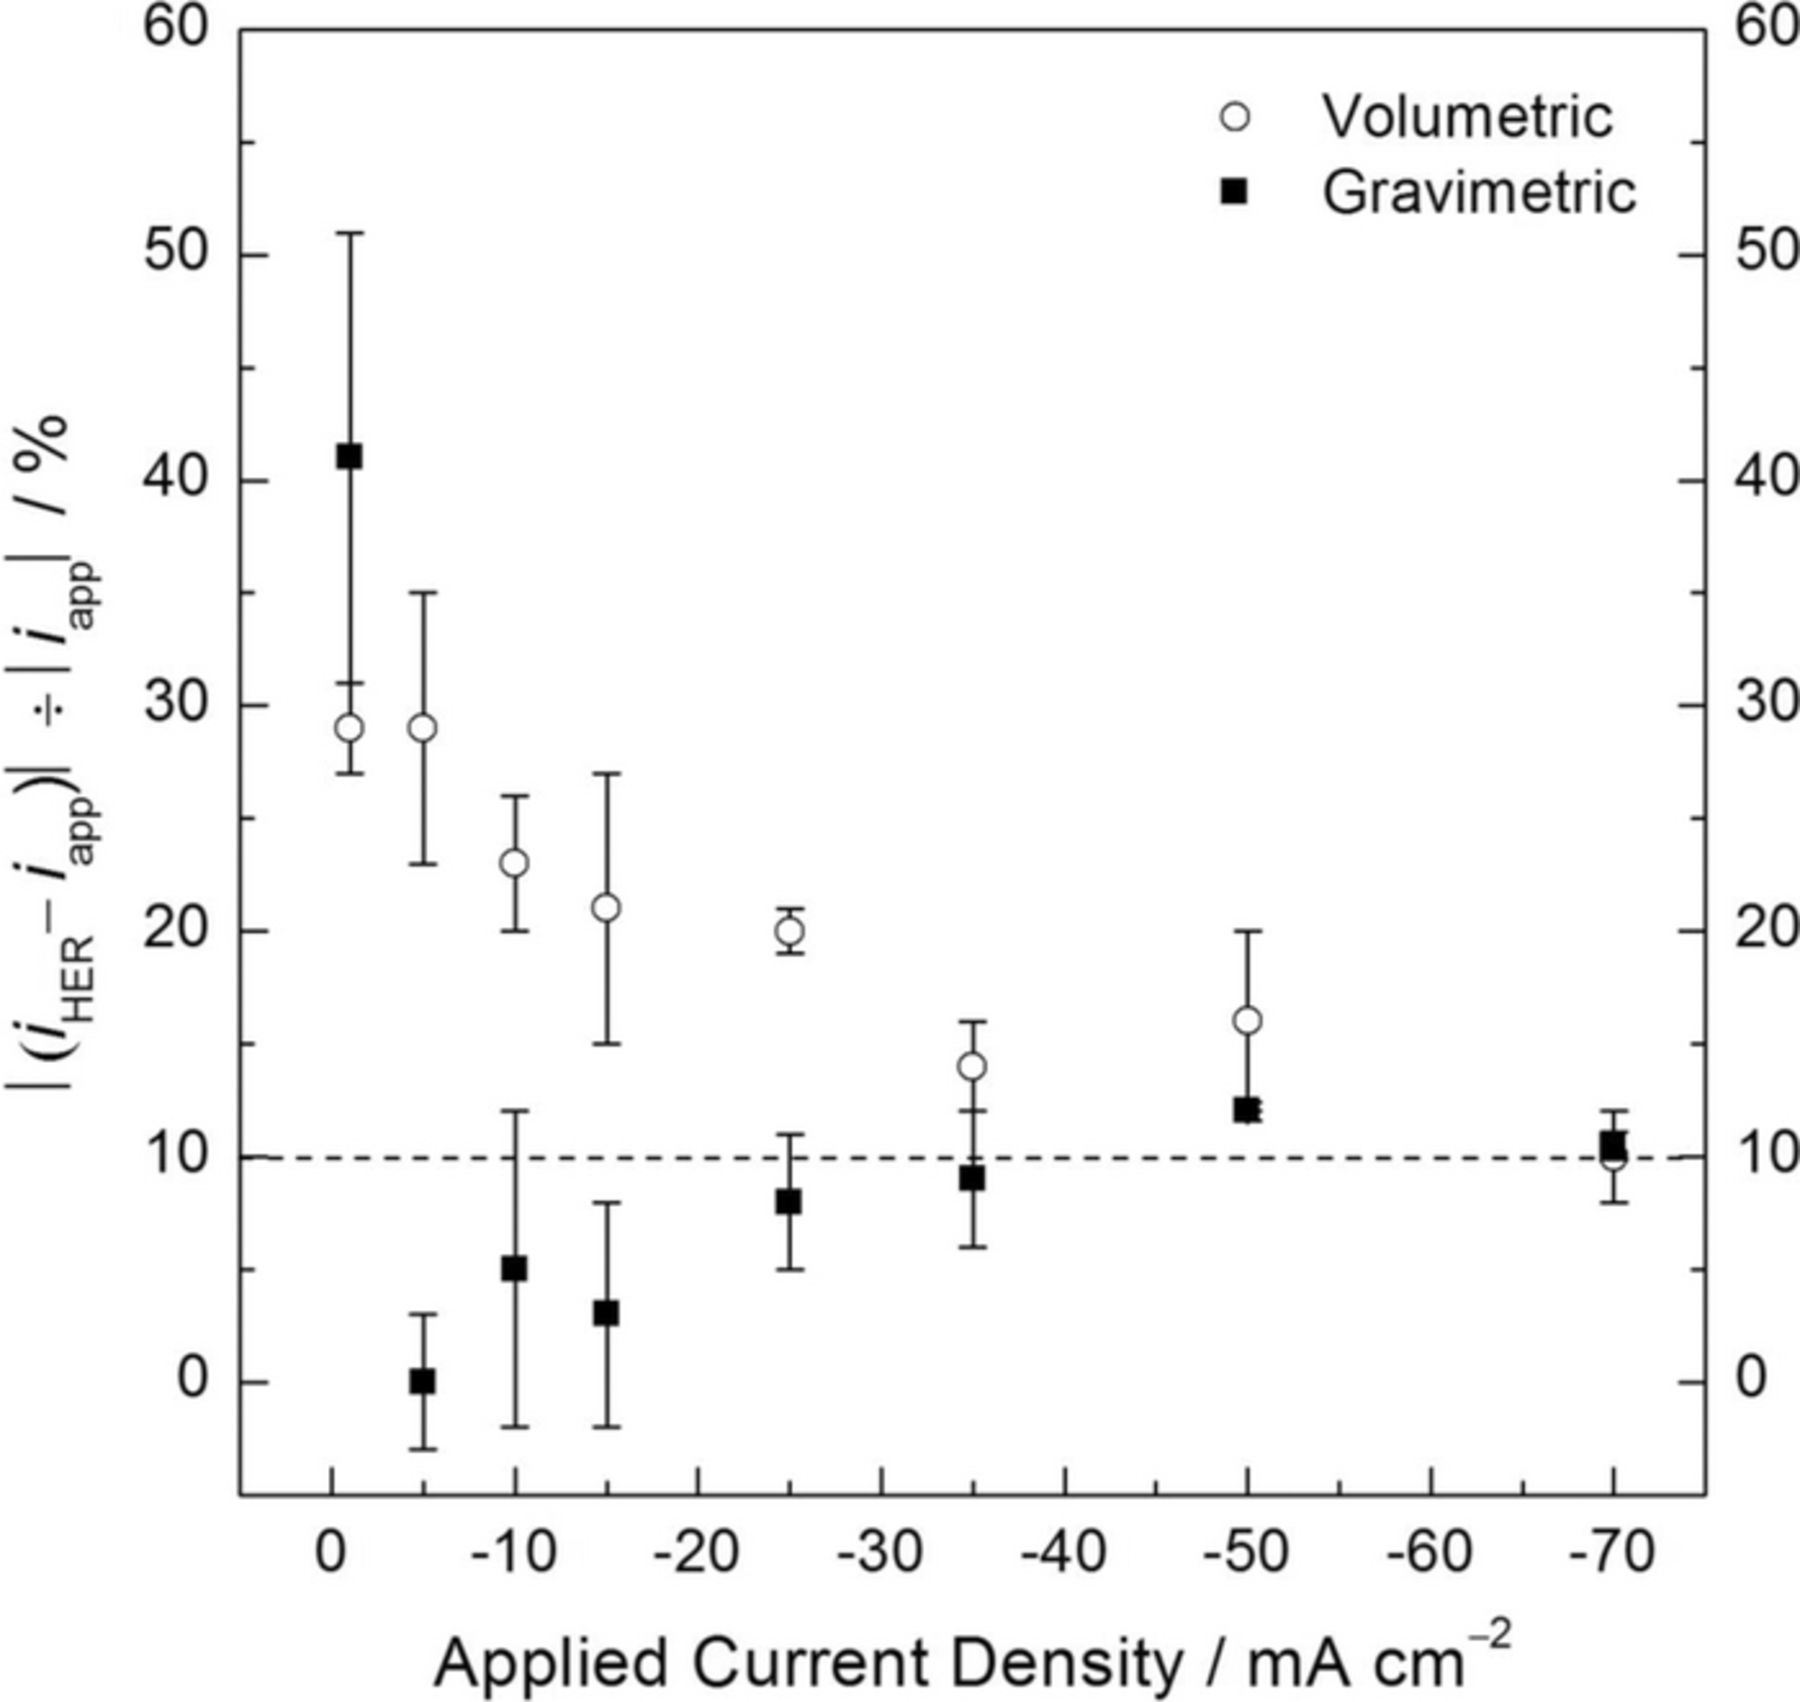
Figure 6. Absolute value of the percentage error for the calculated current density values associated with the HER as a function of the applied cathodic current density. The error bars are standard deviation.
Gravimetric measurements on dissolving Mg
Hydrogen evolution at the corrosion potential
Fig. 7a shows the volume of H2 collected at the Ecorr as a function of time in 0.1 M NaCl solution for the HP Mg electrode using the gravimetric experimental set-up. A 0.1 M NaCl solution was used to compare the results obtained using the gravimetric method with those previously reported using the volumetric method on the same HP Mg material as test specimen.12 For clarity and with the aim of evaluating the corrosion process, Fig. 7a shows representative results from replicated experiments, which were similar. Fig. 7a also shows the evolution of the Ecorr as a function of time. The volume of H2 collected increased rapidly within the first hour of immersion, exhibiting a constant rate after about 2 h of experimentation. The evolution of the Ecorr is in agreement with this behavior, exhibiting a stable potential value of circa –1.6 VSCE after the electrode was immersed in the electrolyte for approximately 2 h. When the evolution of the H2 volume collected at the Ecorr using the gravimetric method is compared with that obtained by the volumetric method,12 significant differences were exhibited (see Fig. 7b). Approximately 10 h of immersion were needed to start observing linearity in the volumetric data, although experimental timeframes of about 2–3 days were needed to determine a steady state value for the corrosion rate. Very similar immersion times were also reported in a previous work using the same HP Mg material.15 However, significantly shorter experimental times were required using the gravimetric method, where an 8 h period was enough to calculate a reliable corrosion rate value. Furthermore, almost no H2 volume was collected using the volumetric method within the first 8 h of immersion.12
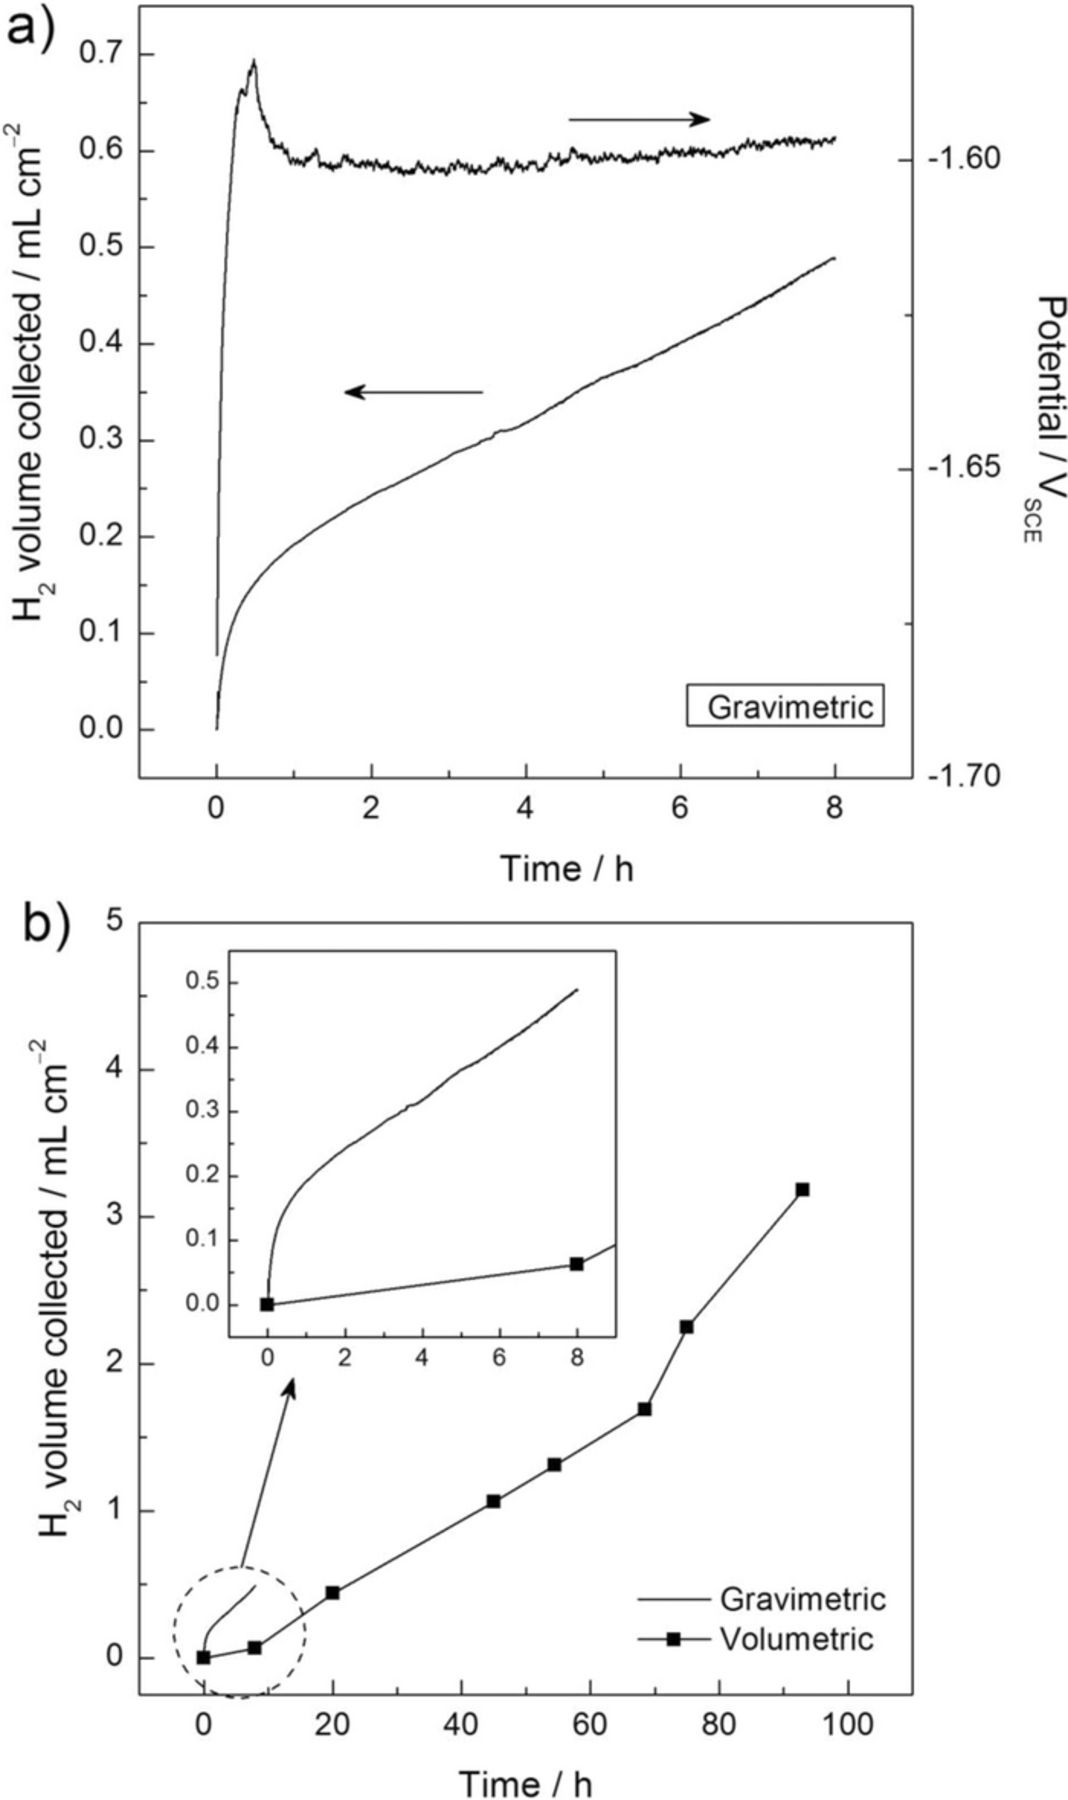
Figure 7. Volume of hydrogen collected and corrosion potential as a function of time for the high purity Mg electrode at the Ecorr using (a) the gravimetric setup for HE collection and (b) the volumetric setup for HE collection taken from12 where the HE current density values from (a) are included for comparative purposes. The solution was 0.1 M NaCl. Typical data from replicated experiments are presented. Points were taken every 5 s. Reprinted with permission from Elsevier.
Fig. 8 shows corrosion current density for the HP Mg for the different methods in 0.1 M NaCl solution at the Ecorr. Current density values were calculated from the steady state HE rates. A slightly higher average icorr value was obtained using the gravimetric method, but this difference is only about 10 μA/cm2 and can be considered insignificant. However, it should be stressed that significantly shorter experimental times were needed to carry out the icorr determination using the gravimetric method. These results confirm the higher sensitivity to HE detection of the gravimetric method with respect with the traditional volumetric method, exhibiting a better suitability for corrosion current determination on Mg and its alloys. Furthermore, in contrast with the volumetric method, the higher resolution of the gravimetric method when monitoring the corrosion process allows accurately differentiation of any possible variation in the instant corrosion rate that the electrode may experience during the time of experimentation. The high sensitivity of the gravimetric method for H2 collection is worth noting, as current values of the order of tens of microamperes were detected.
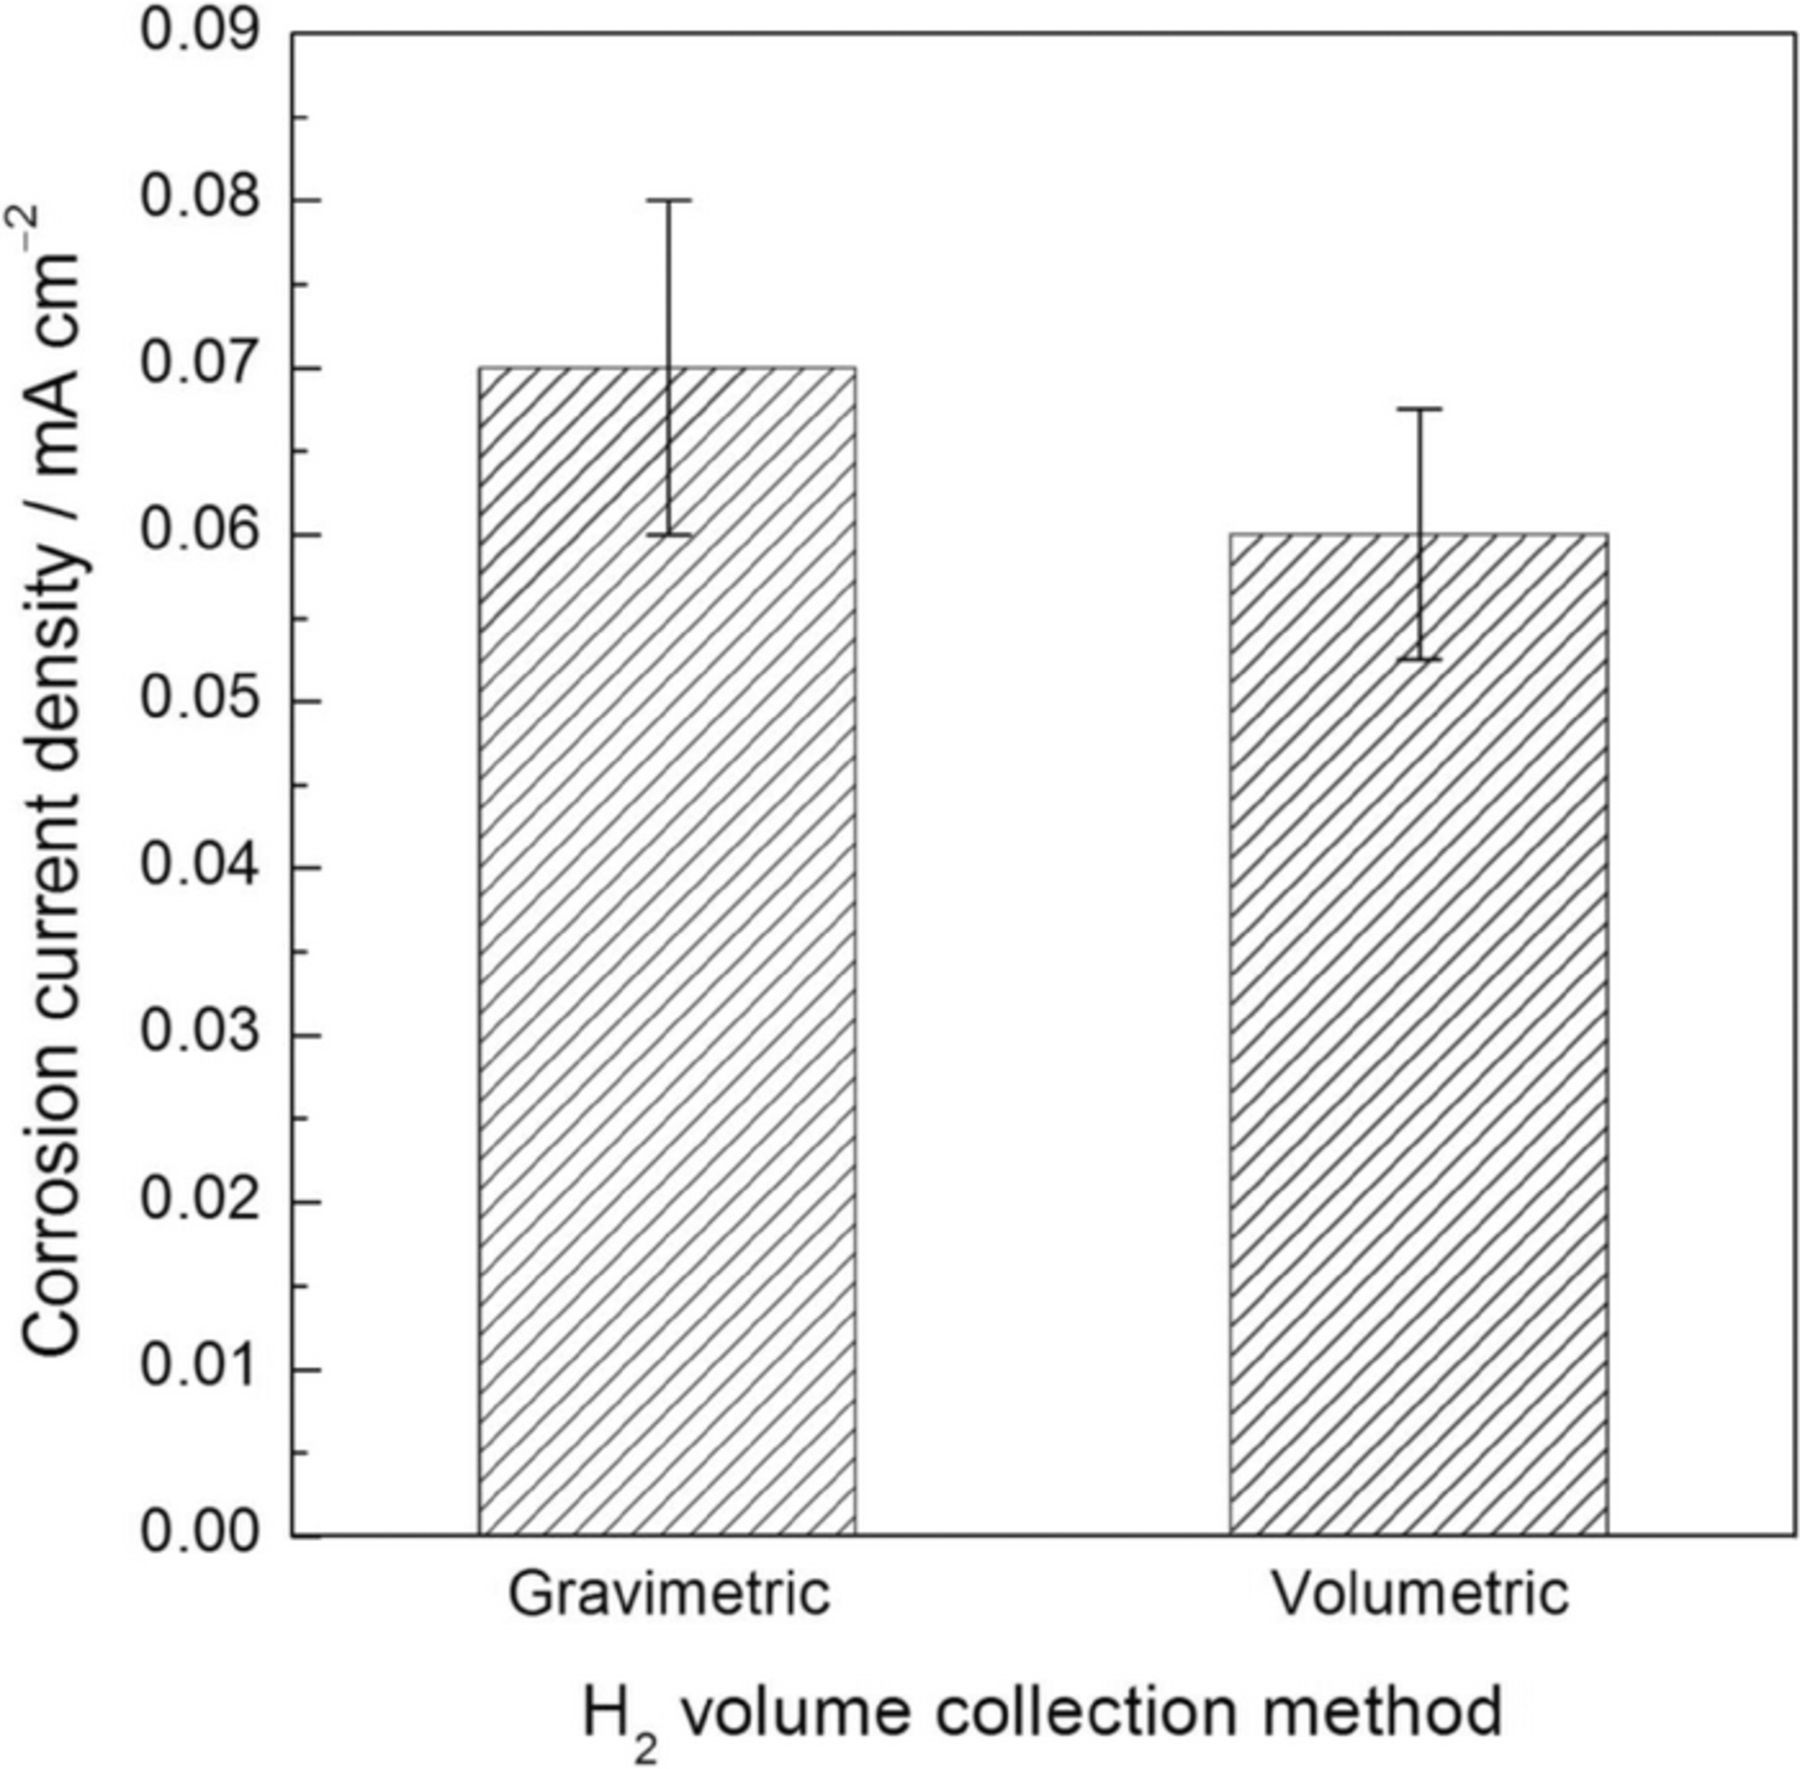
Figure 8. Corrosion current density for the high purity Mg electrode in 0.1 M NaCl solution as a function of the H2 volume collection method. Current density values were calculated from the steady state HE rates during immersion at the Ecorr. Current density values for the volumetric method from Ref. 12. The error bars are standard deviation.
Anodic hydrogen evolution under galvanostatic polarization
Fig. 9 shows the volume of H2 collected during the application of different anodic current densities as a function of time in 0.1 M NaCl solution for the HP Mg electrode using the gravimetric experimental set-up. As commented above, results will be compared with those obtained using the volumetric method on the same HP Mg as test specimen.12 As previously shown for the Pt foil electrode (see Fig. 4), a linear-like response was exhibited during the whole time of experimentation. This is particularly relevant for the lower current densities, where reliable results were obtained even within the first minute of polarization, in contrast with the results exhibited when the volumetric method was used where lower rates were exhibited in the early times of measurement (as previously reported in Ref. 12). These results confirm the higher sensitivity to HE detection of the gravimetric method with respect to the traditional volumetric method when Mg is subjected to anodic polarization. Furthermore, the observation of a constant anodic HE rate from the early stages of polarization (when no corrosion product was visually detected on the electrode surface) presents important implications regarding some of the current interpretations on the mechanism of this phenomenon. Nevertheless, discussion about the origins of anodic H2 on Mg is not the aim of this paper.
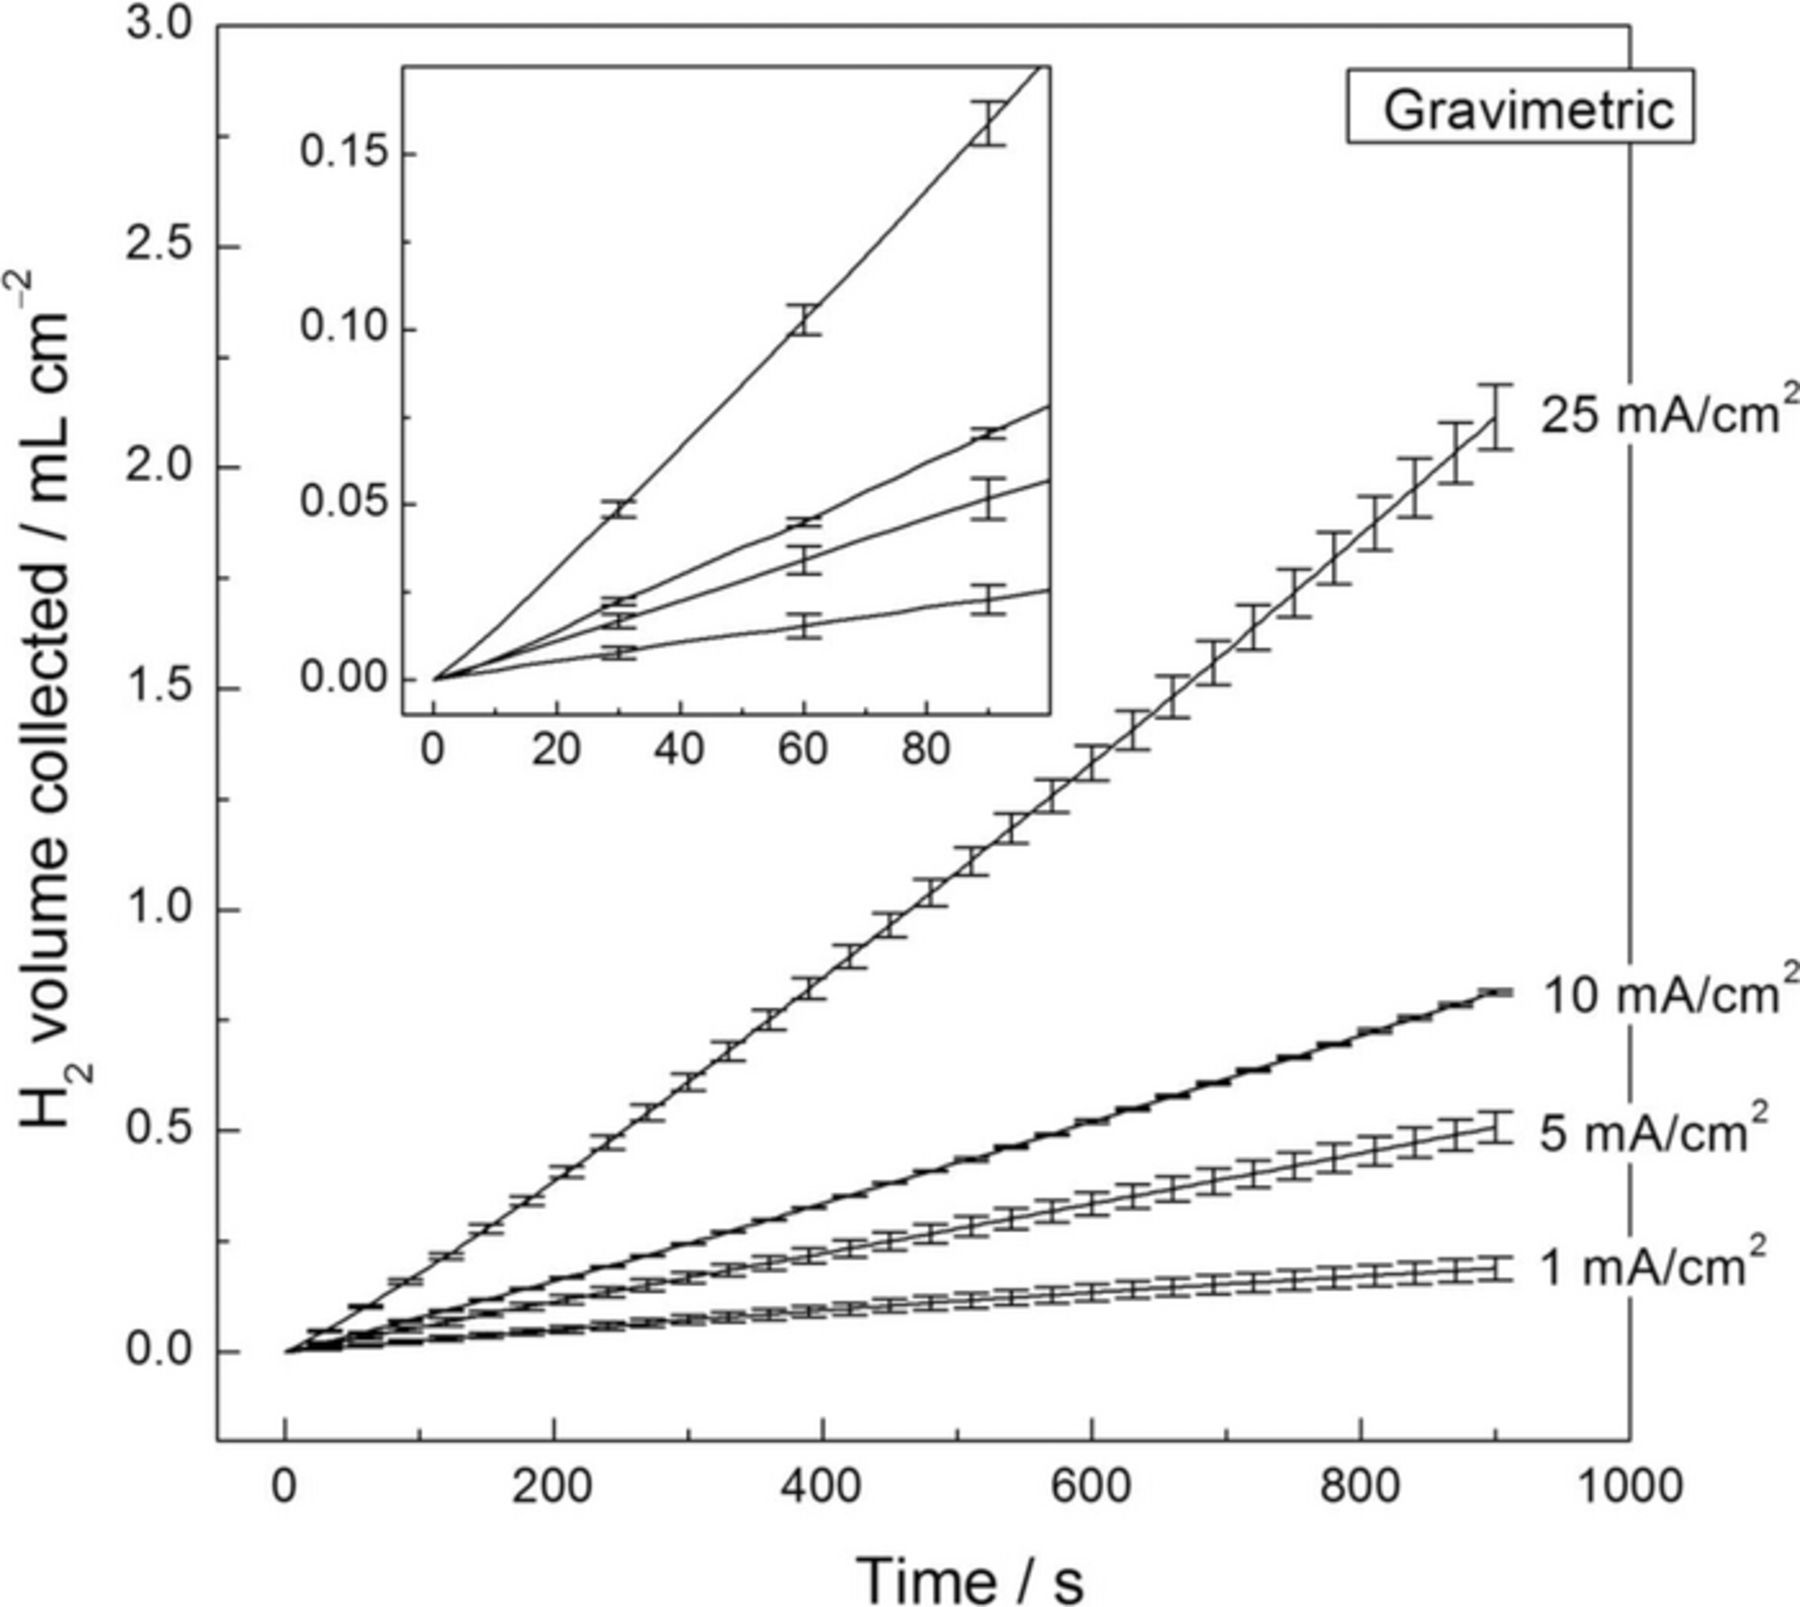
Figure 9. Volume of hydrogen collected as a function of time for the high purity Mg electrode using the gravimetric setup for HE collection. The solution was 0.1 M NaCl. Each current density was applied for 900 s. Points were taken every 5 s. The error bars are standard deviation.
Fig. 10 shows HE current density values for the HP Mg specimen determined from the linear fits of the curves in Fig. 9 plotted as current densities as a function of the applied anodic current density. Fig. 10 also shows the current density values associated with HE for the HP Mg electrode determined using the volumetric method for comparative purposes.12 A linear-like behavior was observed for both H2 collection methods over the whole range of anodic current densities applied. Note that an analysis analogous to that shown in Fig. 6 to determine the accuracy of the HE current density values using the gravimetric method could not be performed because a 1:1 relation in current is not expected when anodic polarizations are applied. However, according to the accuracy results when the Pt foil electrode was used, it is reasonable to assume that the gravimetric method exhibited error values within 10%, which might be similar here. Higher HE current density values were measured by the gravimetric method. From the linear fits of the data, nearly 10% more H2 volume was detected using the gravimetric method than using the volumetric method. However, to evaluate the gravimetric method with respect to the traditional volumetric one, it is more useful to compare the differences between each individual iHER value determined by both H2 collection methods upon the application of a particular anodic current density. An average increase of 25 ± 8% in the current density values associated with the HER was exhibited using the gravimetric method. It is worth noting that the HE current density values using the volumetric method were determined by passing a total net charge of 20 C at different anodic current densities. This means that, with the exception of +25 mA/cm2, longer periods of current application were used for the volumetric method than for the gravimetric method. This difference was significantly higher for the lowest current densities applied where, for the case of +1 mA/cm2, a 19X increase in current application time was used between the volumetric and the gravimetric methods. These results show the higher suitability of the gravimetric method with respect to the traditional volumetric method for the study of anodic H2 on Mg and its alloys. Additionally, the gravimetric method appears to be also suitable for the study of anodic H2 on other materials where this effect has been reported such as Al and Al alloys.24–26
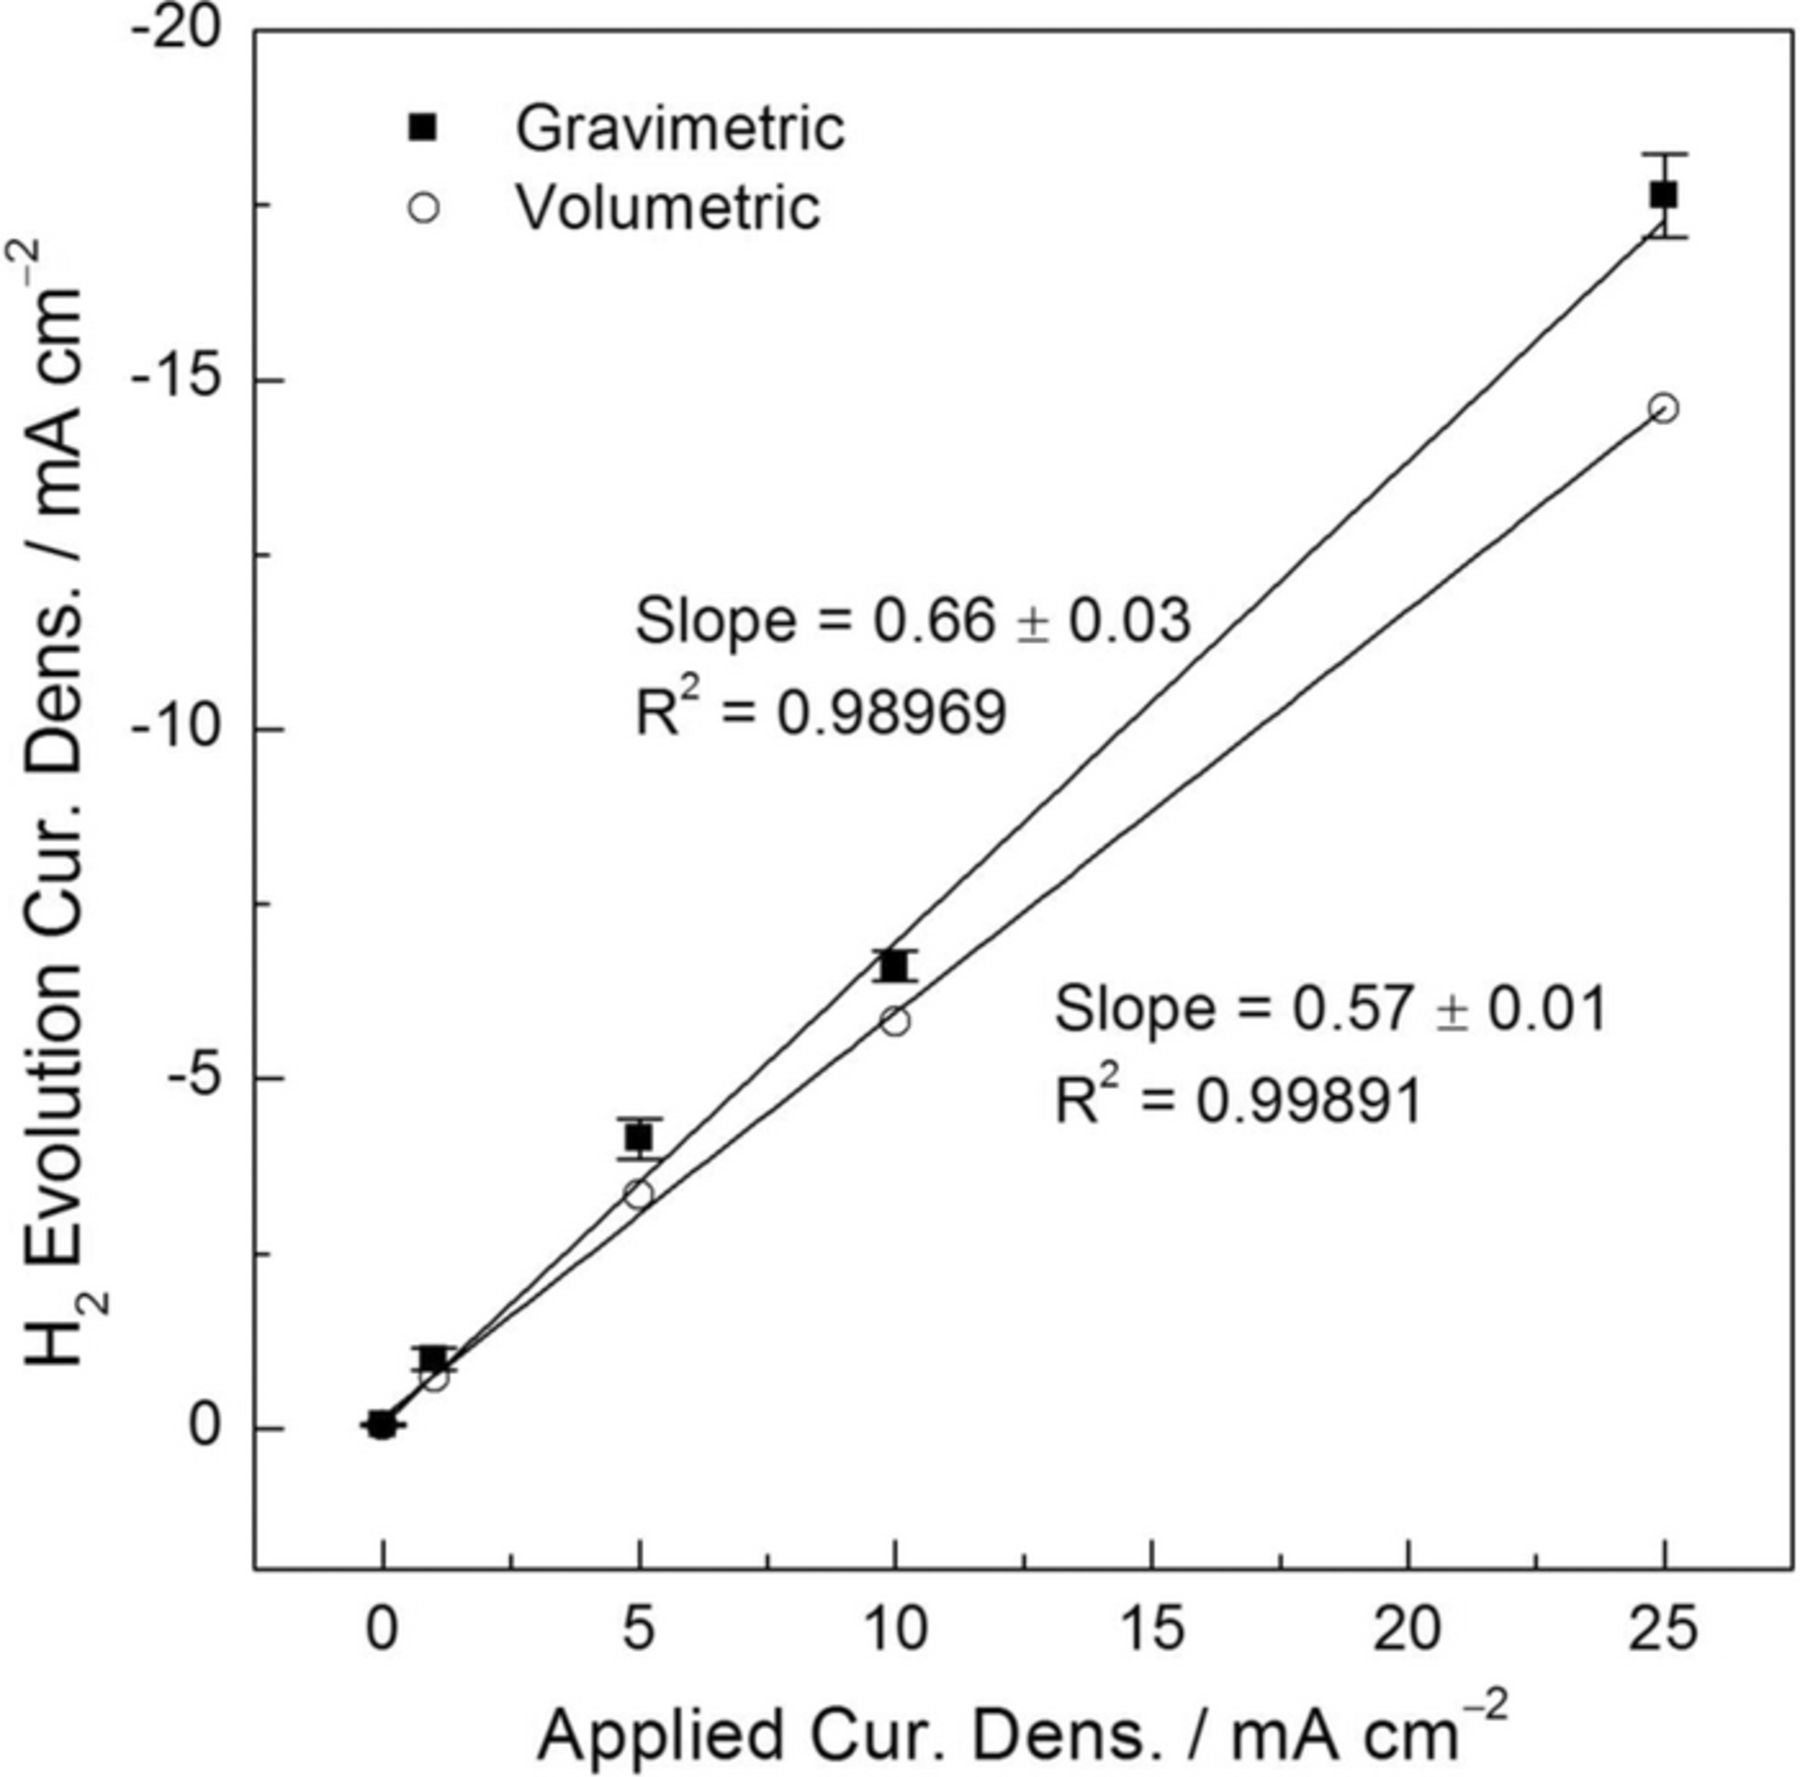
Figure 10. Current density associated with HE for the high purity Mg electrode in 0.1 M NaCl solution as a function of the applied current density using the gravimetric (squares) and the volumetric (circles) methods. Current density values for the gravimetric method were calculated from the steady state HE rates during galvanostatic polarization measurements in Fig. 9. Current density values for the volumetric method were taken from Ref. 12. The error bars are standard deviation. Reprinted with permission from Elsevier.
Hydrogen evolution detection under galvanodynamic polarization
An interesting characteristic of the gravimetric method is that, in contrast with the traditional volumetric one, it allows for real-time HE detection during dynamic polarization. Galvanodynamic testing was performed instead potentiodynamic polarization for the same reason that galvanostatic instead of potentiostatic polarization is often used: controlling the applied current allows for easy comparison with the rate of HE. Fig. 11 shows the galvanodynamic polarization response of the HP Mg in 0.1 M NaCl solution plotted against the measured potential. Fig. 11 also shows the absolute value of the calculated current densities for the HER obtained during polarization using the gravimetric method. These experiments were carried out in a quiescent electrolyte and in separate scans (i.e. anodic and cathodic polarizations). Representative results from replicated experiments are presented. The potential values presented are not corrected for ohmic potential drop.
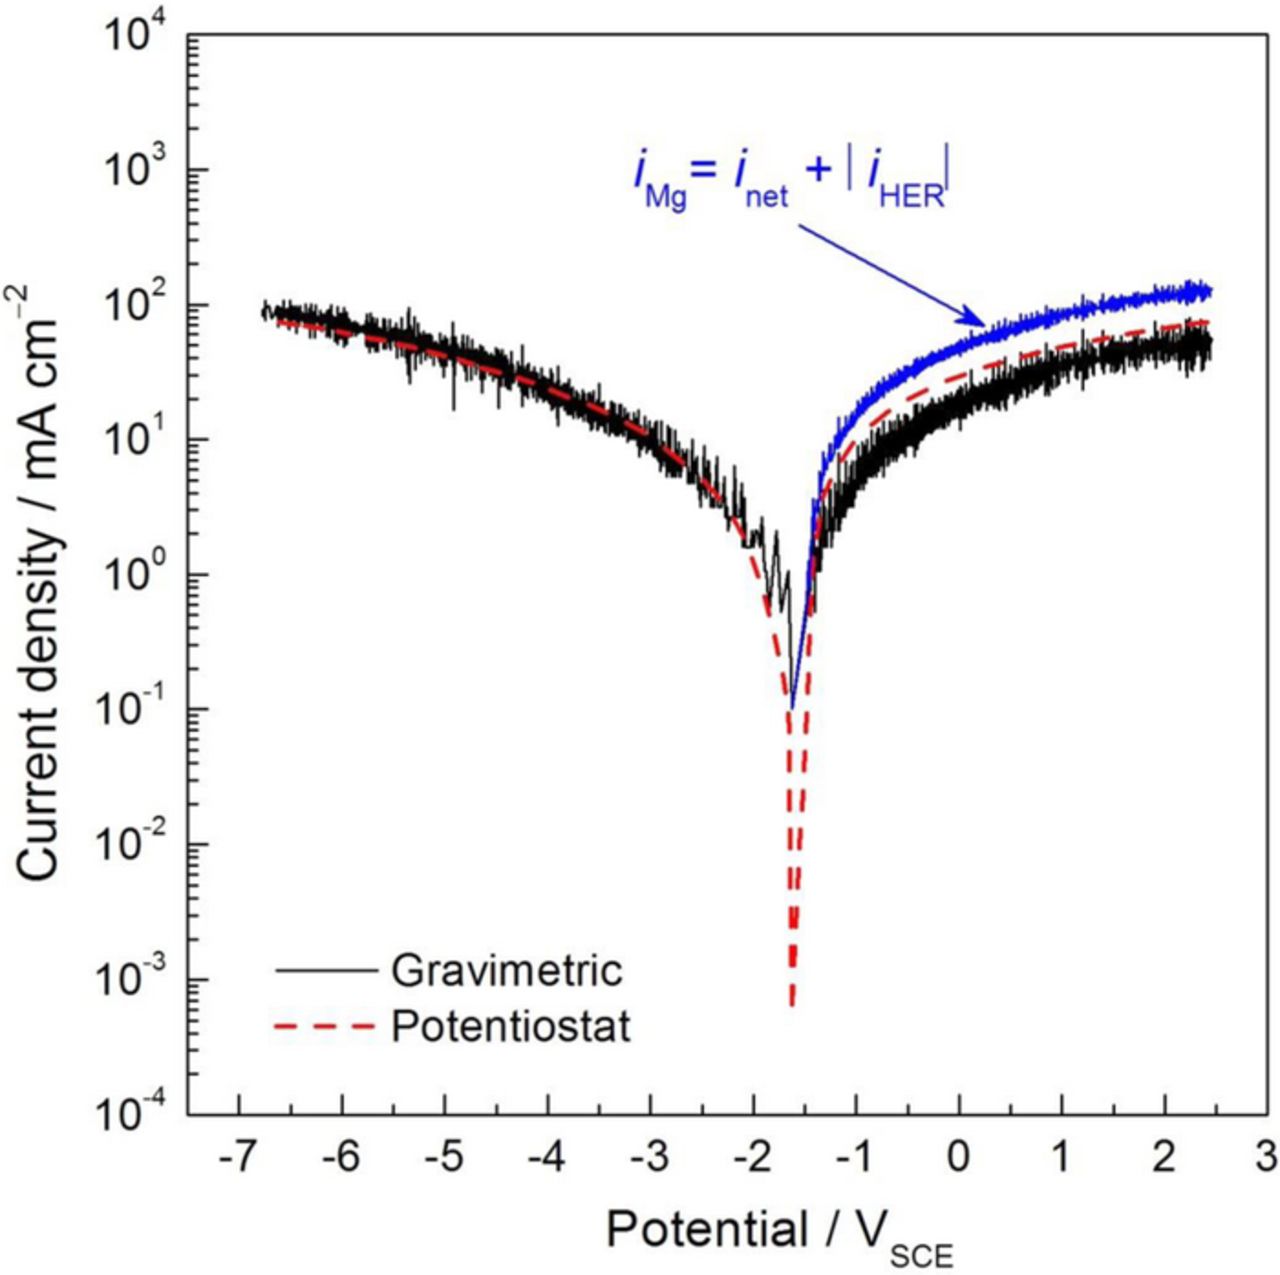
Figure 11. Galvanodynamic polarization curve for the HP Mg electrode in 0.1 M NaCl solution as a function of the measured potential. Experiments performed in separate as a function of the polarity applied at a scan rate of 0.1 mA/cm2 s. Dashed lines are typical net current density values obtained by the potentiostat during galvanodynamic polarization. Solid lines are representative of the absolute value of the HE current densities calculated from gravimetric measurments during galvanodynamic polarization. Potential values are not corrected for ohmic potential drop.
As shown by Curioni,21 during cathodic polarization a very good correspondence between the HE current densities and those measured by the potentiostat was exhibited. This behavior validates the use of the gravimetric method for H2 collection during dynamic polarization measurements. When anodic currents were applied to the electrode, the current density values associated with HE presented lower values than those measured by the potentiostat during galvanodynamic polarization. It should be noted that the curve registered by the potentiostat corresponds to the net current of the HP Mg, whereas the current density values from the gravimetric method are associated with the local cathodic reaction, HE, taking place across the full range of potential (both above and below the OCP), and were calculated from the HE at the working electrode. During the anodic polarization of Mg, a cathodic current density associated with HE was measured because some of the electrons generated by the Mg oxidation reaction (Eq. 1) did not flow through the potentiostat to the counter electrode but rather were consumed by the HER on the Mg electrode surface, thus the net anodic current density applied was lower that the anodic current density associated with Mg oxidation. Using the accurate gravimetric detection of the HE current density, the total Mg dissolution current density is easily determined by the addition of the net anodic and the HE current densities. As observed in Fig. 11, the gravimetric method exhibited a very high sensitivity and resolution in HE detection during dynamic polarization and appears to be a reliable way for real-time monitoring the current density associated with Mg dissolution during anodic polarization.
More interestingly, when the absolute value of the HE current density values determined from the galvanostatic polarization experiments using the gravimetric method are plotted together with those calculated during the galvanodynamic measurements (Fig. 12), a very good correlation was observed over the whole range of potentials. Given that the HE rate exhibited a constant value from the beginning of the anodic current application (see Fig. 9), this indicates that, in a single galvanodynamic experiment, the current density value associated with HE at any applied current density of interest is easily determined by interpolation in a HE current density vs. applied current density plot. Therefore, the gravimetric method represents a quicker as well as a more reliable and straightforward procedure for the study of anodic H2 on Mg and its alloys than the volumetric method. This is particularly useful not only when short timescales are needed but, more importantly, when limited amount of material is available to carry out a study over a large range of applied current densities.
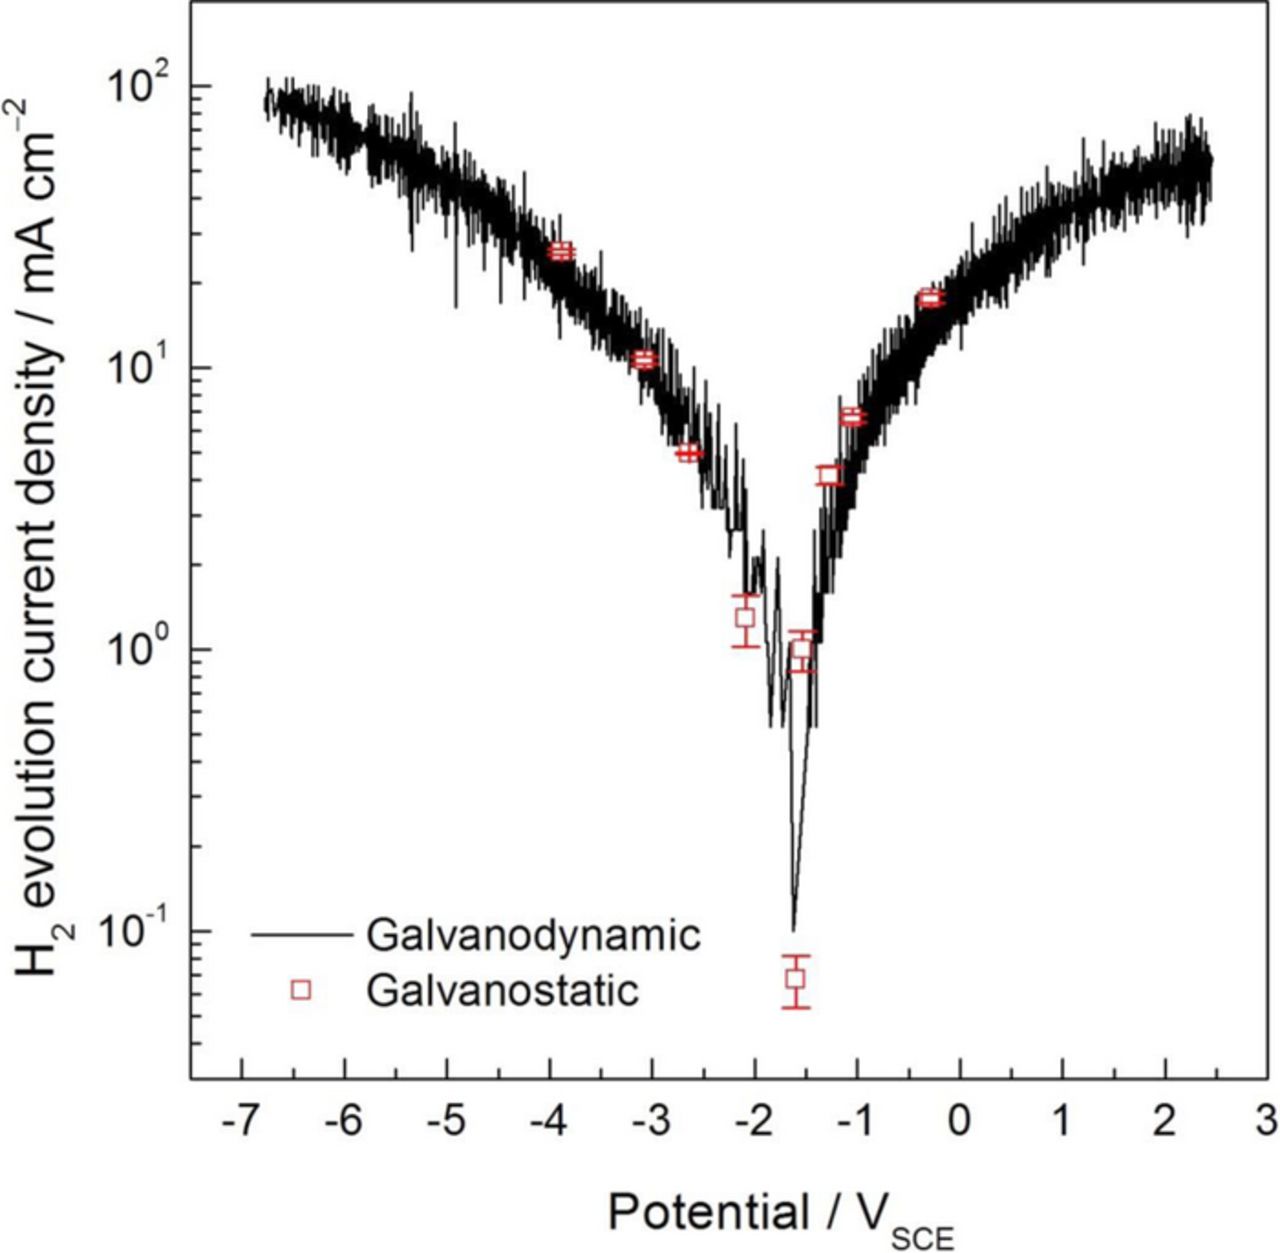
Figure 12. Absolute value of the current density associated with HE for the HP Mg electrode in 0.1 M NaCl solution as a function of the measured potential during galvanodynamic polarization measurements, taken from Fig. 11. Open squares are the absolute value of the current density associated with HE for the HP Mg electrode in 0.1 M NaCl solution as a function of the measured potential during galvanostatic polarization measurements, taken from Fig. 10. The gravimetric method for H2 collection was used for the determination of both sets of currents.
Conclusions
A new gravimetric method for H2 volume collection, based on that presented first by Curioni, and its suitability for the study of dissolving Mg surfaces were evaluated by means of open circuit, galvanostatic and galvanodynamic measurements in chloride containing solutions. The following can be concluded:
- The gravimetric method exhibited higher accuracy for HE detection than the traditional volumetric method when cathodic currents were applied on a pure Pt electrode.
- The gravimetric method exhibited higher sensitivity in HE detection than the traditional volumetric method for corrosion rate determination on dissolving Mg at the free corrosion potential, allowing instant corrosion rate monitoring during the process. Significantly lower experimental times were needed to determine reliable results.
- The gravimetric method exhibited higher suitability than the volumetric method for the study of anodic HE on anodically polarized Mg surfaces, showing a linear-like response from the initial stages of experimentation.
- The gravimetric method allowed real-time H2 volume collection during dynamic polarization measurements. A very high resolution in dynamic HE detection was exhibited.
- Real-time HE currents during dynamic polarization exhibited comparable values to those determined by galvanostatic experiments, providing complete information of anodic HE rate over a range of applied current density values of interest.
- The gravimetric method exhibited very high reproducibility.
Acknowledgments
The authors thank Prof. Nick Birbilis for supplying the HP Mg and Mr. Zhiyuan Feng for his help in the lab.