Abstract
This paper illustrates the application of dynamic optimization in obtaining the optimal current profile for charging a lithium-ion battery by restricting the intercalation-induced stresses to a pre-determined limit estimated using a pseudo 2-dimensional (P2D) model. This paper focuses on the problem of maximizing the charge stored in a given time while restricting capacity fade due to intercalation-induced stresses. Conventional charging profiles for lithium-ion batteries (e.g., constant current followed by constant voltage or CC-CV) are not derived by considering capacity fade mechanisms, which are not only inefficient in terms of life-time usage of the batteries but are also slower by not taking into account the changing dynamics of the system.
Export citation and abstract BibTeX RIS

This is an open access article distributed under the terms of the Creative Commons Attribution Non-Commercial No Derivatives 4.0 License (CC BY-NC-ND, http://creativecommons.org/licenses/by-nc-nd/4.0/), which permits non-commercial reuse, distribution, and reproduction in any medium, provided the original work is not changed in any way and is properly cited. For permission for commercial reuse, please email: oa@electrochem.org.
Lithium-ion chemistries are attractive for many applications due to high cell voltage, high volumetric and gravimetric energy density (100 Wh/kg), high power density (300 W/kg), good temperature range, low memory effect, and relatively long battery life.1–3 Capacity fade, underutilization, and thermal runaway are the main issues that need to be addressed in order to use a lithium-ion battery efficiently and safely over a long life.
In order to address the aforementioned issues and increase battery utilization, smarter battery management systems are required which can exploit the dynamics of a battery to derive better operational strategies. Recognizing the potential of reducing the weight and volume of these batteries by 20–25% for vehicular applications, the Department of Energy has recently initiated a $30M program through ARPA-E named Advanced Management and Protection of Energy Storage Devices (AMPED).4
The use of physically meaningful models in deriving these strategies has received attention. Methekar et al.5 looked at the problem of energy maximization for a set time with constraints on voltage using Control Vector Parametrization (CVP). Klein et al.6 considered the minimum-time charging problem while including constraints on temperature rise and side reactions. Rahimian et al.7 calculated the optimal charging current as a function of cycle number for a lithium-ion battery experiencing capacity fade using a single-particle model (SPM).8 Hoke et al.9 used a lithium-ion battery life-time model to reduce battery degradation in a variable electricity cost environment using the SPM. Previous efforts included the derivation of optimal charging profiles considering various phenomena that account for capacity fade separately (plating over-potential at the anode,13 side reaction during charging,6 thermal degradation,10 intercalation-induced stress using SPM11 etc.). Fracture of solid electrode particles due to intercalation induced stresses is one of the dominant capacity fade mechanics which affect the battery capacity in two ways:12 (1) It leads to loss of solid phase due to isolation from the electronically conducting matrix of electrode. (2) It also increases the surface area, which lead to SEI layer formation at the newly exposed area resulting in capacity fade. In addition, past efforts to minimize capacity fade using SEI layer or other mechanisms are reported elsewhere.7,13 Work done in Suthar et al.11 used the single-particle representation for a porous electrode to derive an optimal charging profile considering intercalation-induced stresses. This paper extends that work for higher charge/discharge rates by determining optimal charging profiles using the isothermal pseudo 2-dimensional model with stress-strain effect.
Model Description section gives a brief introduction to the pseudo two-dimensional (P2D) model and model reformulation. Stress-Related Problems with High Charging Rate section describes the stress-related problems associated with high rate charging. The optimal control problem is formulated in Problem Formulation section. Results and Discussion section discusses two scenarios of optimal charging profiles derived by placing constraints on the stresses developed. Conclusions and Future Directions section presents conclusions and future directions.
Model Description
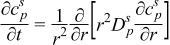
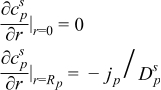
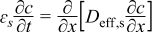
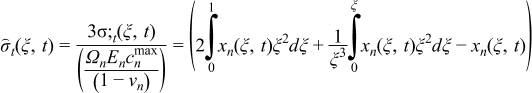
Detailed models that incorporate electrochemical, transport, and thermodynamic processes along with the geometry of the underlying system can be used to monitor and control the internal states of a battery.14–18 These electrochemical models tend to be computationally expensive, which has prohibited their use in the control and monitoring of internal states in real time. Several simplified/reduced electrochemical models have been proposed and control-relevant studies performed to try to address these issues.19–24 Efforts in optimal control and nonlinear model predictive control, incorporating a SPM and other reduced order models have been published.6,7 A mathematical reformulation method25–28 gives rise to a computationally efficient model that can be solved in milliseconds without compromising on accuracy. These reformulation techniques consist of spectral methods (specifically orthogonal collocation) where, depending on number of collocation points in the anode, separator, and cathode, models can be generated with varying degree of accuracy. The model used in the present study is derived using the reformulation methodology outlined in Northrop et al.25 with a change in basis (trial) functions in order to achieve better convergence properties at higher charging/discharging rates of battery operations. The change of trial functions to Chebyshev form provides more robustness albeit at a slightly more cost. This study uses a reformulated model derived based on Chebyshev polynomials29 as trial functions with 4 collocation points in both the anode and cathode, 2 collocation points in the separator, and 4 collocation points in the radial direction inside the solid particles (see Figure 1). The resulting system of equations, along with equations to represent radial and tangential stresses in solid particles of the anode, consists of 88 differential algebraic equations (DAEs). This system of DAEs is developed by discretizing the spatial derivatives using orthogonal collocation to ensure the time remains as the only independent variable. This allows for optimized time stepping algorithms to be used and results in 50 ordinary differential equations (ODEs) and 38 algebraic equations. Variables involved in the current study are summarized in Table I. These variables (other than peak radial and peak tangential stresses) also act as coefficients of the polynomials that express the profiles across x and radial directions. Table II lists the equations for the isothermal porous electrode P2D model. Table III presents various expressions used in the model.
Table I. Summary of variables involved in this present study (Pi refers to separator-anode interface).
| Collocation points | |||||
|---|---|---|---|---|---|
| Variable | Anode | Separator | Cathode | Radial | No. of Equations |
| ODE | |||||
| Solid Phase concentration | 4 | N/A | 4 | 4 | 32 |
| Average solid phase concentration | 4 | N/A | 4 | N/A | 8 |
| Electrolyte concentration | 4 | 2 | 4 | N/A | 10 |
| Algebraic | |||||
| Voltage across battery | 1 | ||||
| Electrolyte potential | 4 | 2 | 4 | 10 | |
| Solid phase potential | 4 | N/A | 4 | 8 | |
| Local pore wall flux | 4 | N/A | 4 | 8 | |
| Radial stress | 4+1(Pi) | 5 | |||
| Tangential stress | 4+1(Pi) | 5 | |||
| Plating over-potential | 1 (Pi) | 1 | |||
| Total Equations | 88 | ||||
Table II. Governing PDEs for the P2D model.
| Governing Equations | Boundary Conditions | |
|---|---|---|
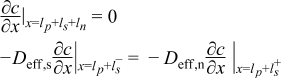
| Positive Electrode | ||
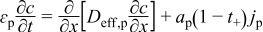 |  | (1.1) |
 |  | (1.2) |
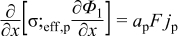 |  | (1.3) |
 |  | (1.4) |
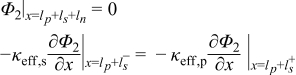
| Separator | ||
 | 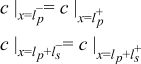 | (1.5) |
 | 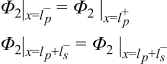 | (1.6) |
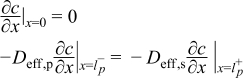
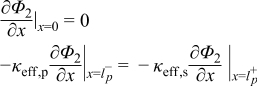
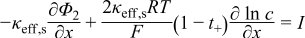
| Negative Electrode | ||
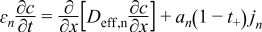 |  | (1.7) |
 |  | (1.8) |
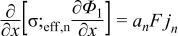 | 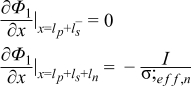 | (1.9) |
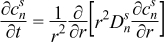 |  | (1.10) |
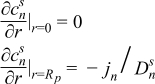
Table III. Additional expressions used in the P2D model.
 | (2.1) |
 | (2.2) |
 | (2.3) |
| σ;eff, i = σ;i(1 − εi − εf, i), i = p, s, n | (2.4) |
| Deff, i = Dεbruggii, i = p, s, n | (2.5) |
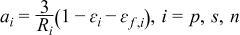 | (2.6) |
 | (2.7) |
 | (2.8) |
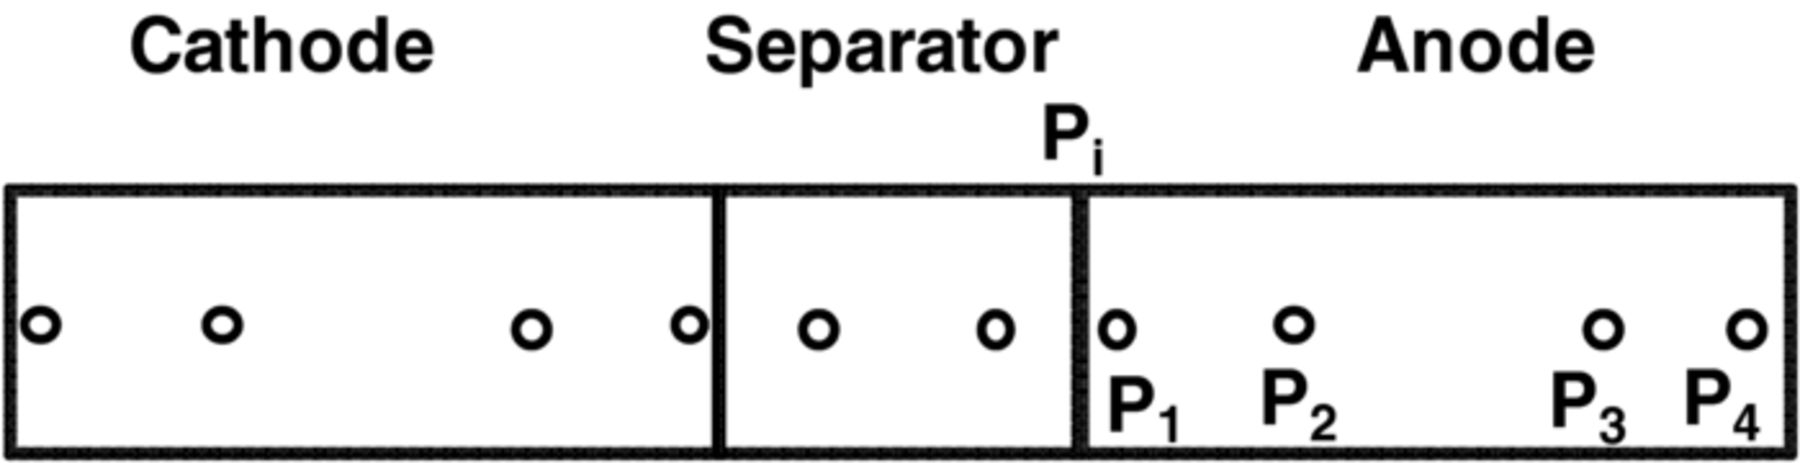
Figure 1. Collocation points across the electrodes (zeroes of Chebyshev-Gauss-Lobatto (CGL) polynomials, locations (approximate) in anode and cathode: 0.038, 0.309, 0.691, 0.962 and in separator: 0.146, 0.853).
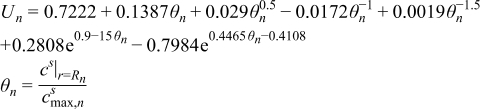
Various models, varying in their sophistication, have been proposed to quantify the intercalation-induced stresses in the solid particles. These models are divided in two categories: stress splitting30,31 and strain splitting.32–34 In this paper, a model presented by Cheng and Verbrugge32 is used. This stress model does not incorporate a moving boundary formulation and ignores thermodynamic factors and pressure-induced diffusion. These simplifications restrict its use to materials with very low volumetric expansion. The resulting equations describing radial stress (σr) and tangential stress (σt) generated in spherical particles are given in Table IV. In this paper, tensile stress is taken as positive and compressive stress is taken as negative. Here Ωn is the partial molar volume of the solute, En is the Young's modulus, and νn is the Poisson's ratio. Parameters values used in this paper are listed in Table V.
Table IV. Governing equations for intercalation-induced stress.
| Governing Equation | |
|---|---|
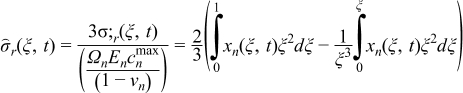 | (3.1) |
 | (3.2) |
Table V. List of parameters.
| Symbol | Parameter | Positive Electrodea | Separatora | Negative Electrodea | Units |
|---|---|---|---|---|---|
| ai | Particle Surface Area to Volume | 354000 | 144720 | m2/m3 | |
| Brugg | Bruggeman Coefficient | 1.5b | 1.5b | 1.5b | |
| csi, max | Maximum solid phase concentration | 51554 | 30555 | mol/m3 | |
| csi, 0 | Initial solid phase concentration | csp, max × 0.95 | csn, max × 0.105 | mol/m3 | |
| c0 | Initial electrolyte concentration | 1000 | 1000 | 1000 | mol/m3 |
| D | Electrolyte diffusivity | 7.5 × 10− 10 | 7.5 × 10− 10 | 7.5 × 10− 10 | m2/s |
| Dsi | Solid Phase Diffusivity | 1 × 10− 14 | 3.9 × 10− 14 | m2/s | |
| F | Faraday's Constant | 96487 | C/mol | ||
| ki | Reaction Rate constant | 2.33 × 10− 11 | 5 × 10− 10 | m2.5/(mol0.5 s) | |
| li | Region thickness | 80 × 10−6 | 25 × 10−6 | 88 × 10−6 | m |
| Rp, i | Particle Radius | 5 × 10⁻⁶b | 10 × 10−6b | m | |
| R | Gas Constant | 8.314 | J/mol/ K | ||
| Tref | Temperature | 298.15 | K | ||
| t+ | Transference number | 0.364 | |||
| εf, i | Filler fraction | 0.025 | 0.0326 | ||
| εi | Porosity | 0.385 | 0.724 | 0.485 | |
| σ;i | Solid phase electronic conductivity | 59 | 48.24 | S/m | |
| Ω | Partial molar volume | 4.0815 × 10⁻⁶c | m3/mol | ||
| E | Young's modulus | 15 × 109d | Pa | ||
| ν | Poisson's ratio | 0.3d |
aUnless otherwise noted, all parameters used for the electrodes and separator are from Ref. 27. bAssumed value. cValues obtained from Renganathan et al.34 dValues obtained from Christensen et al.12
Stress-Related Problems with High Charging Rate
Factors that may cause capacity fade include thermal degradation, side reactions (lithium plating, etc.), and mechanical degradation due to intercalation-induced stresses. This paper focuses on addressing the capacity fade associated with high anode stresses. Simulation results (voltage, current and radial and tangential stresses) of CC-CV charging with three different maximum charging rates (2C, 3C and 4C) are plotted in Figures 2, 3 and 4.
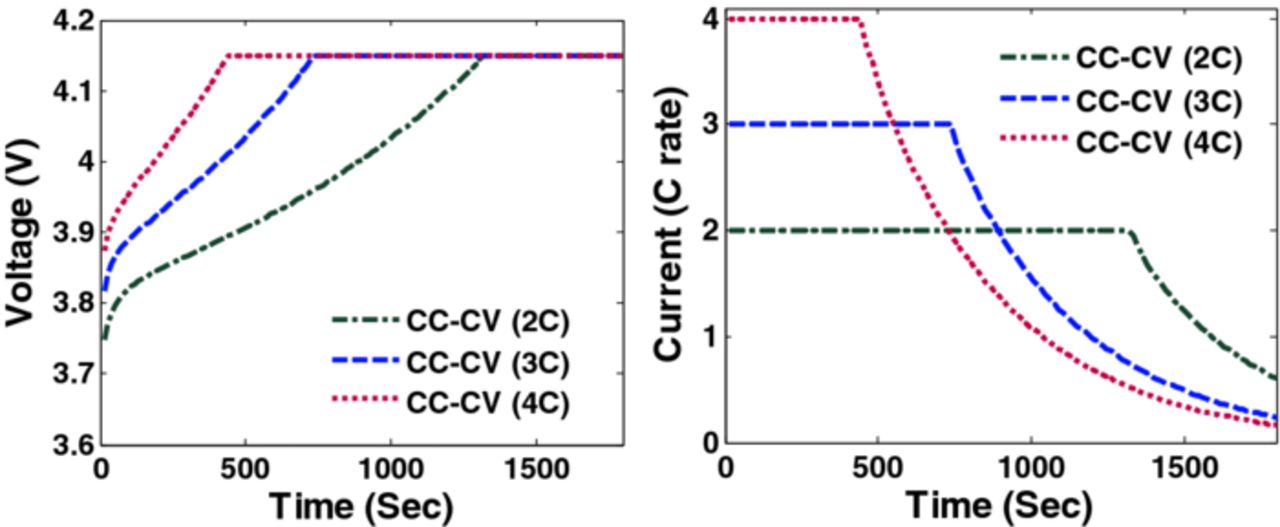
Figure 2. Voltage and current profiles during CC-CV charging with different C rate.
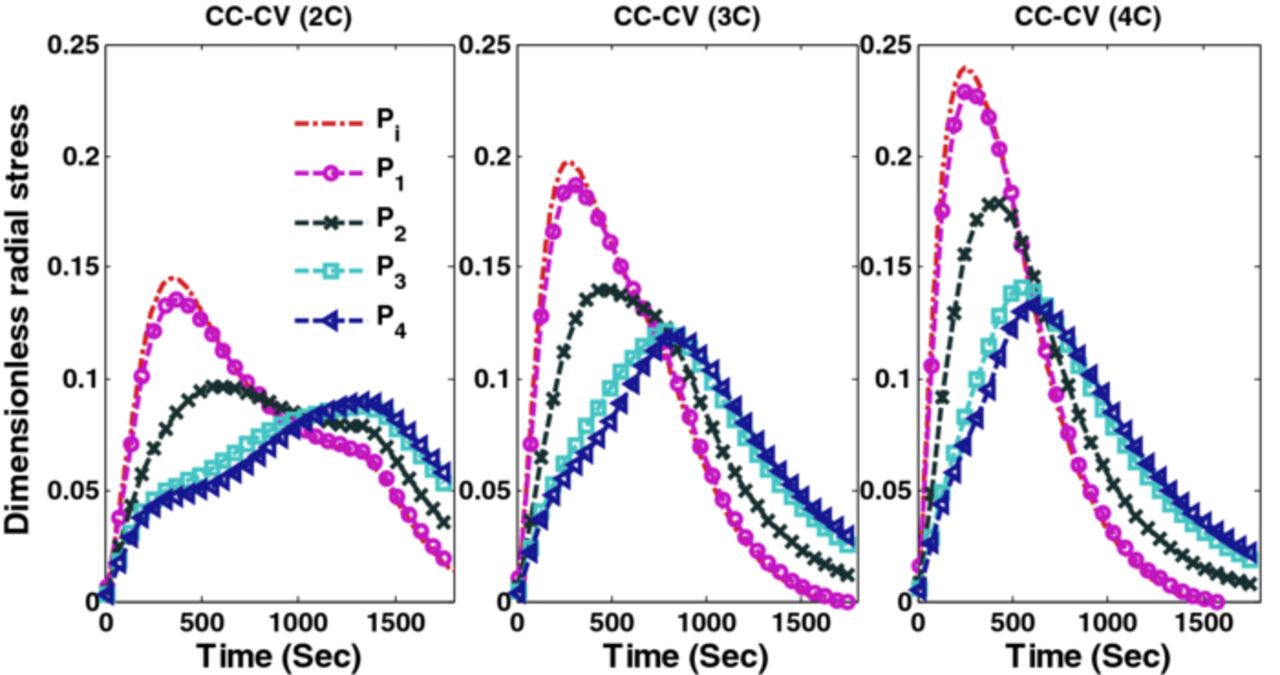
Figure 3. Radial stresses (tensile) at the center of the particles at the separator anode interface (Pi) and 4 collocation points are plotted for CC-CV charging at 2C, 3C, and 4C.
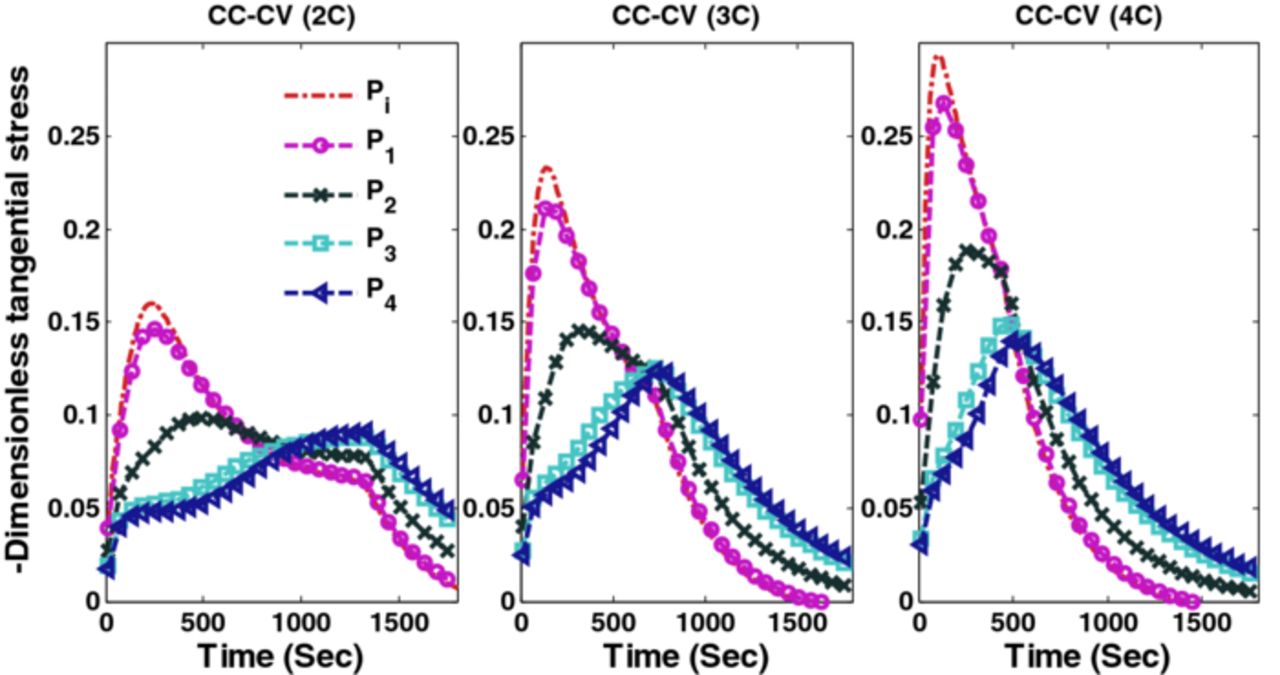
Figure 4. Tangential stresses (compressive) at the surface of the particles at the separator-anode interface (Pi) and 4 collocation points are plotted CC-CV charging at 2C, 3C, and 4C.
During intercalation, for the materials with positive volume expansion, radial stresses remain tensile throughout a particle (assuming zero external pressure at the surface) whereas tangential stress becomes compressive at the surface and tensile at the center. The peak (tensile) radial stress occurs at the center of the particle and peak (compressive) tangential stress occurs at the surface of the particle,30 hence peak (tensile) radial stresses at the center of the particles and peak (compressive) tangential stresses at the surface of the particles are monitored and controlled. As shown by Christensen and Newman30 and also clear from the formulas given in Table IV that the peak (tensile) tangential stresses and the peak (tensile) radial stresses are same at the center of the particles, hence controlling and monitoring one of them will be sufficient. Figure 2 shows the voltage and current profile for CC-CV charging with three different maximum currents.
Figure 3 shows the peak (tensile) radial stress at the center of the anode particles for different CC-CV protocols. Each graph in Figures 3 and 4 consists of five curves representing separator-anode interface (Pi) and 4 collocation points (P1, P2, P3, and P4, see Figure 1 for the location of collocation points). Peak tangential stress at the surface of the particle has a compressive nature (the negative of tangential stress is plotted). Figure 4 shows the peak (compressive) tangential stresses at the surface of the particles in three different CC-CV protocols at different points in the anode (separator-anode interface and 4 collocation points).
The stress profiles predicted using the P2D model differs significantly from the stress profiles predicted using a SPM. For the set of parameters used in the current study, the separator-anode interface achieves maximum current density at the beginning of charging. Figure 5 shows the distribution of pore wall flux across the anode at different points in time during CC-CV charging with maximum current of 2C. As charging proceeds, the intake from at the separator-anode interface reduces and other parts of the anode start to contribute more. This decrease in flux gives rise to relaxation of stress at the anode-separator interface at a later time. This relaxation is due to a decrease in the pore wall flux and not due to pressure-induced diffusion.
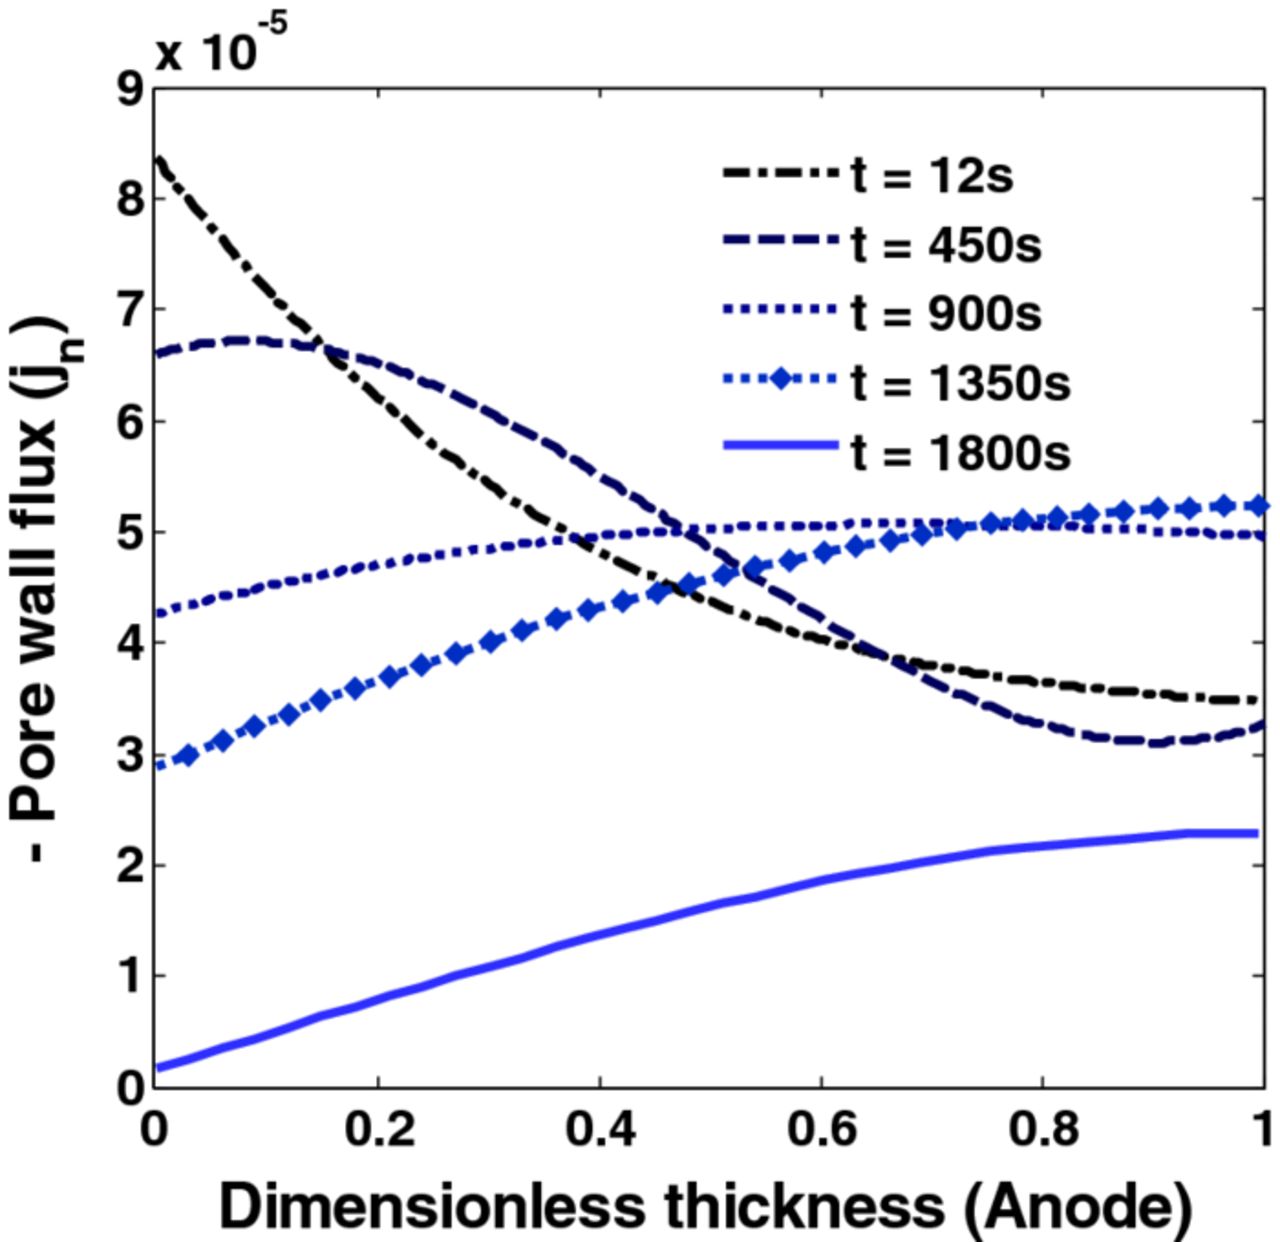
Figure 5. Pore wall flux for CC-CV charging with 2C. The separator-anode interface is at 0 on the horizontal axis.
It is clear from the above simulation that the peak radial stresses at the center of the particles and peak tangential stresses at the surface of the particles goes through extrema in time. The extremum values of these stresses occur at the anode-separator interface. This study focuses on restricting the extremum value of peak radial stresses and tangential stresses. Also, the tangential stresses at the surface of the particle show faster dynamics compared to radial stresses at the center.
Problem Formulation
This paper focuses on the maximization of charge transferred in a limited time with constraints placed on current, voltage, and stresses predicted with the reformulated P2D model. Numerous methods are available for solving constrained dynamic optimization problems, including (i) variational calculus, (ii) Pontryagin's maximum principle, (iii) control vector iteration, (iv) control vector parameterization, and (v) simultaneous nonlinear programming.35–37 Control vector parameterization (CVP) and simultaneous nonlinear programming are commonly used strategies that employ nonlinear programming (NLP) solvers. This paper uses the simultaneous nonlinear programming approach.
Consider the optimal charging profile with fixed final time under the objective of maximization of the charge stored (Q). The optimal control problem of interest can be formulated as:
![Equation ([1])](https://content.cld.iop.org/journals/1945-7111/161/11/F3144/revision1/jes_161_11_F3144eqn1.jpg)
subject to:
![Equation ([2])](https://content.cld.iop.org/journals/1945-7111/161/11/F3144/revision1/jes_161_11_F3144eqn2.jpg)
![Equation ([3])](https://content.cld.iop.org/journals/1945-7111/161/11/F3144/revision1/jes_161_11_F3144eqn3.jpg)
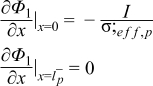
Where iapp is the applied current (A), tf is the final time (s), V(t) is voltage across the battery (V),  and
and  are radial and tangential stresses (dimensionless), and
  and
and  are restrictions on the extremum stress. Using mathematical reformulation techniques, the PDE model is converted to a system of DAEs which is then converted to a system of nonlinear algebraic equations by performing temporal discretization. An Euler backward discretization scheme is used to convert the reformulated P2D model into a system of nonlinear algebraic equations. Moreover, bounds on only the peak radial stresses at the center and peak tangential stresses at the surface of the particles are placed. The discretized form of this problem statement takes the form
![Equation ([4])](https://content.cld.iop.org/journals/1945-7111/161/11/F3144/revision1/jes_161_11_F3144eqn4.jpg)
such that:
![Equation ([5])](https://content.cld.iop.org/journals/1945-7111/161/11/F3144/revision1/jes_161_11_F3144eqn5.jpg)
![Equation ([6])](https://content.cld.iop.org/journals/1945-7111/161/11/F3144/revision1/jes_161_11_F3144eqn6.jpg)
![Equation ([7])](https://content.cld.iop.org/journals/1945-7111/161/11/F3144/revision1/jes_161_11_F3144eqn7.jpg)
![Equation ([8])](https://content.cld.iop.org/journals/1945-7111/161/11/F3144/revision1/jes_161_11_F3144eqn8.jpg)
where Fk represents differential equation constraints, Gk represents algebraic equation constraints, N represents the number of discretization points in time, z represents differential states, and y represents algebraic states with an applied current of iapp. The differential state constraints include physically meaningful bounds on the solid-phase lithium.
In simultaneous nonlinear programming,35–37 both the control variables and state variables are discretized, which results in a large set of nonlinear equations to be solved simultaneously for obtaining the optimum profile. 150 steps are used for time discretization resulting in a nonlinear system of 13200(88 × 150) equations. The nonlinear program was solved using the nonlinear programming solver IPOPT.38
Results and Discussion
In this study, different upper bounds on the radial and lower bounds on tangential stresses are placed and optimal charging profiles are derived. As mentioned before, during charging, the peak (compressive) tangential stress occurs at the surface of the particle and peak (tensile) radial stress occurs at the center of the particle. For graphite-based anode material, the fracture threshold for the tensile stress is much lower compared to compressive stress.12 Two scenarios are considered: (1) charging a fully discharged (0% SOC) battery for 1800 s, (2) charging a half-discharged (50% SOC) battery for 900 s.
Charging a fully discharged battery for 1800 sec
Figure 2 shows the voltage and current profiles of charging a fully discharged battery for 1800 s using CC-CV with three different maximum charging rates. Figure 3 shows the peak radial stress in three cases of CC-CV where the maximum values attained by peak radial stresses (dimensionless) are 0.24, 0.199, and 0.146 (4C, 3C, and 2C respectively).
Two cases are considered initially. In Case 1, the upper bound on peak (tensile) radial stresses (at anode-separator interface and 4 collocation points) is restricted to the maximum value of the peak radial stresses obtained during CC-CV charging with 3C ( = 0.199). Similarly, Case 2 corresponds to maximum value of peak radial stresses in case of CC-CV charging with 2C (
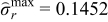
 = 0.146). Figure 6 shows the results of optimal charging problem. The green (dash dot) curve represents optimal charging profile and voltage for Case 1 and the blue (dash) curve represents Case 2.
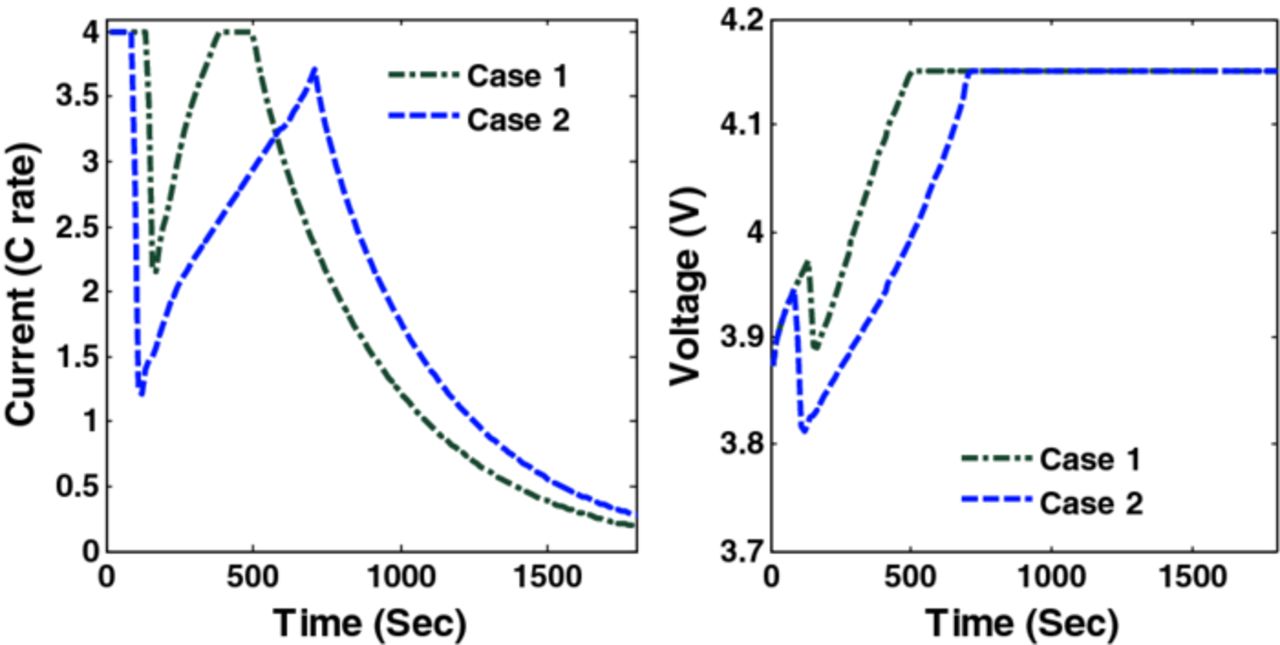
Figure 6. Optimal charging profiles and corresponding cell voltage for Cases 1 and 2 (upper bounds on peak radial stresses corresponds to CC-CV with 3C and 2C).
The optimal charging profiles derived for Cases 1 and 2 compromise very little on the charge stored compared to CC-CV with 4C but provide stress profiles that are as good as CC-CV with 3C and 2C for stress-induced capacity fade (since fracture during intercalation is mainly due to tensile stress for graphite-type materials12). Figure 7 shows radial stresses corresponding to Cases 1 and 2. It is clear from Figure 7 that optimal charging profiles restrict the peak radial stresses at the desired level. Figure 8 shows the peak tangential stresses for Cases 1 and 2 at five points in the anode. Due to the faster dynamics of the tangential stresses, the maximum peak tangential stresses near the anode-separator interface do not see much decrease in the new charging profiles (see Figure 8).
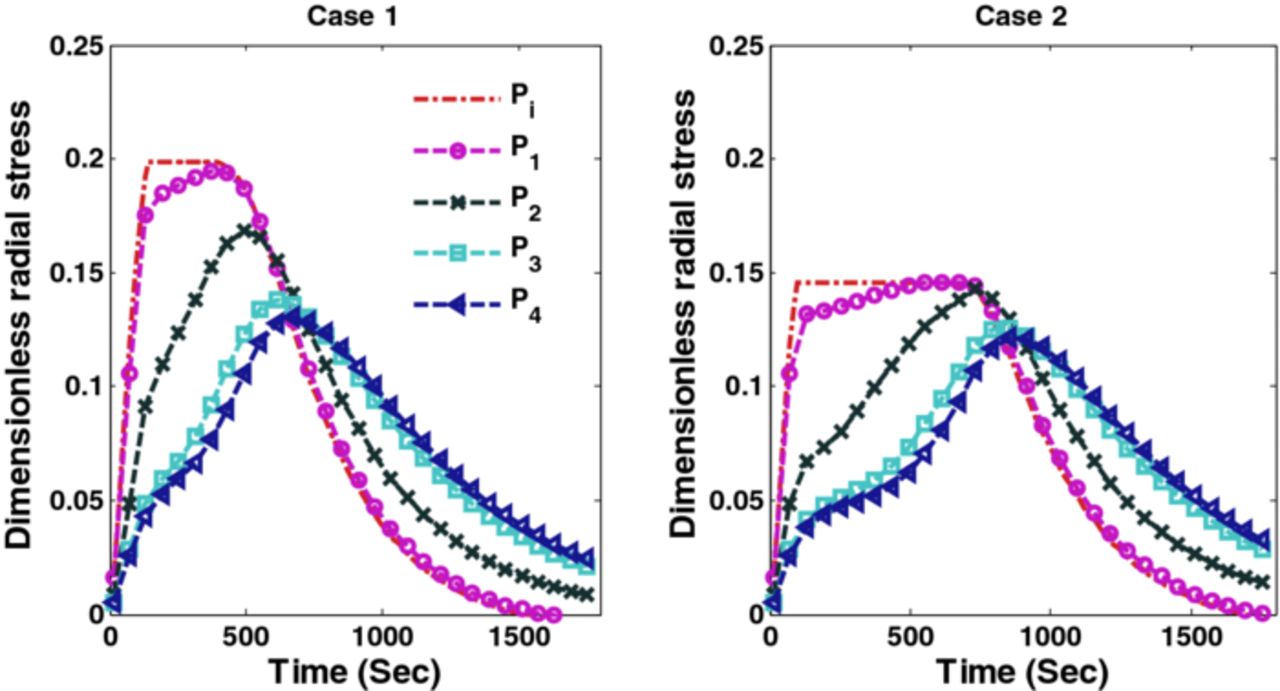
Figure 7. Peak radial stresses corresponding to optimal charging profiles for Cases 1 and 2 (Scenario 1).
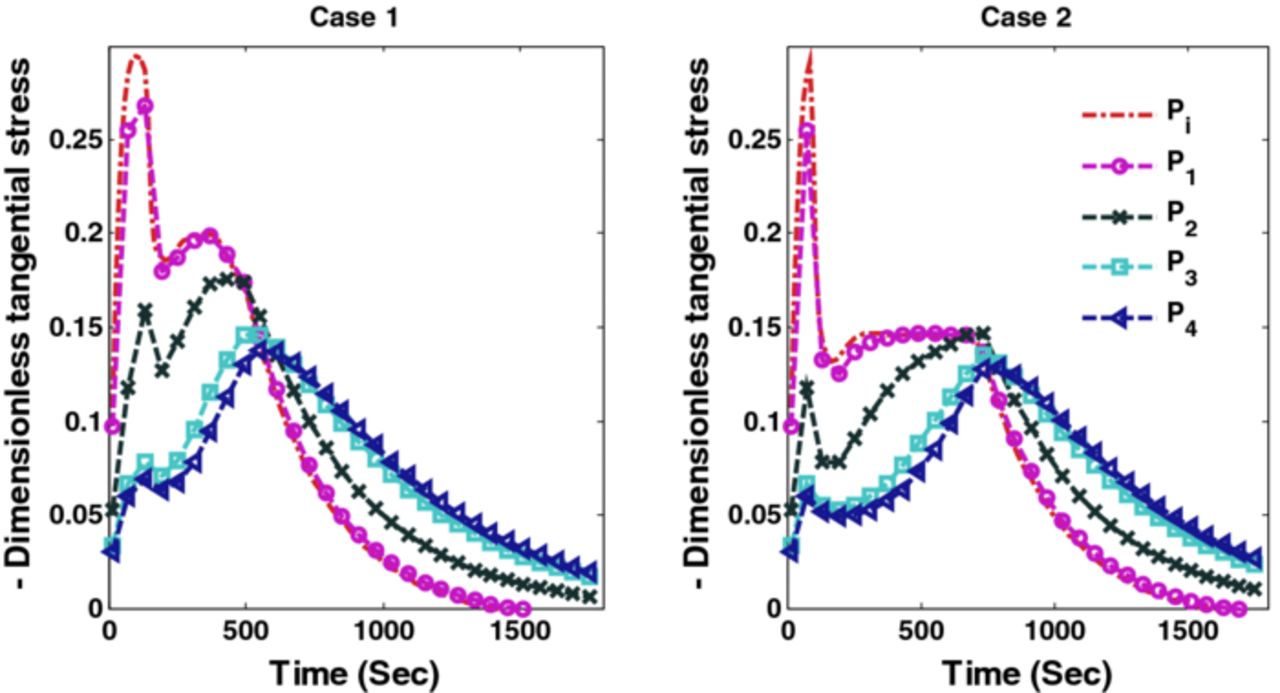
Figure 8. Peak tangential stresses corresponding to optimal charging profiles for Cases 1 and 2 (Scenario 1).
Since the fracture threshold can vary between materials, it may be important to put bounds on the peak (compressive) tangential stresses for some materials. Additional bounds can be placed on peak (compressive) tangential stresses and optimal charging profiles can be derived. The minimum values attained by peak tangential stresses at the surface of the particles during charging with CC-CV at 4C, 3C, and 2C are −0.296, −0.234, and −0.16 (dimensionless), respectively (see Figure 3). Cases 3 and 4 (considered below) have upper bounds on peak radial stress and lower bound on peak tangential stress that corresponds to extreme values of stresses during CC-CV at 3C ( = 0.199,
  ) and 2C (
 = 0.146,
  ) respectively. Figure 9 shows the optimal charging profiles for Cases 3 and 4. The specific shape of the optimal charging profile is created because different constraints become active at different points in time during the charging: maximum current followed by tangential stresses, followed by radial stresses, and finally maximum voltage.
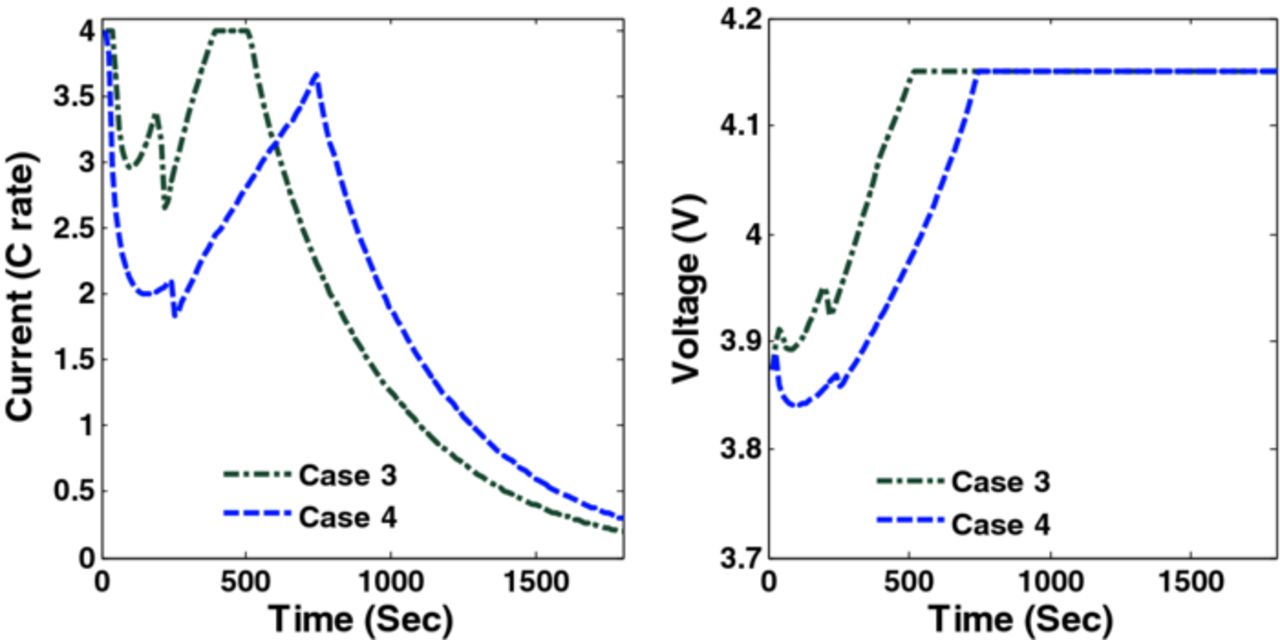
Figure 9. Optimal charging profiles and corresponding cell voltage for Cases 3 and 4 (Scenario 1).
Figures 10 and 11 show the corresponding tangential stresses and radial stresses.
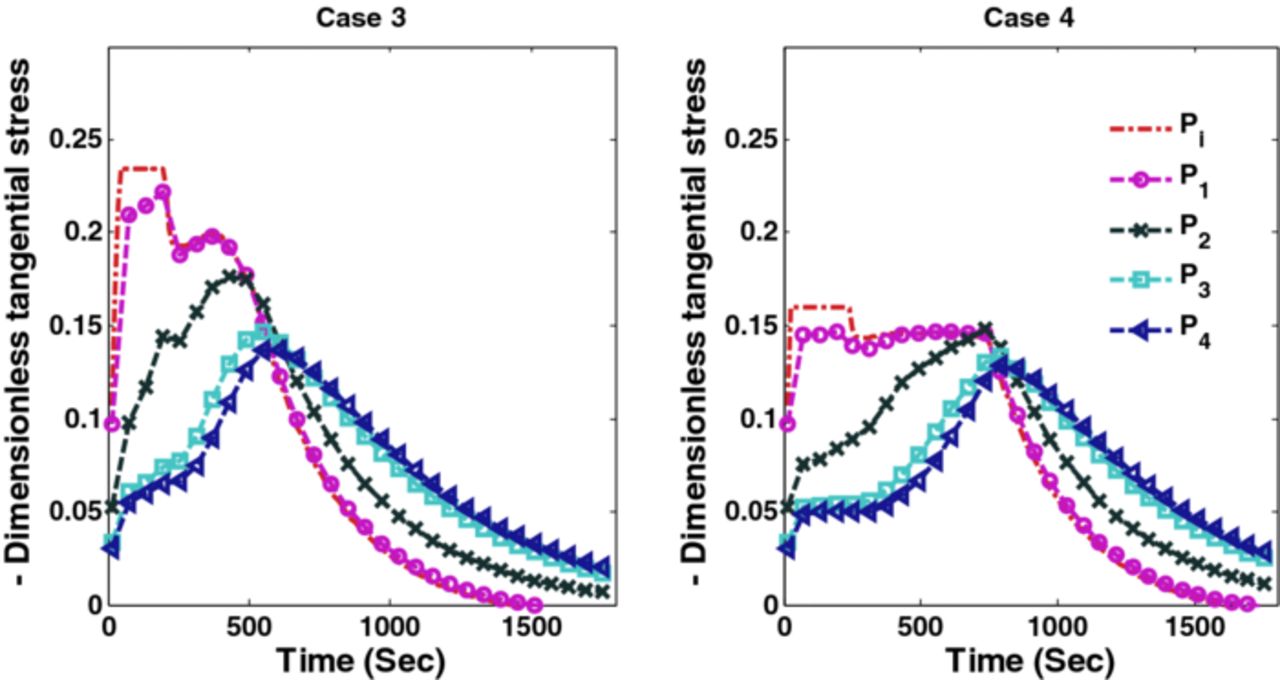
Figure 10. Peak tangential stresses corresponding to optimal charging profiles for Cases 3 and 4 (Scenario 1).
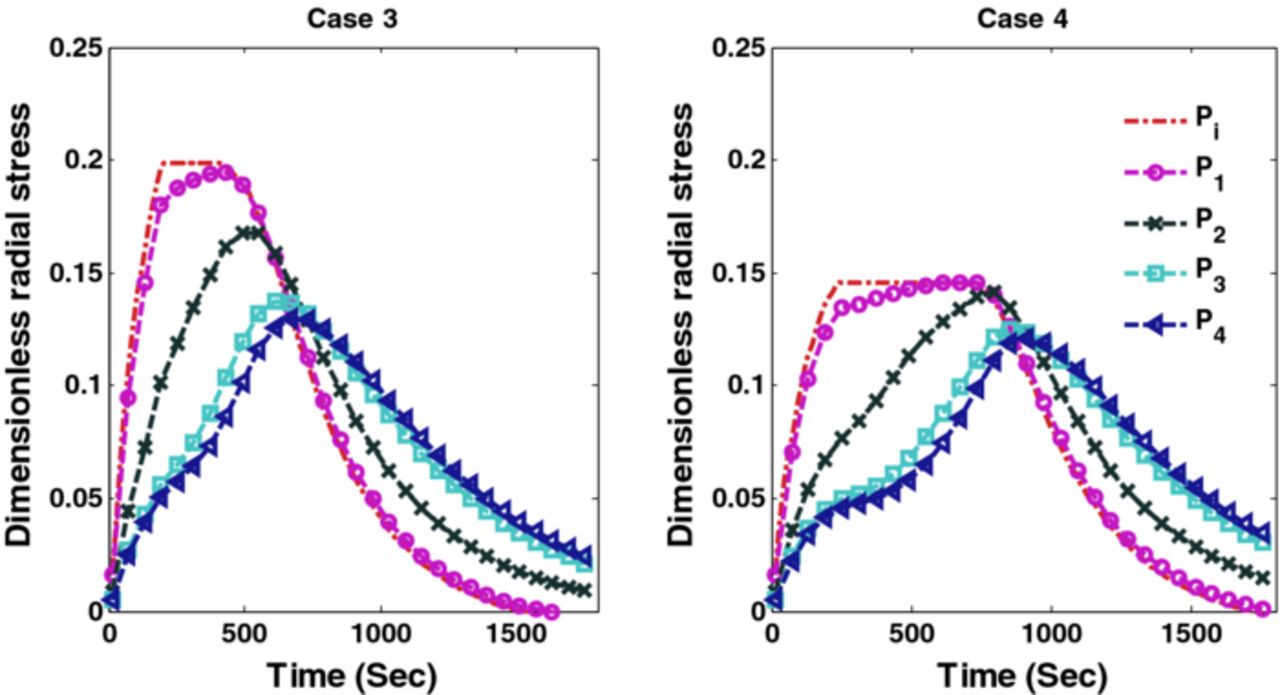
Figure 11. Peak radial stresses corresponding to optimal charging profiles for Cases 3 and 4 (Scenario 1).
The results are summarized in Table VI, based on charge stored during CC-CV at 4C. The optimization results show a very small compromise in charge stored compared to CC-CV at 4C can give rise to charging profiles that are as safe as CC-CV with 2C (considering only mechanical degradation). Moreover, the percentage of SOC compromise strongly depends on the final time chosen for optimization scheme.
Table VI. Summary of results for Scenario 1.
| Cases | Maximum peak radial stress | Minimum peak tangential stress | Charge stored (compared to CC-CV at 4C) |
|---|---|---|---|
| CC-CV (4C) | 0.24 | −0.296 | – |
| Case 1 | 0.199 | – | 99.73% |
| Case 3 | 0.199 | −0.234 | 99.61% |
| CC-CV (3C) | 0.199 | −0.234 | 99.00% |
| Case 2 | 0.146 | – | 98.65% |
| Case 4 | 0.146 | −0.16 | 98.34% |
| CC-CV (2C) | 0.146 | −0.16 | 94.55% |
Charging a battery at different SOC
In this scenario, optimal charging of a half-discharged battery is considered for 900 s. CC-CV charging with three different rates (2C, 3C, and 4C) results in different voltage, current, and stress profiles. Simulation results of CC-CV charging with different charging current are plotted in Figure 12 (voltage and current), Figure 13 (peak radial stresses), and Figure 14 (peak tangential stresses).
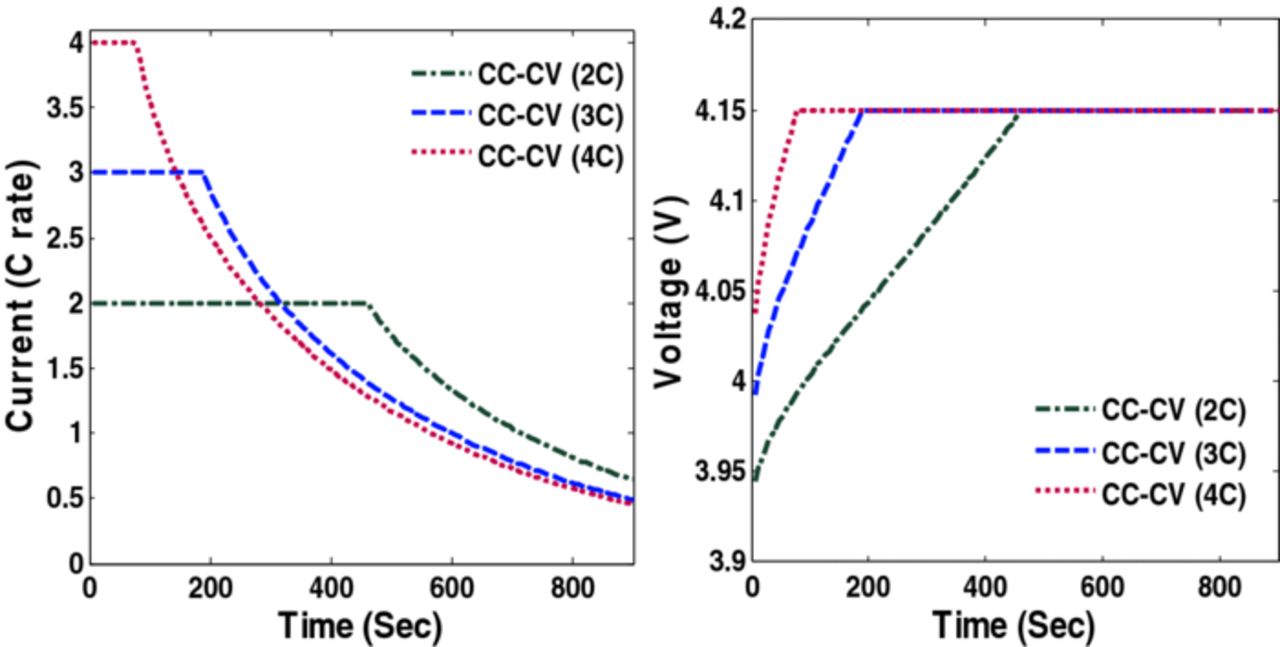
Figure 12. Voltage and current profiles during CC-CV charging with different C rate.

Figure 13. Radial stresses (tensile) at the center of the particles at the separator-anode interface (Pi) and 4 collocation points are plotted for CC-CV charging at 2C, 3C, and 4C.
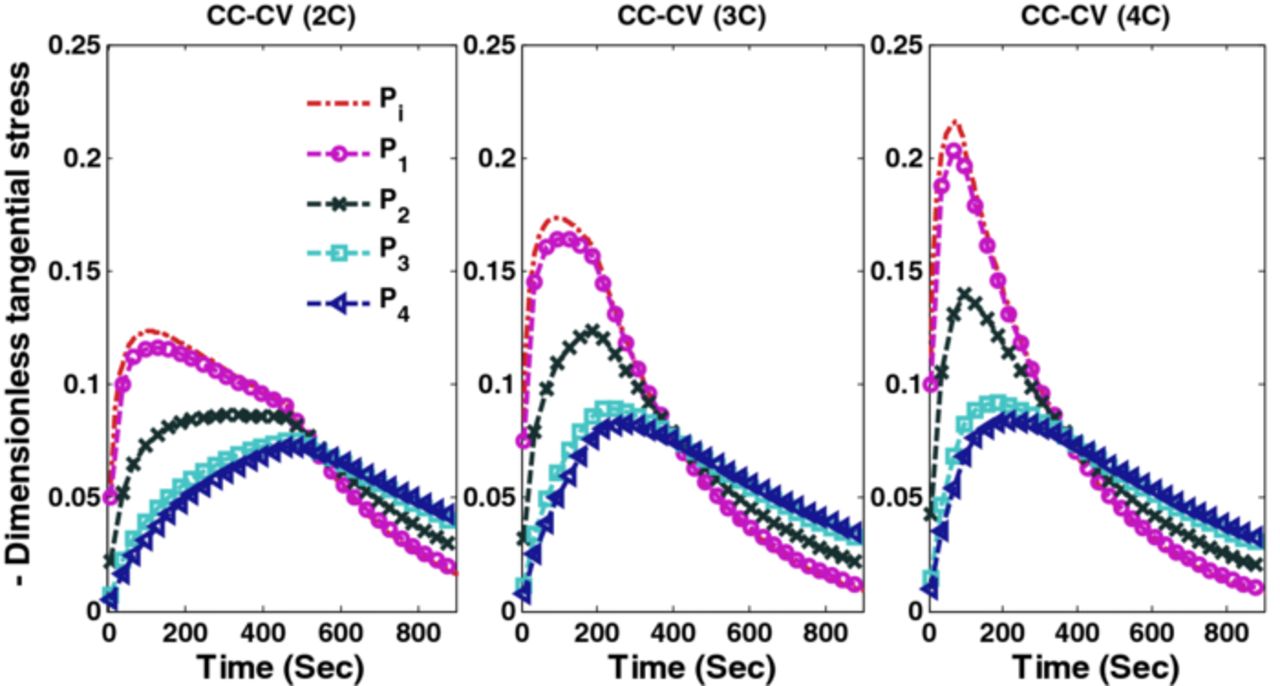
Figure 14. Tangential stresses (compressive) at the surface of the particles at the separator-anode interface (Pi) and 4 collocation points are plotted CC-CV charging at 2C, 3C, and 4C.
Similar to the previous scenario, four cases are considered here:
- (1)
 (corresponds to maximum peak radial stress of CC-CV with 3C)
 - (2) (corresponds to maximum peak radial stress of CC-CV with 2C)
- (3), (corresponds to maximum peak radial and tangential stress of CC-CV with 3C)
- (4), (corresponds to maximum peak radial and tangential stress of CC-CV with 2C)


The optimal charging profile for Cases 1 and 2 are plotted in Figure 15, which restricts the peak (tensile) radial stresses that develop in the anode. Stress profiles corresponding to optimal charging profiles for Cases 1 and 2 are plotted in Figures 16 and 17. Results for Cases 3 and 4, which restrict both radial and tangential stresses, are plotted in Figure 18 and corresponding peak radial and tangential stresses are plotted in Figures 19 and 20. Table VII summarizes the results associated with Scenario 2 which again suggest that a very small compromise on the SOC stored can yield improved charging profiles.
Table VII. Summary of results for Scenario 2.
| Cases | Maximum peak radial stress | Minimum peak tangential stress | Charge stored (compared to CC-CV at 4C) |
|---|---|---|---|
| CC-CV (4C) | 0.153 | −0.215 | – |
| Case 1 | 0.145 | – | 99.73% |
| Case 3 | 0.145 | −0.173 | 99.21% |
| CC-CV (3C) | 0.145 | −0.173 | 99.0% |
| Case 2 | 0.109 | – | 97.3% |
| Case 4 | 0.109 | −0.123 | 95.8% |
| CC-CV (2C) | 0.109 | −0.123 | 94.8% |
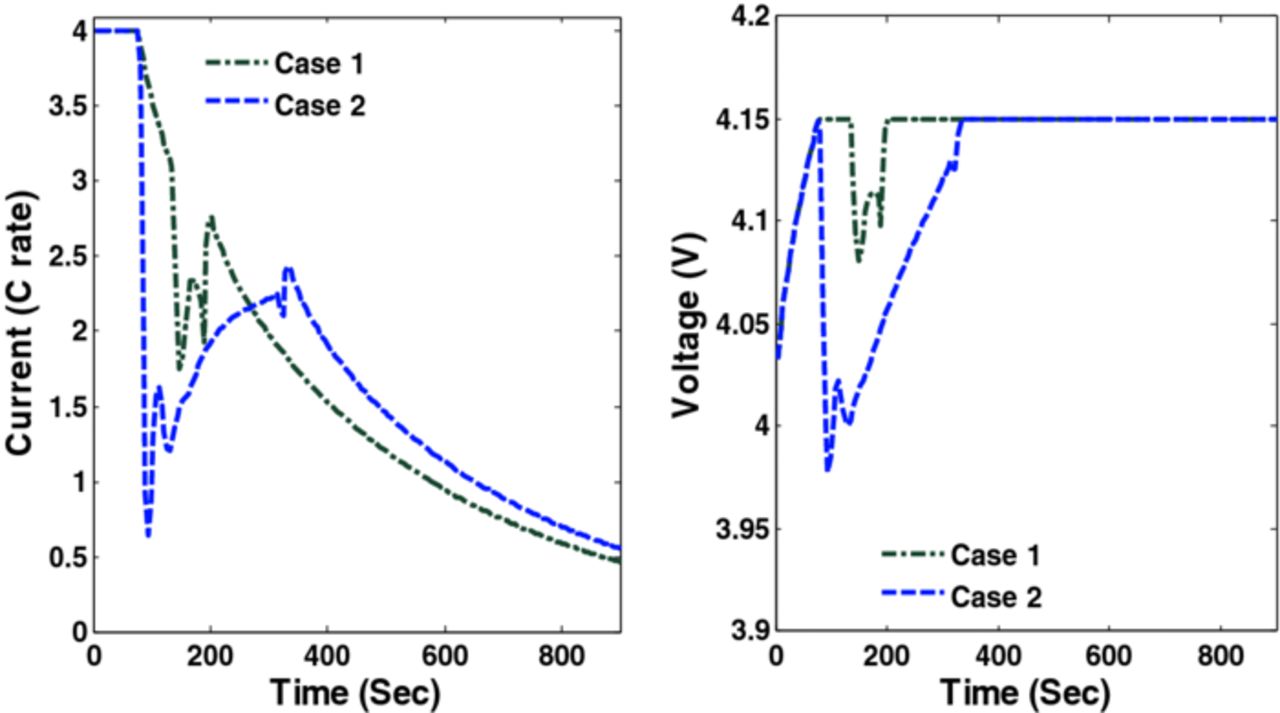
Figure 15. Optimal charging profiles and corresponding cell voltage for Cases 1 and 2 (Scenario 2).
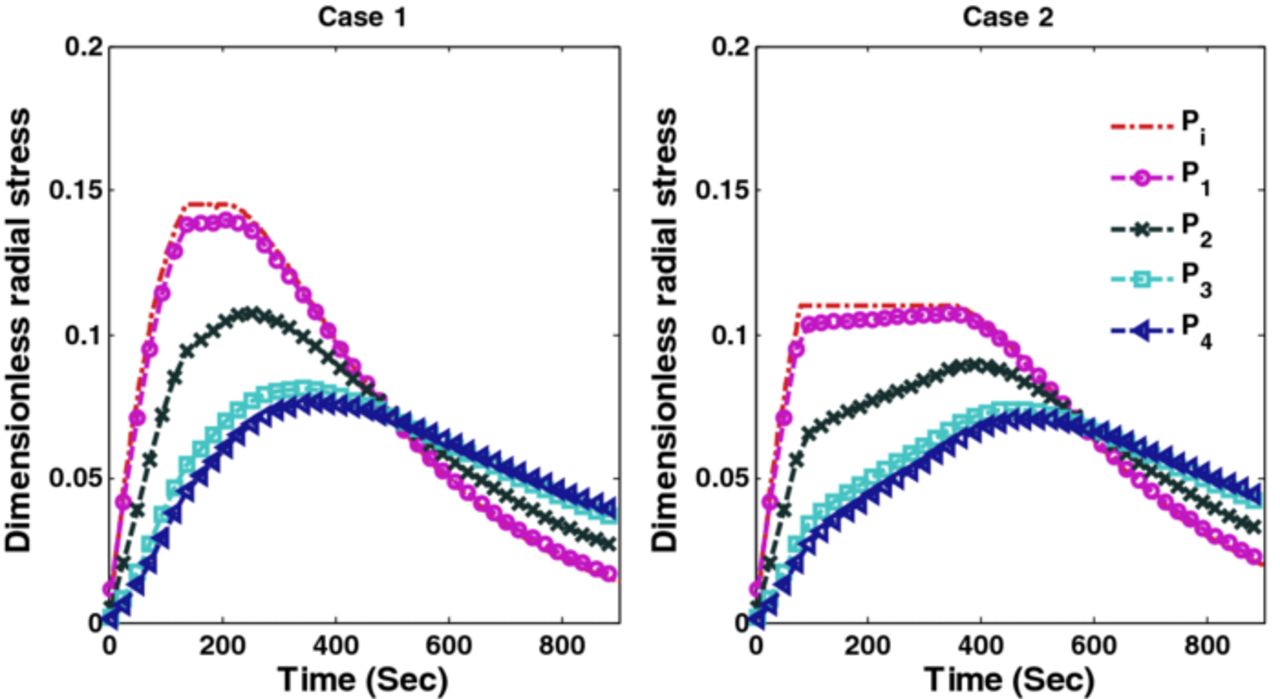
Figure 16. Peak radial stresses corresponding to optimal charging profiles for Cases 1 and 2 (Scenario 2).
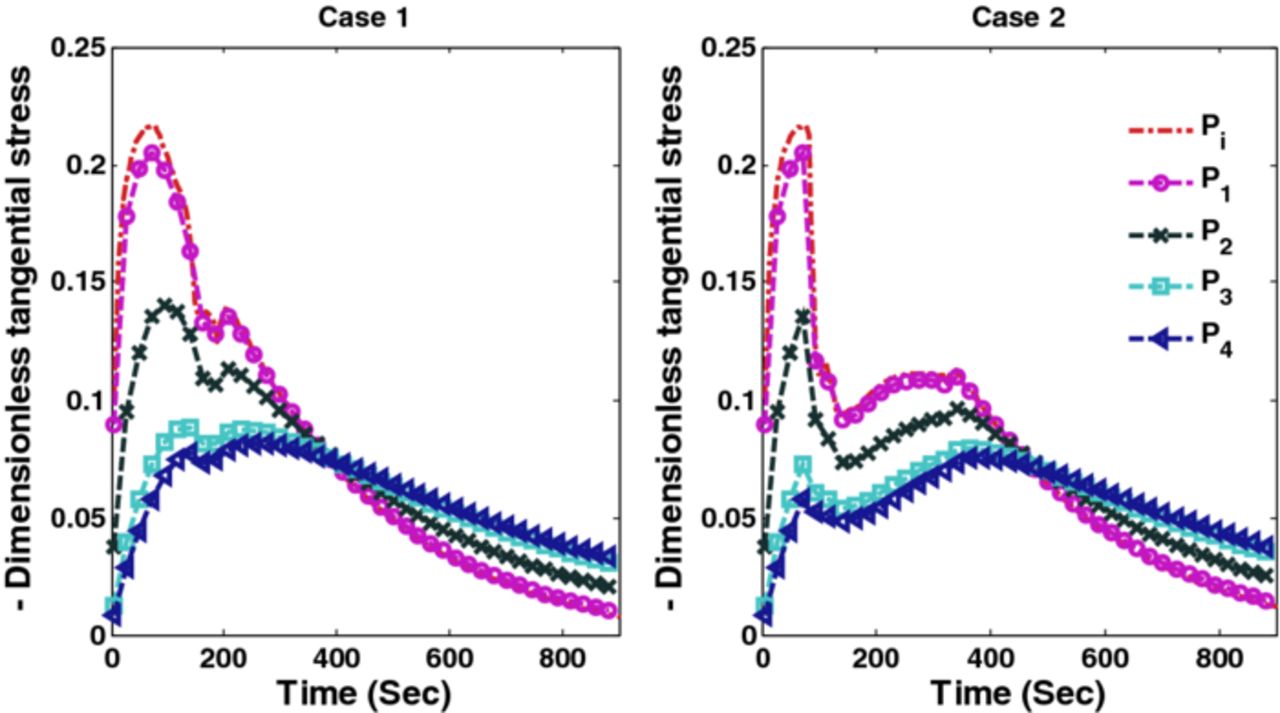
Figure 17. Peak tangential stresses corresponding to optimal charging profiles for Cases 1 and 2 (Scenario 2).
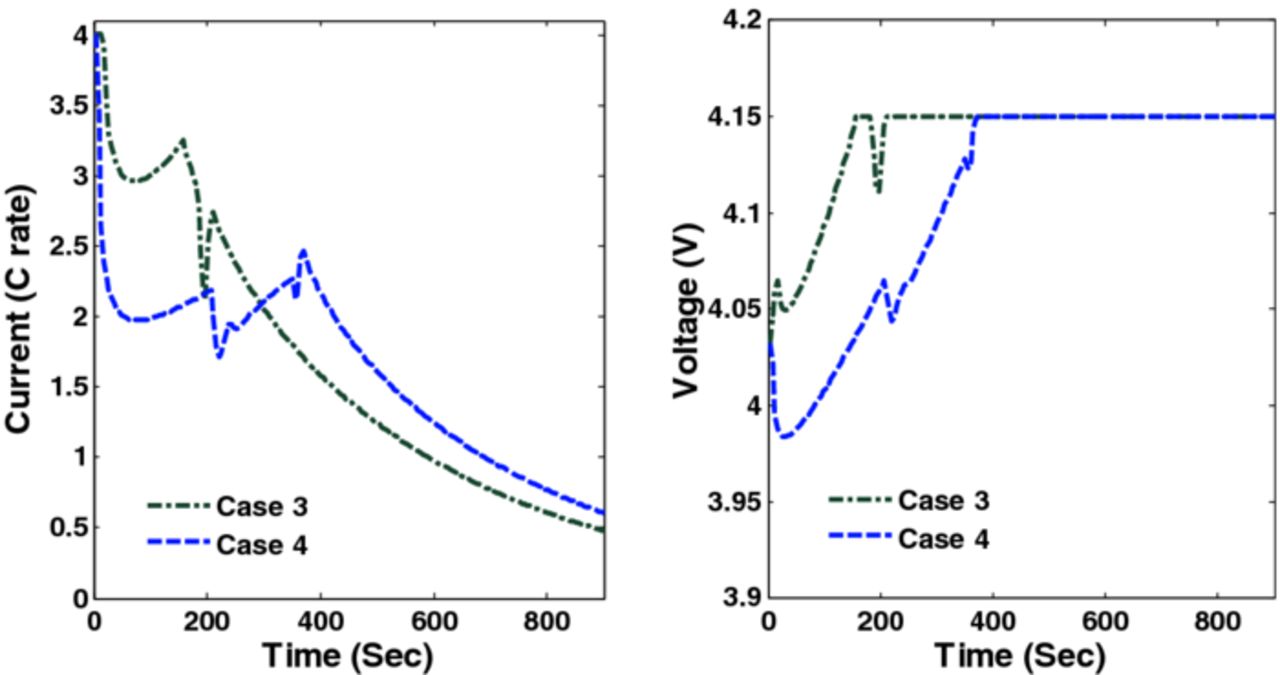
Figure 18. Optimal charging profiles and corresponding cell voltage for Cases 3 and 4 (Scenario 2).
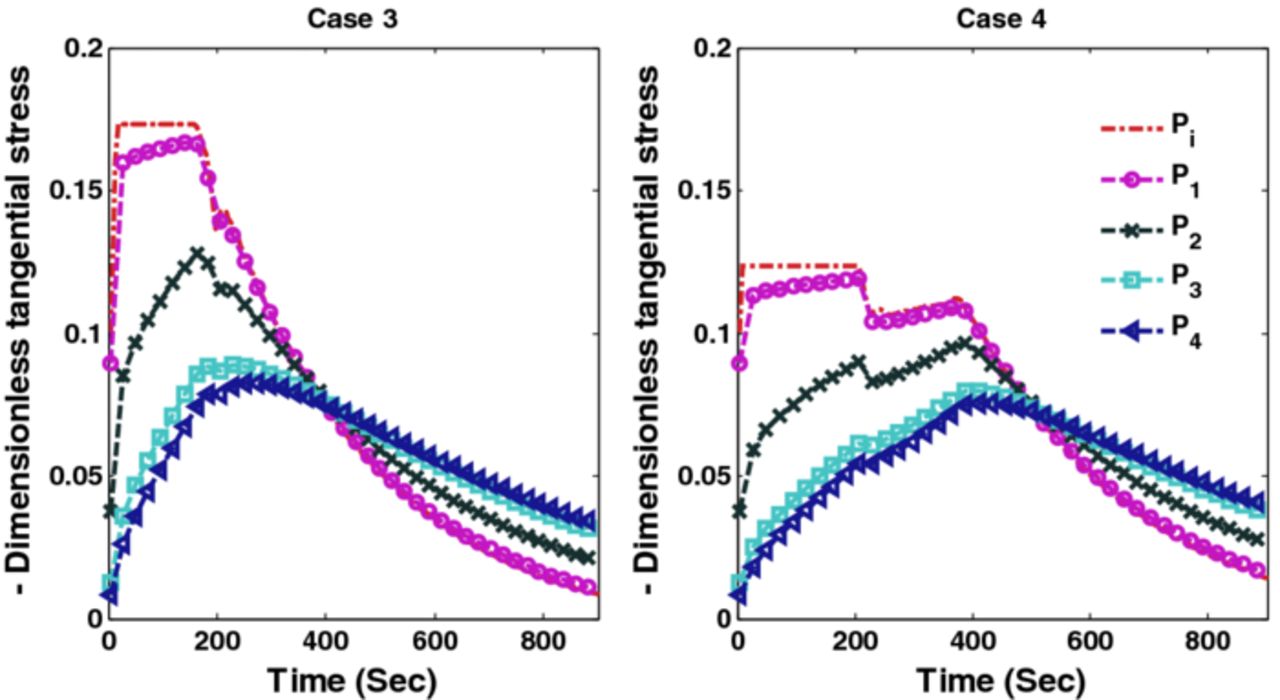
Figure 19. Peak tangential stresses corresponding to optimal charging profiles for Cases 3 and 4 (Scenario 2).
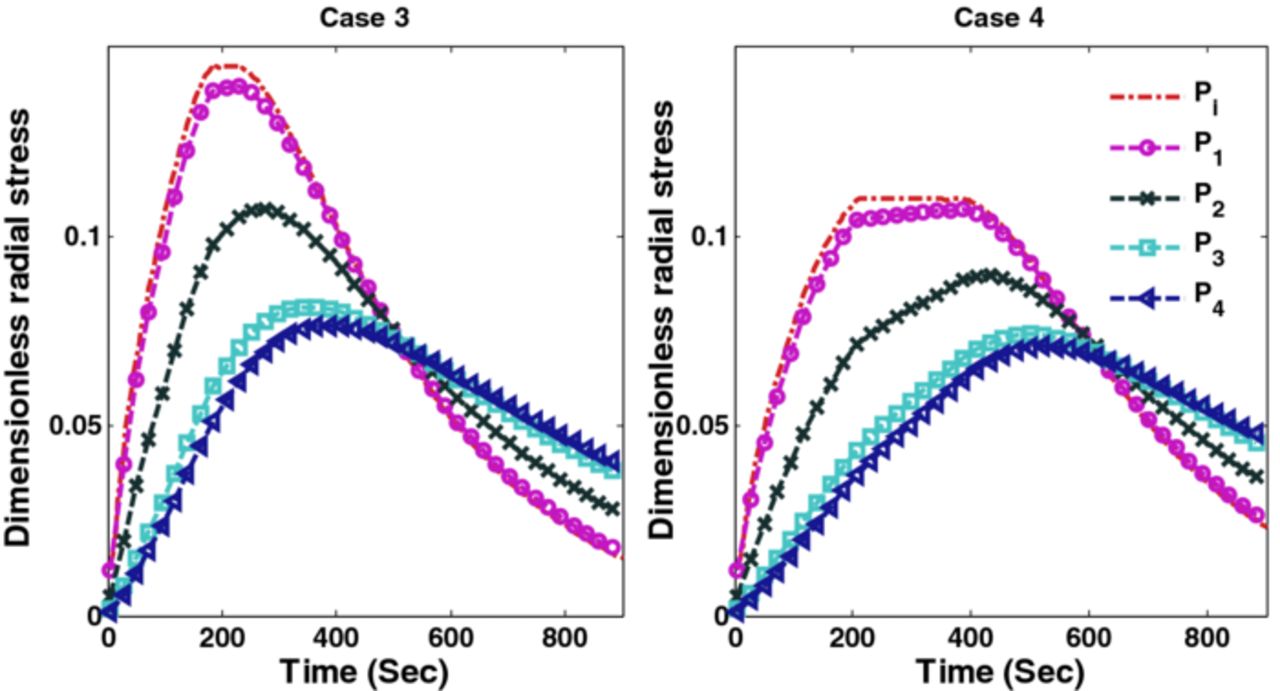
Figure 20. Peak radial stresses corresponding to optimal charging profiles for Cases 3 and 4 (Scenario 2).
Conclusions and Future Directions
This study shows the use of a dynamic optimization framework to derive optimal charging profiles using a reformulated P2D model considering intercalation-induced stresses. It is very clear from the analysis that the local pore wall flux varies significantly from the average current density, hence a P2D model is necessary to correctly capture the peak radial and tangential stresses. Since the anode-separator interface faces more stress compared to the rest of the anode (see Figure 5), smarter charging profiles can be derived which can reduce the mechanical damage due to stress.
A limitation of this study is its use of an isothermal model. In the future, a thermal model will be used to broaden the scope of this work. It should be noted that the nonlinear thermal dependencies of material properties make the optimization problem more difficult to solve. Moreover, at higher rates, for certain chemistries and parameter values, the plating side reaction becomes possible near the anode-separator interface which can also be handled using a dynamic optimization framework.13 The model used to represent intercalation induced stresses in this study is applicable only for materials with small volumetric expansion (up to 10%) and ignores any thermodynamic factor. Efforts will be made in the future to incorporate additional capacity fade mechanics (thermal degradation, plating side reaction, etc.) into a single optimization framework and to use better models to describe intercalation-induced stresses. Use of a reformulated P2D model can also help place physically meaningful voltage constraints. In this study, 4.15 V is chosen as the upper bound for voltage, which can be replaced by some meaningful constraints that minimizes side reactions and electrolyte decomposition.
Acknowledgments
The authors are thankful for the financial support from the United States Government, Advanced Research Projects Agency – Energy (ARPA-E), U.S. Department of Energy, under award number DE-AR0000275, and McDonnell International Scholar Academy at Washington University in St. Louis.