Abstract
Sediment microbial fuel cells (SMFCs) are being developed as potential energy sources where remote sensing and monitoring would be useful. Several energy harvesting techniques for SMFCs have emerged, but effects of these different strategies on startup, performance, and microbial community are not well understood. We investigated these effects by comparing a continuous energy harvesting (CEH) strategy with an intermittent energy harvesting (IEH) strategy. During startup, IEH systems immediately produced higher power and were cathode limited. CEH systems exhibited a gradual power increase and were anode-limited during startup. Both system types produced similar amounts of steady-state power, 1.5 mW ft−2 (16 mW m−2) when optimized. However, an IEH system using unoptimized settings could not be subsequently switched to optimal settings and produce expected power levels. The choice of energy harvester did not appear to significantly affect steady-state community structure. Anodes were dominated by γ- and δ-proteobacteria while α- and γ-proteobacteria dominated cathodes. The results suggest performance and community structure are unaffected by energy harvesting strategy, but that startup conditions influence the initial amount of harvested energy and steady-state performance, suggesting future investigations into optimizing startup of these systems are critical for rapidly generating maximum power.
Export citation and abstract BibTeX RIS

This is an open access article distributed under the terms of the Creative Commons Attribution 4.0 License (CC BY, http://creativecommons.org/licenses/by/4.0/), which permits unrestricted reuse of the work in any medium, provided the original work is properly cited.
Sediment microbial fuel cells (SMFCs) are currently being explored as persistent energy sources for remote sensors and communications in various environments.1–8 SMFCs are able to generate electrical current from chemical redox gradients at the sediment-water interface. Specifically, they utilize biologically catalyzed chemical reactions to oxidize organic carbon at the anode in the sediment.9–11 This is typically coupled with oxygen reduction in the water column at a cathode. By putting an electronic load between the anode and cathode, useful energy can be derived to power different payloads.
In order to maximize the power output of SMFCs, it is presumed that both microbial community and the energy harvesting systems need to be performing optimally. Several energy harvesting strategies have emerged in literature. Two predominant strategies involve either a potentiostatic operation12–17 or a capacitor charging operation.5,7,18–21 In SMFC applications, the cell potential –the difference between cathode and anode potentials– can be kept constant manually adjusting the external load or automatically by using electronic feedback control. This potentiostatic method may cause potential oscillations as the correct external load is determined by the feedback control circuit, but generally these can be avoided because the current response of the MFC to load change is quite slow in comparison. The net effect here is that the SMFC cell potentials are considered constant and current is continuously flowing in one direction. Thus, we call this type of strategy "continuous energy harvesting" (CEH). The current generated is at the MFC potential (generally below 0.5 V) and needs to be boosted to higher potentials in order to power commercial electronic devices.
The capacitor charging strategy generally uses the SMFC to charge a capacitor and store harvested energy. The capacitor is discharged when its potential reaches a predetermined setpoint. During discharge, capacitors from multiple SMFCs can be placed in series, after isolation from the anode and cathode, to generate higher voltages than a single SMFC cell could produce.22 The resulting higher voltage current can be used to power electronic devices. The charging of the capacitor results in a varying operating potential for the MFC, potentially starting at near short circuit conditions and gradually building up voltage as charge is stored in the capacitor. The cell potential here is varying and current flow from the MFC to the capacitor only occurs when the SMFC is in charging mode. Thus, this capacitor based energy harvesting strategy is referred to as "intermittent energy harvesting" (IEH).
These two strategies are expected to have different effects on electrode potential as energy is harvested. Beyond initial feasibility reports, limited research has been reported to directly compare the steady-state performance of SMFCs using both strategies.2,7,13,14,21 The impact of the electrode potential variation on microbial community is also unknown and it is unclear if a different community may emerge based on harvesting strategy. In the past, electrode potentials have been reported to be critical in establishing the microbial community and performance.23–27 Thus, significant questions on how energy harvesting strategy impacts extended SMFC operation remain unanswered. By addressing these questions, strategies to optimize SMFC energy harvesting can be developed.
The goal of this work was to compare SMFC performance using CEH and IEH strategies and characterize the electrode microbial communities. We examined these strategies by constructing SMFCs in flow-through mesocosms using sediment and seawater from San Diego Bay. Optimization of the IEH strategy was performed to determine operating parameters before steady-state operation. Systems were operated over 6 months to observe steady-state performance and establish microbial communities. We report here both overall SMFC performance and community structure at both the anode and cathode to provide some insight into any observed differences.
Materials and Methods
Construction and operation of the SMFCs
Eight microbial fuel cells (MFCs) were constructed from carbon fabric (Panex 30 PW06, Zoltek, St Louis, MO). Both the anodes and cathodes measured 30.5 cm × 30.5 cm (12 in × 12 in) with a titanium wire current collector woven through the center of the fabric. For both, the titanium was sewn to the fabric and connected to copper wire via a waterproof butt splice that was potted in marine sealant.
All anodes were placed in a large fiberglass tank containing a 25.4 cm (10 in) layer of sediment collected from the Marine Corps Recruit Depot in San Diego Bay (N32.7390, W117.2076). This sediment was mixed and homogenized prior to the start of the experiment. The carbon fabric anodes were buried 10–12 cm underneath the surface of this sediment layer, with the fabric spread parallel to the sediment-water interface. San Diego Bay water was continuously fed to this tank, creating about 30 cm of overlying water. The tank was aerated continuously to make sure that the bulk solution was saturated with oxygen. The cathodes were suspended in the overlying water in close proximity to their paired anodes. The copper wires for each anode and cathode were run out of the tank to a terminal block where electrical connection could be made. All systems here were located in a temperature controlled environment set to 20°C with a 12-hour day-night light cycle.
Four of these anode-cathode pairs were connected to a custom MFC test circuit developed previously.28 This type of system operates the MFC in IEH mode by allowing current to flow through the MFC to charge a capacitor to a given charge potential value (Vc). Once the capacitor reaches Vc, a metal–oxide–semiconductor field-effect transistor (MOSFET) is enabled to discharge the stored energy through an external load. The capacitor is allowed to discharge until it reaches a set lower potential value, known as the discharge potential (Vd). At this point the MOSFET connecting the capacitor to the external load is disabled, and current is allowed to flow through the MFC to charge the capacitor again. By calculating the number of charge-discharge cycles, an average daily power output for the MFC systems can be determined.28
The other four anode-cathode pairs were allowed to reach open circuit potential (approximately 0.8 V) before being gradually loaded with smaller and smaller external resistors until the operating potential was brought to around 0.4 V. These SMFC systems were operated independently to serve as replicates in this study. This CEH method was selected because it appeared to provide optimal performance for SMFC systems based on previous studies for similar types of systems and sediments.15–17 These systems are subsequently referred to as CEH-MFCs because they operated at an approximately constant cell potential with energy harvested continuously rather than intermittently.
All the systems were allowed to operate and reach a steady-state power generation. The initial charge-discharge window for IEH systems utilizing the MFC tester circuit in previous studies was 0.1–0.35 V.28 The four replicates operating on this test circuit are referred to later as IEH-MFC1, IEH-MFC2, IEH-MFC3, and IEH-MFC4. The four other MFC systems (CEH-MFC1–CEH-MFC4) were loaded with resistors and maintained at 0.4 V by continuously monitoring and changing the external resistive load.
Data was logged from each system using data acquisition units integrated with custom NI LabVIEW-based software acquisition programs (LabVIEW 2010; National Instruments, Austin, TX). For the IEH-MFCs, the capacitor voltage and the anode voltage (vs. an Ag/AgCl reference) were recorded every second. Average daily power was calculated from the IEH systems based on power dissipation from a capacitor during its charge-discharge cycles. For the MFC systems operated with resistive load (CEH-MFCs), anode and cathode potentials were measured against an Ag/AgCl reference electrode and recorded every 5 minutes. Cell potential and power were calculated from these values for each instance of measurement using the known load resistor values.
The IEH-MFC systems were grouped into two sets of duplicates for testing power output over different potential ranges during the optimization study. Two systems (IEH-MFC1 and IEH-MFC2) were left to operate at the initial charge-discharge window while the other two systems (IEH-MFC3 and IEH-MFC4) were used find optimal settings for maximum power generation. This was performed by systematically testing different operational conditions, changing the parameters of the systems to operate under different Vd and Vc conditions. The range of values examined was 0.1 to 0.4 V for Vd and 0.3 to 0.6 V for Vc.
Evaluation of power generation under optimized IEH conditions
After about 120 days, an optimal charge-discharge potential window was determined from observed results and the IEH-MFC systems were setup to operate in this window for an extended period of time. CEH-MFC systems were operated with higher loads to bring their operating potential into a range similar to that of the IEH-MFC systems (0.45–0.5 V). Both of these systems were operated at steady state to obtain an accurate comparison of power output from the two different MFC operating principles: cycling electrode potentials around a set-point (IEH) versus constant electrode potentials (CEH).
After these systems reached steady state, a discrepancy with the power outputs during optimization and the new steady-state values was observed. To eliminate any historical effects resulting from previous operation of the IEH-MFC systems outside of the optimal potential range, 4 new identical systems were prepared for evaluation.
The initial systems were extracted from the tank and existing sediment was homogenized after the overlying water was drained off. The new MFCs were installed in the homogenized sediment and started up as before, except with the goal of generating power while operating under optimal voltage potentials. These systems were allowed to operate under these conditions for 6 months until steady-state operation was observed.
DNA extraction and 16S rRNA gene amplification
After operation under steady state, sections of anode and cathode from both the IEH-MFC and CEH-MFC systems operated under optimum conditions were collected and stored at −80°C prior to DNA extraction. Genomic DNA (gDNA) was extracted using the PowerSoil DNA Extraction kit (Mobio, Carlsbad, CA) according to the manufacturer's instructions. Extracted gDNA was qualified though absorbance measurements at 240 nm and 260 nm using a multiwell spectrophotometer (Epoch Take3 microplate; BioTek, Winooski, VT) and quantified using a Qubit fluorometer (Life Technologies/ThermoFisher; Waltham, MA).
Fragments of 16S rRNA genes containing variable V1-V3 regions were amplified from the extracted gDNA samples with primer set, 27F:GAGTTTGATCMTGGCTCAG and 515R: TTACCGCGGCTGCTGGCAC. Forwarded barcodes and reversed barcodes were added to both forward and reverse primers in order to sort each sample from sequencing outcomes in which all samples sequence were mixed. Each PCR reaction was performed in 25 μL reaction mixture (HotStart-IT FideliTaq Master Mix; Affymetrix, Santa Clara, CA). After PCR, the amplicons were purified by digestion with ExoSAP-IT (Affymetrix, Santa Clara, CA) and stored at 4°C until sequencing.
PacBio sequencing and sequence analysis
The purified 16s rRNA fragments were pooled and sequencing was done using a PacBio-RSII sequencer at the Molecular Biology and Genomics Core, Washington State University, Pullman, WA. Prior to the sequencing, amplicons from different samples were pooled together with the same amount. A total of 53,886 raw reads were obtained after computational removal of the contaminant reads through detection of barcoded primers.
The FASTAQ formatted sequences were processed using mothur v.1.3329 to convert sequences to the FASTA format and generate a quality file. All sequences were trimmed using a sliding window of 10 bp and a quality score threshold of 35. Filtered sequences were dereplicated and aligned against the SILVA-based bacterial reference.30 Unique sequences were screened to remove those that did not align to the positions 1044–10241 of the reference alignment. Non-informative columns were removed through filtration. Sequences were pre-clustered to >99% identity (allowing 4 differences), and deprelicated. No chimeras identified using UCHIME in self-referential mode.31 The resulting set of filtered sequences were then classified using the RDP training set v.9 reference with an 80% bootstrap cutoff.32 Sequences of unknown classification at the kingdom level were removed. Sequences were clustered into operational taxonomic units (OTUs) at 0.03 average distances. Finally, the OTUs were grouped based on the sequence classification.
Results
Startup and initial operation
Initially, a low potential window was selected for the seawater IEH-MFC systems based on our previous experience with freshwater SMFCs. IEH-MFC systems immediately began generating current once the anode and cathode were connected to the IEH MFC test circuit (Figure 1A). The systems were able to charge their capacitors to +0.35 V within 24 hours. Power from the first day of operation of the 4 systems ranged from 5–113 μW. All systems began increasing their power output, reaching a maximum of around 1 mW at 15 days. Following this maximum output, the power levels steadily dropped over the next 50 days, presumably due to depletion of carbon sources and nutrients from the sediment surrounding the anode.
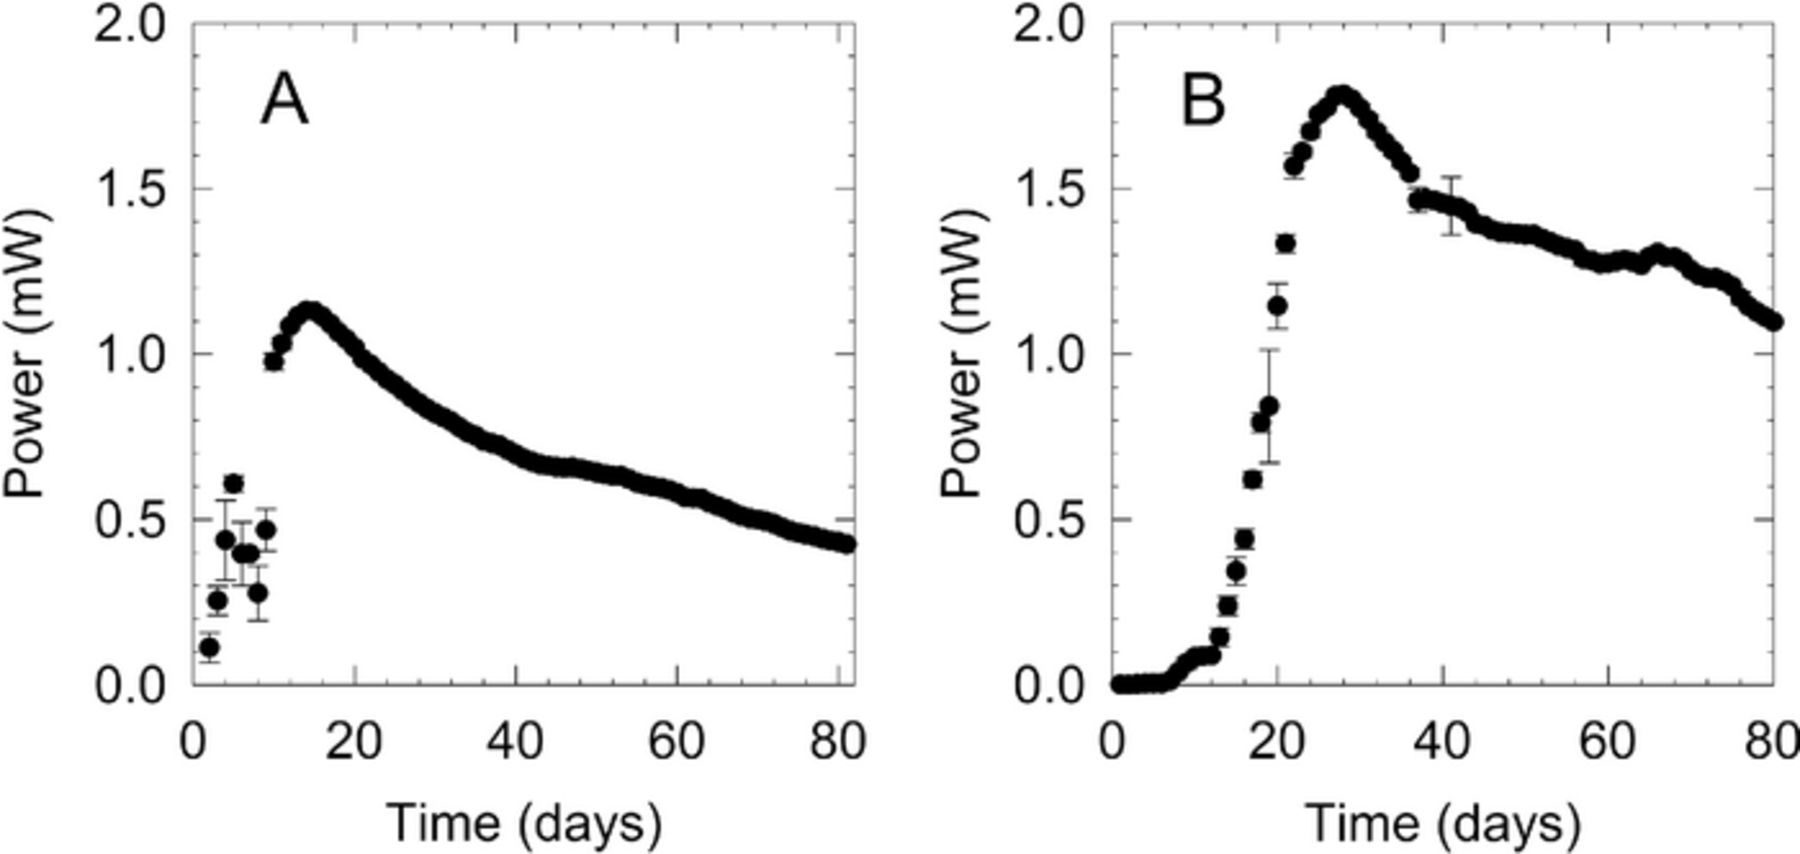
Figure 1. Example, average daily power generated by A) IEH-MFC and B) and CEH-MFC systems during initial startup. IEH-MFC systems were operated at Vc = 0.35 V and Vd = 0.1 V, while the cell potential of CEH-MFC systems were maintained at 0.4 V by varying external load.
The CEH-MFC systems reached an average open circuit potential of 0.670 V approximately 3 days after electrode burial. Resistive loads were sequentially applied and adjusted until a target operating potential of 0.4 V was reached (Figure 1B). Average maximum power peaked after 27 days at 1.8 mW for each system. Power for the systems gradually decreased until stabilizing at an average power of 0.52 mW after 165 days of operation. Power remained constant for another 42 days, at which point new systems were restarted under different load conditions for comparison to the optimized IEH-MFC systems.
Optimization of charge and discharge potential
After 50 days of operation, two of the four IEH-MFC systems were used to determine an optimal charge-discharge potential window. Each was set to a different charge and discharge potential and operated until a stable power output was achieved. Plotting the steady-state power output for each of these curves shows maximum power (1.36 mW, 5 day average) could be achieved with a charge-discharge window limited to 0.4–0.5 V (Figure 2).
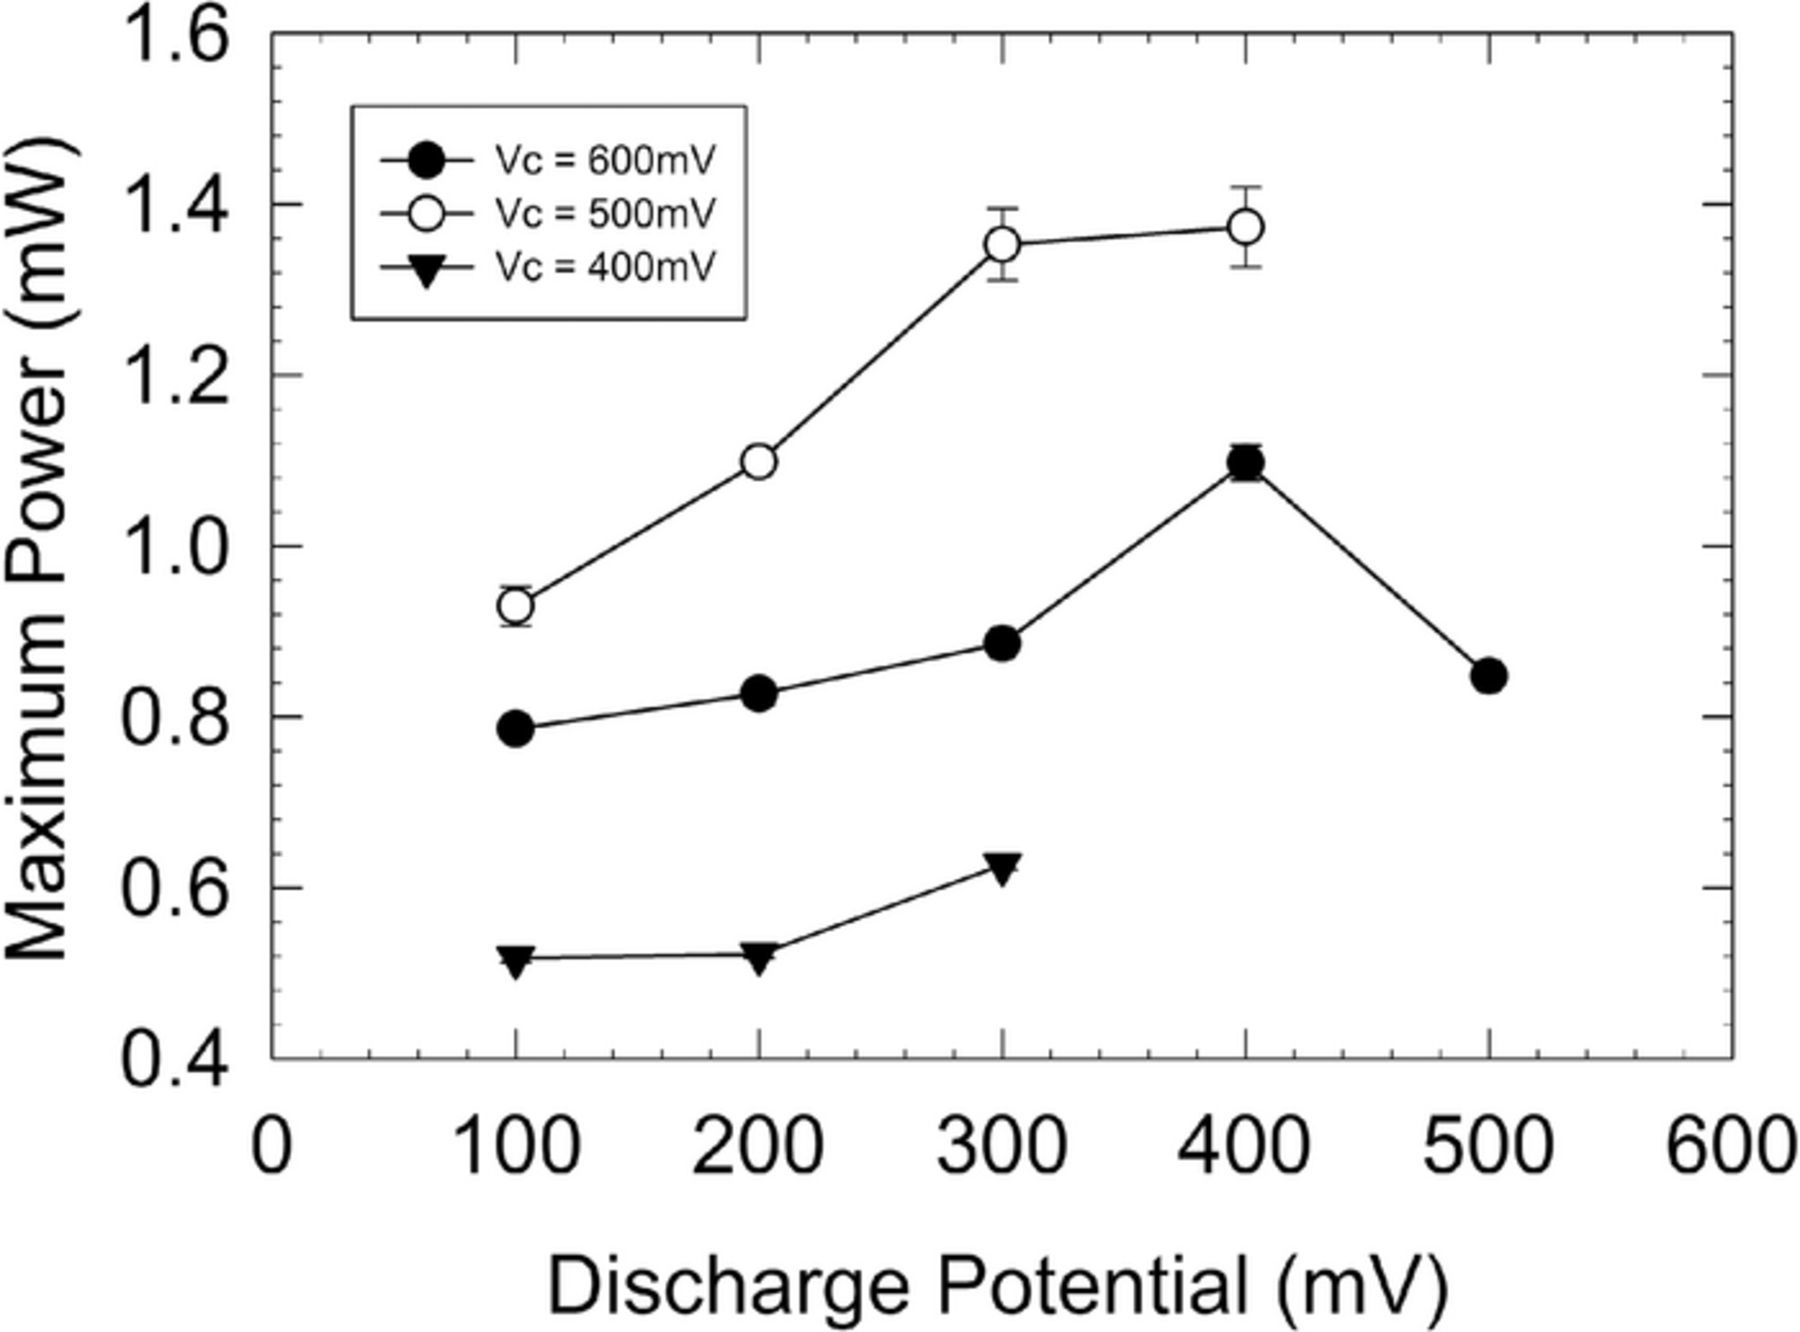
Figure 2. Optimization plot showing the maximum steady-state power generated by IEH-MFC systems with different charge and discharge potentials.
Comparing energy harvesting strategies after optimizing intermittent energy harvesting
After an optimal Vc and Vd was determined, the other two IEH-MFC systems that had been operating at the initial charge-discharge potential window (0.1–0.35 V) were adjusted to operate between 0.4–0.5 V to validate our findings. The systems operated on resistor loads (CEH-MFCs) were also adjusted to operate at 0.475 V for comparison. During this period, the power produced from the two IEH-MFC systems was comparable to the CEH-MFC systems. Ten day average of power production for IEH-MFC systems was 0.81 mW. The four CEH-MFC systems produced an average of 0.73 mW at comparable voltage.
Because the power output did not match the values obtained earlier in the optimization (1.36 mW), new systems were started for evaluation under the optimal potential windows. Once the new systems were installed, both the IEH-MFC and the CEH-MFC systems took about 30 days to reach steady state (Figures 3 and 4). The 10-day average power output for the IEH-MFC systems after 60 days of operation was 1.94 mW while the average for the CEH-MFC system was 1.81 mW. Average cathode potentials were generally above +400 mV|Ag/AgCl while average anode potentials were around −50 mV|Ag/AgCl for IEH and CEH systems.
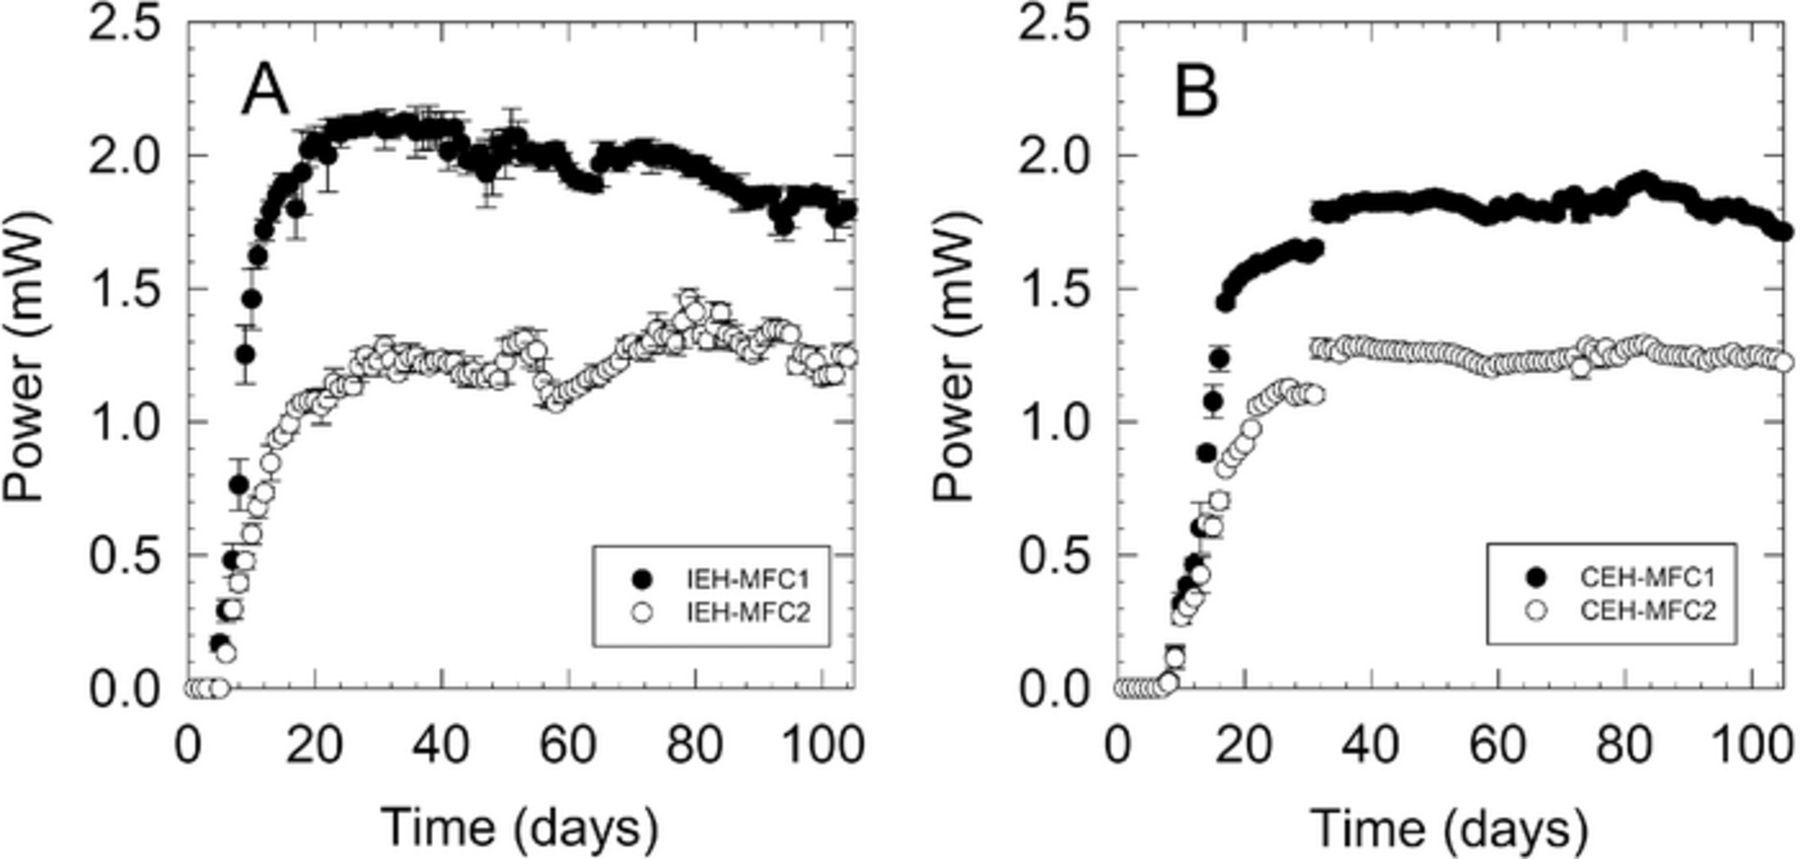
Figure 3. Average daily power generated by A) IEH-MFCs and B) and CEH-MFCs at optimized conditions.
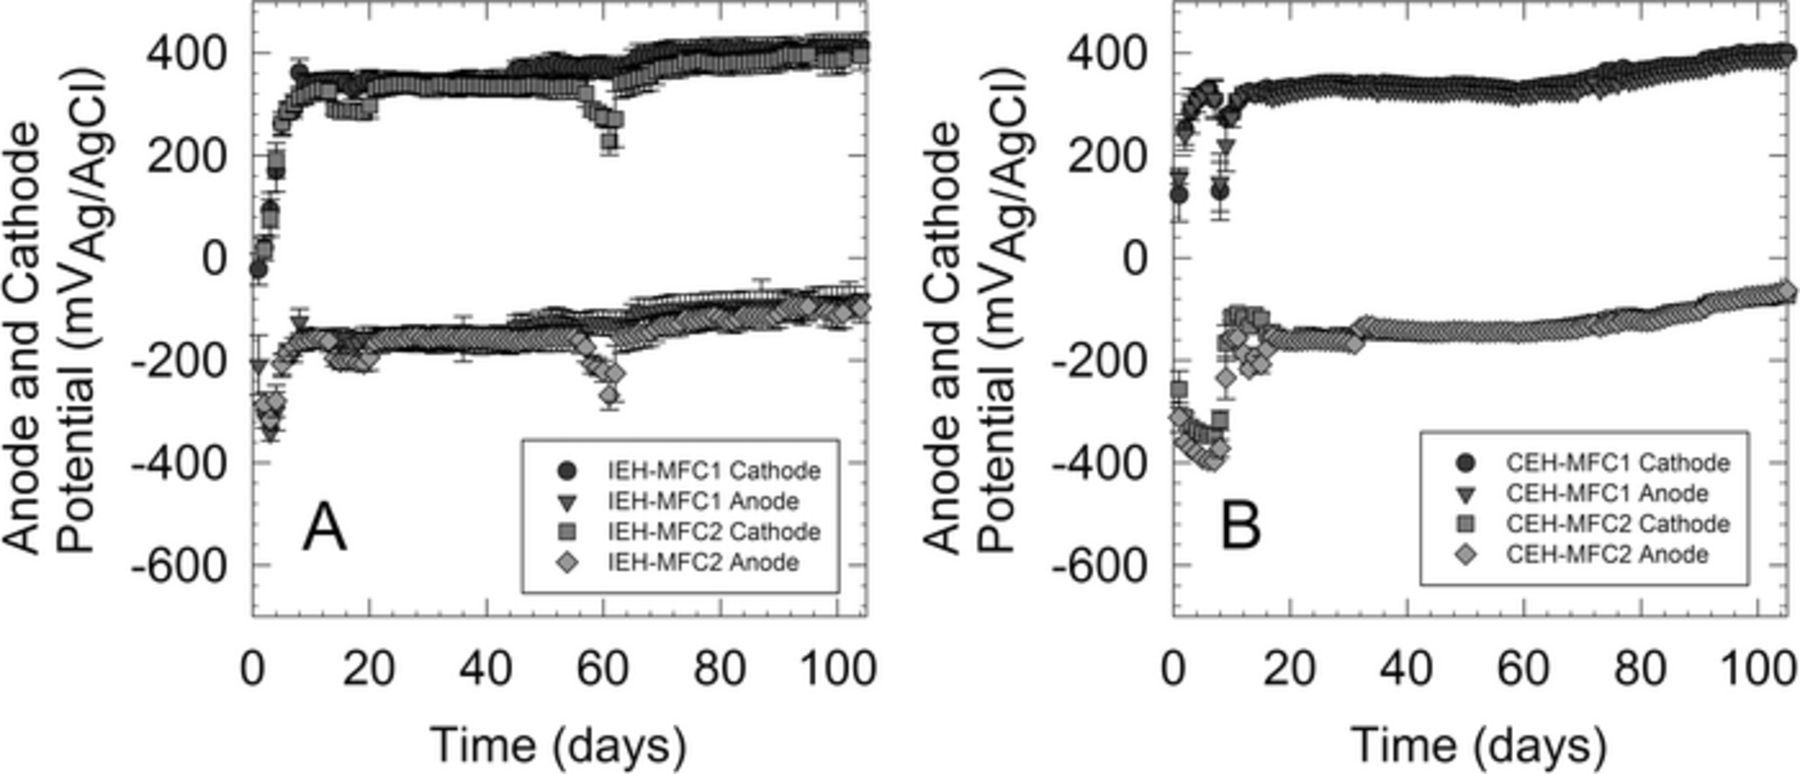
Figure 4. Anode and cathode potentials of A) IEH-MFC systems and B) and CEH-MFC systems at optimized conditions.
Community analysis
Of the raw reads (53,886 sequences), approximately 71% (38,164) passed the quality filtering standards described in the Materials and methods section. The average length of the filtered sequence reads was 500 bps, similar to the typical length of V1-V3 16S rRNA regions. The saturated shape of rarefaction curves (Figure 5) indicates that our sequencing effort for each sample type is representative of the actual sample community structure. At 3% dissimilarity level, the estimated Chao1 and invert Simpson values for cathodes were higher than anodes, in both CEH-MFCs and IEH-MFCs, despite of having lower qualified reads (Table I). This suggests that the microbial community established on cathode was generally richer and more diverse than that in anode.
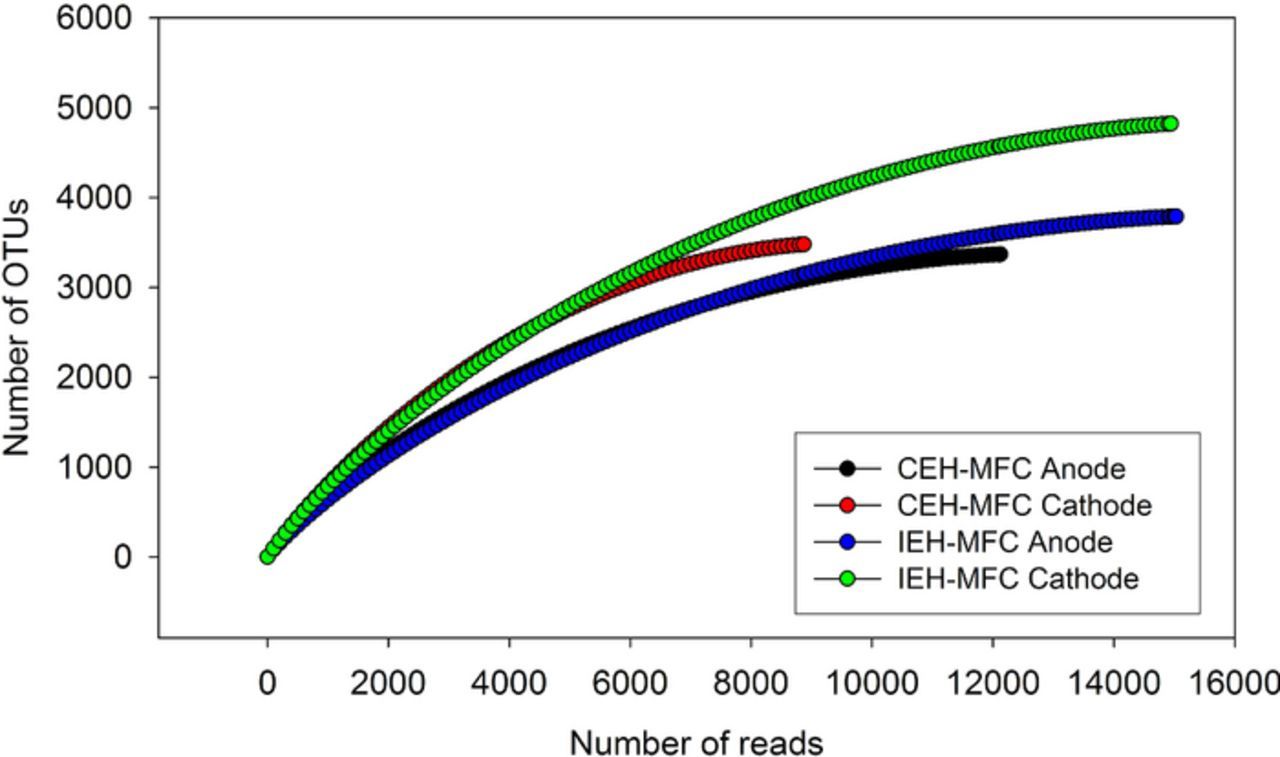
Figure 5. Rarefaction curves for the different MFC system electrodes. The y-axis indicates the number of OTUs with a dissimilarity cutoff of 3%. Each curve represented for the number of OTUs observed from the total quality-filtered reads.
Table I. Species diversity and richness estimated from microbial communities associated with anodes and cathodes from CEH and IEH MFCs. Chao1 richness estimate and inverse Simpson indexes were determined at 3% of dissimilarity level.
| Sample | # qualified | Chao1 Richness | Inverse Simpson |
|---|---|---|---|
| name | reads | Estimate | Index |
| CEH Anode | 12121 | 3402.3 | 250.1 |
| CEH Cathode | 8872 | 3521.0 | 1050.4 |
| IEH Anode | 15030 | 3832.2 | 166.7 |
| IEH Cathode | 14942 | 4893.5 | 963.7 |
While the power output from the two different types of systems was similar, the microbial community analysis also showed a fairly similar structure at the anodes of each system with a majority of known sequences coming from δ- and γ-proteobacteria (Figure 6). Relative abundance of δ-proteobacteria was similar (16.0% for IEH-MFC systems and 15.2% for CEH- MFC systems). The IEH-MFC systems had a lower abundance of γ-proteobacteria than the CEH-MFC systems (11.7% vs 14.8%).
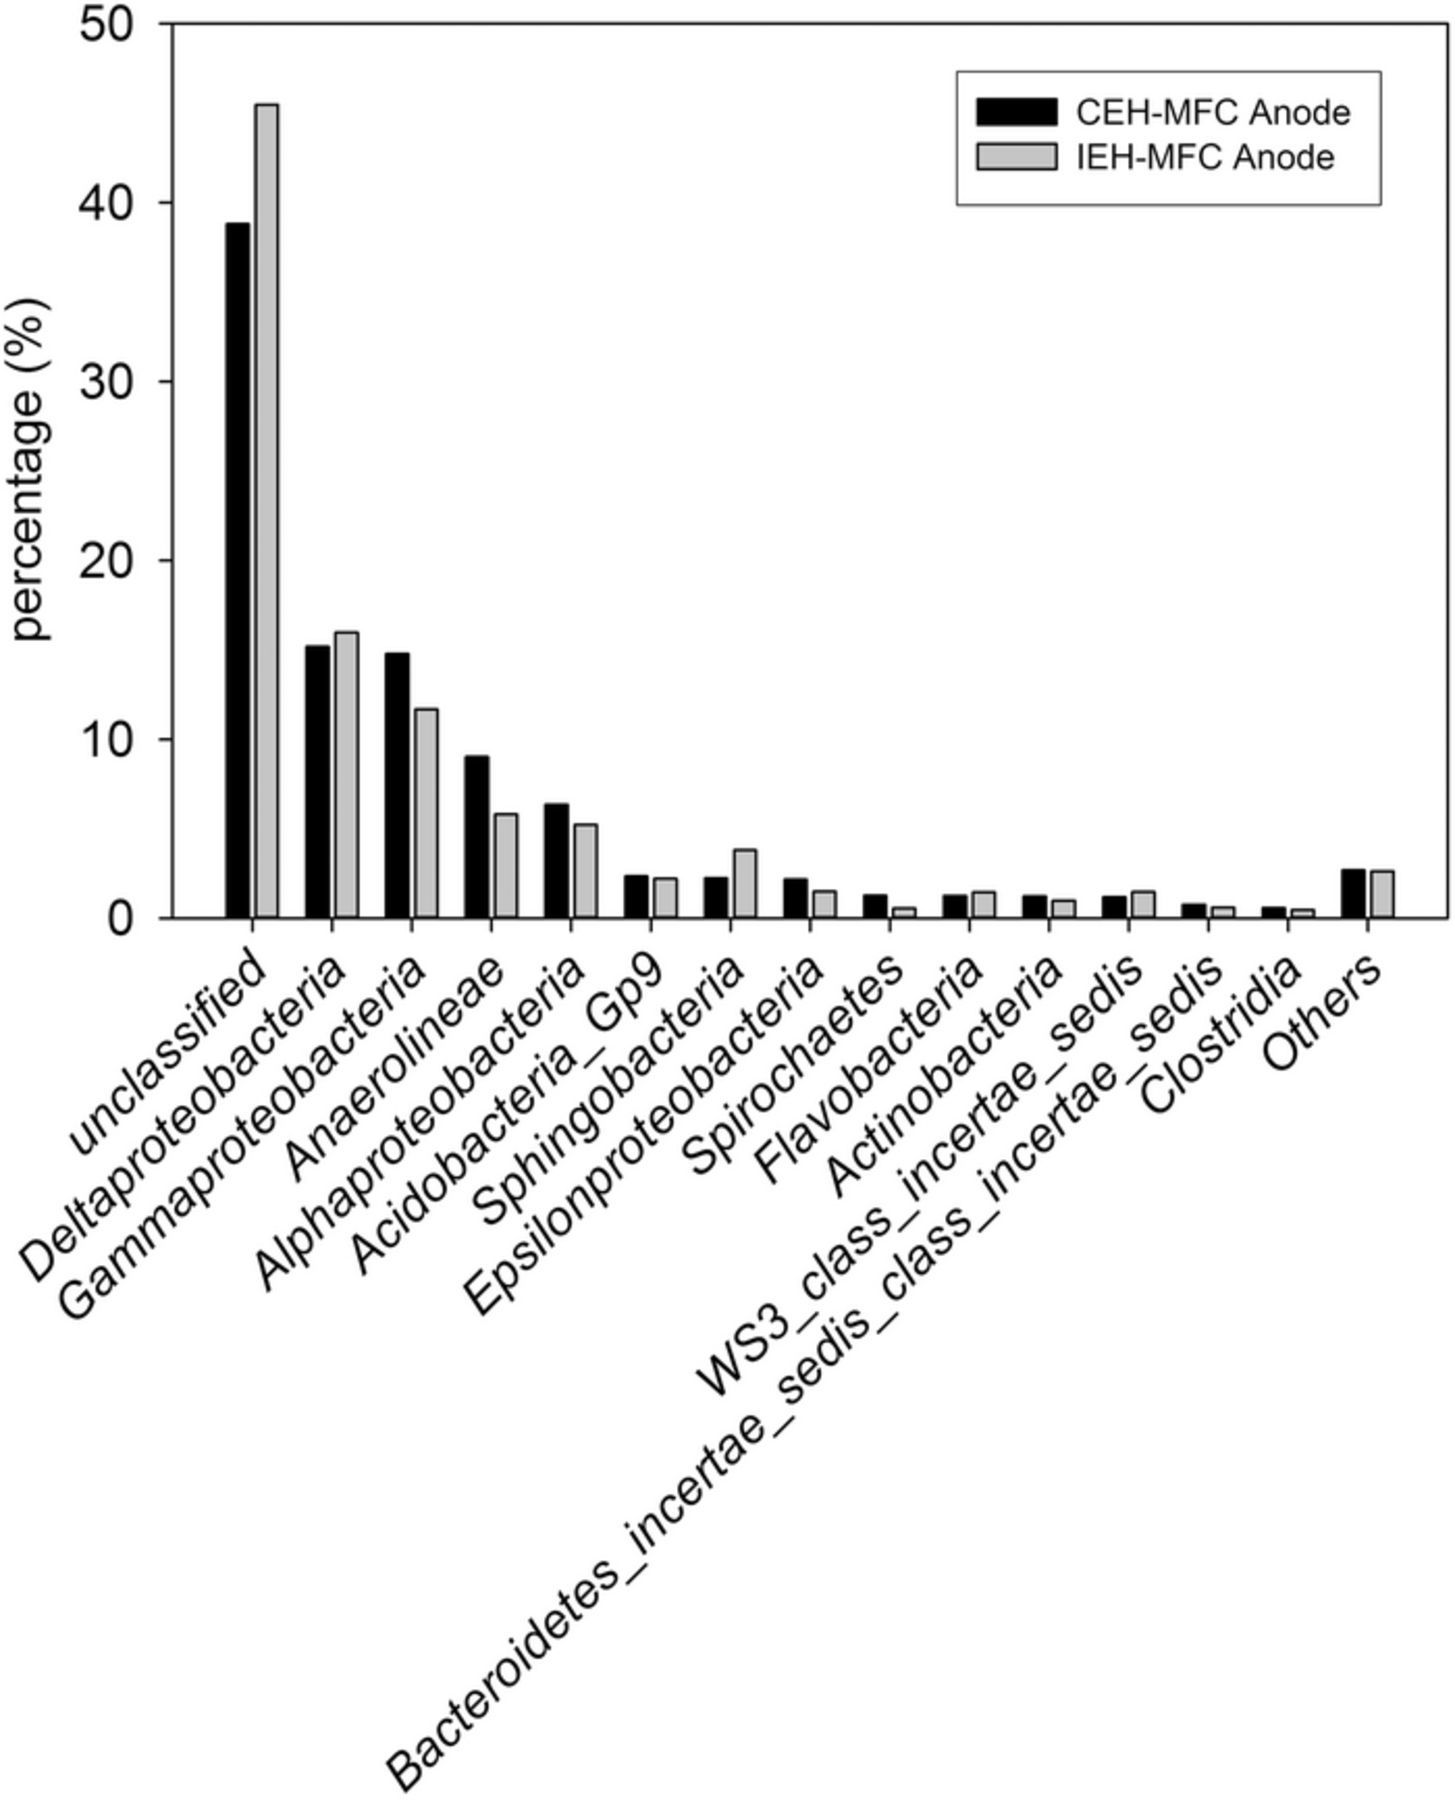
Figure 6. Bacterial community structure on anode electrodes harvested from CEH-MFC and IEH-MFC systems.
Besides the unclassified group, the community structure at the cathodes for both systems appeared to be dominated by α- and γ-proteobacteria (Figure 7). The IEH-MFC systems had a diminished abundance of α-proteobacteria in comparison to the CEH-MFC systems (26.9% for IEH-MFC systems and 35.2% for CEH-MFC systems). The abundance of γ-proteobacteria was slightly lower in CEH-MFC systems (21.8% vs 23.1%), while the rest of the community structure appeared to be similar between the IEH-MFC and CEH-MFC systems. For both types of systems, δ-proteobacteria were significantly less abundant in the cathode community structure compared to their presence at the anode.
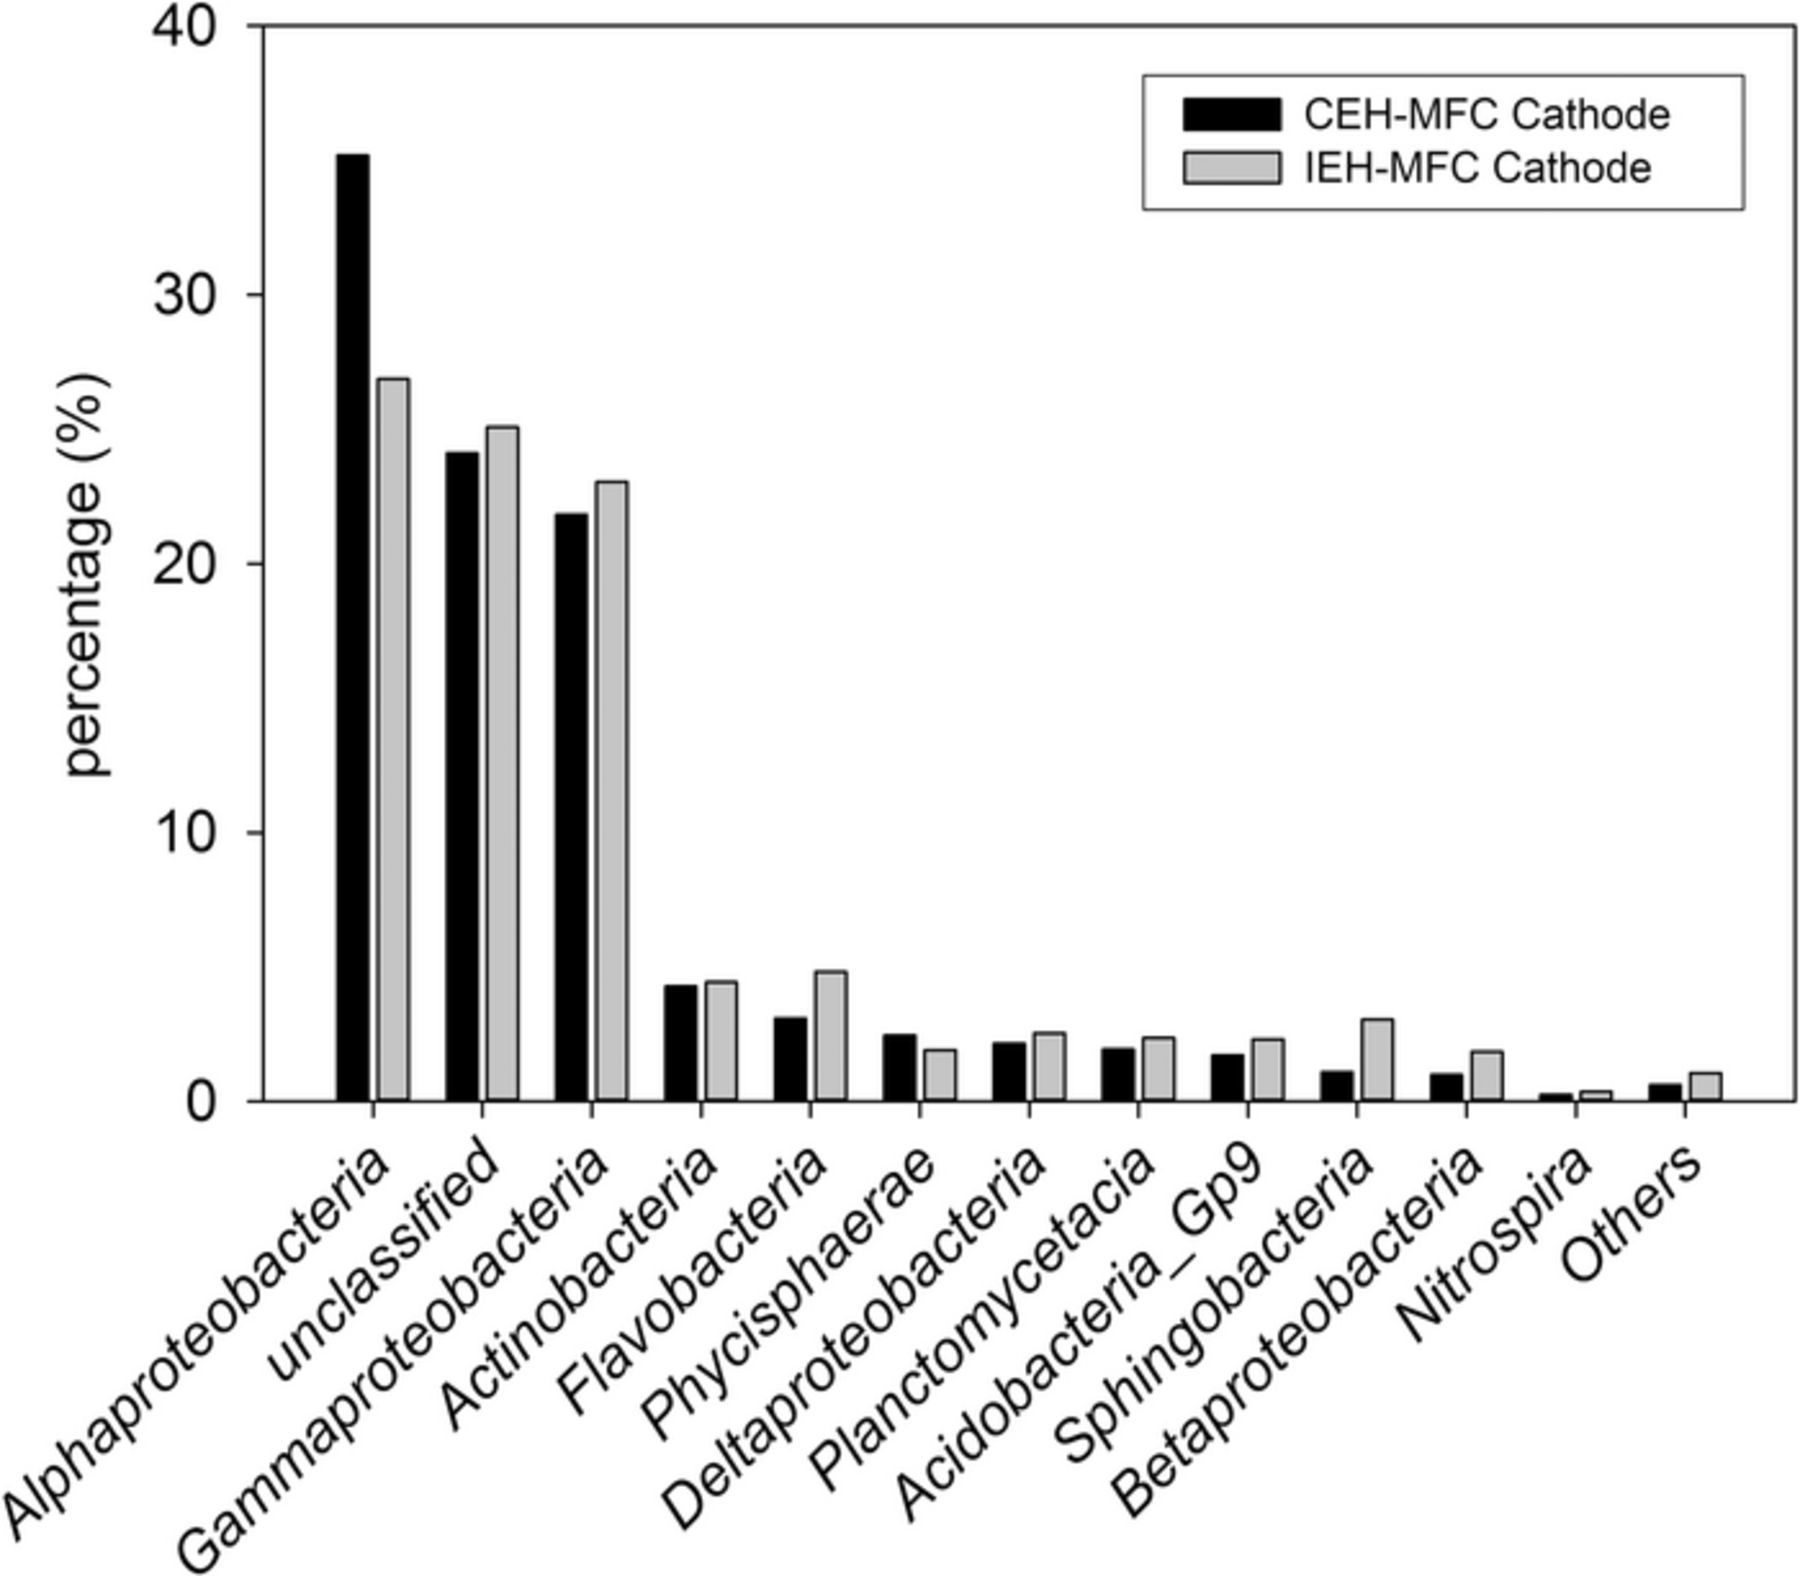
Figure 7. Bacterial community structure on cathode electrodes harvested from CEH-MFC and IEH-MFC systems.
Discussion
The power from the IEH-MFC systems and the CEH-MFC systems were quite comparable among the tests performed after optimization of IEH-MFC systems. The main difference between these systems was the variability of the MFC potential during operation. The potential of IEH-MFC systems were fairly dynamic, fluctuating as the capacitor was charged and discharged. The potential of the CEH-MFC systems was relatively constant in comparison. These operations reflect two dominant energy harvesting strategies proposed for microbial fuel cells, i.e. IEH and CEH.
Anode and cathode potentials were monitored during the startup period for these systems and showed distinct differences in behavior (Figure 4). The IEH-MFC systems were able to generate power almost immediately after installation, but were severely cathode limited in the beginning, i.e. the observed overpotential for the anode was much less than the overpotential for the cathode. As the system began to generate more power, the cathode appeared to become more conditioned and the anode gradually became the limiting electrode. In contrast, the CEH system anodes always showed a significantly greater overpotential than the cathode, indicating that they systems were always anode limited from the beginning.
The conditioning of the cathodes is marked by the reduction of overpotential required for current to flow in the SMFC system. Evidence of this is seen as the cathode potentials are monitored over time. Previous studies suggest that this is likely due to the formation of a catalytic biofilm.33–35 In our controlled environment, a 12-hour day-night light cycle is provided. However, we did not observe periodic variations in power that could be attributed to a phototrophic community. This suggests the activity of the cathode is more likely attributed to a biofilm providing a mechanism of direct or mediated electron transfer.
The difference in electrode behavior may result from the development of a cathodic biofilm that would help facilitate oxygen reduction.33 For these systems, the open circuit potential for these cathodes in aerated seawater is typically around +400 mV |Ag/AgCl. The IEH-MFC systems is attempting to hold the operating potential of the SMFCs around defined setpoints, and thus immediately drew cathode potential to less than +100 mV |Ag/AgCl. On the other hand, the cathodes from CEH-IEH systems operated close to +300 mV |Ag/AgCl at the beginning of the experiment. The lower potential at the cathode for IEH-MFC systems indicates a higher amount of direct oxygen reduction on the cathode surface, leading to hydrogen peroxide and other peroxide radicals.33,35,36 This could inhibit the formation beneficial cathodic biofilms that could be assisting MFC operation during steady state.
Measurements of electrode potential during operation indicated that all the systems, regardless of energy harvesting strategy, were primarily anode-limited at steady state, i.e. the overpotential required for current production at the anode was much greater than the overpotential required for current production at the cathode. The potential of the anode appeared to be the most affected by changes in the load, either due to capacitor charge-discharge cycling or resistor changes. Despite the variance in operating potential at steady state, the power output from the two different systems remained very similar. This finding suggests that power output of these systems around a maximum power point is not very sensitive to the anode potential.
A difference in observed power between IEH-MFC systems that were started at optimal conditions, and IEH-MFC systems were previously operated at non-optimal conditions and then switched to optimal conditions was very striking. The systems that were previously operated under non-optimal potentials appeared to suffer when finally switched to our optimal conditions. Although, unoptimized operation may have affected the observed power output during testing, the general relationships between power production and potential window were assumed to be correct. The impact on performance could have been due to several factors including length of operation, non-optimal microbial community structure, chemical fouling of electrodes, or any combination of these mentioned. Nevertheless, it appears that because the previous operating conditions of an MFC will have an impact on steady state, steady-state power production and should be considered when these systems are integrated in deployable systems.
Anodic biofilms have been reported to be more adept at growing under low external resistance, or high anode potentials in anode-limited systems. Aelterman et al. reported that anode potential had no effect on startup time, but that anode potentials did influence maximum power production in poised systems.37 Another study has suggested that the history of a MFC has an effect on steady-state microbial community structure if operating conditions change.38 Modeling efforts have also been performed to assess the effects of anode potential and confirm its key role in MFC operation.39 In all of these studies, it appeared that the anode potential present during biofilm development and system startup has an effect on steady-state performance.
It is possible that an unoptimized anode potential may lead to increased passivation by sulfur deposits or establishment of insulating non-electroactive biofilms at the anode surface. This may explain our poor performance of the IEH systems (compared to CEH systems) that had a history of operating at different potentials. Reimers et al. suggests that passivation may be exacerbated by lower pH conditions.40 The oxidation of organic matter in the SMFC system will produce protons. However, the pH of the system is governed by mass transport around the anode. More rapid production of organic material is expected at higher anode overpotentials that would lead to lower pH levels around those particular anodes, leading to increased sulfur-based passivation. Both mechanisms would decrease the available surface area for current production and could explain the difference in power production.
In our experiments, we also saw that the communities of the IEH and CEH systems operated at similar potentials were nearly identical and that the power production of the systems at steady state were also very comparable. This outcome is similar the study by White et al. who reported that communities were most different during startup and the similar community structures were observed once steady-state power had been achieved.41 That study indicated that a diverse community structure had populated the anodes by peak power. This diversity was reduced under steady-state power production, indicating that the entire community observed in during SMFC startup does not contribute to electricity production. This non-contributing fraction of the community may foul parts of the anode during startup, reducing active surface area during steady-state operation.
These findings suggest that it is important to operate IEH systems such that the average operating potential of the MFC does not stray too far from the optimal potential, i.e. they should be operated with a narrow potential window around the optimum external load. These findings support the findings previous studies mentioned above37–39 that operating at a specific optimal potential for an MFC throughout its operation will produce the best steady-state performance.
The different operating strategies for the MFC systems did yield slightly different communities for the anode and cathode biofilms. Despite these differences, the power outputs for the systems remained fairly similar. The data indicate that while certain members of the community are critical and need to be present, more subtle differences in community structure do not affect overall power output. Further data is needed to explore this aspect of SMFCs to judge the sensitivity of performance to the abundance of microbial groups.
The analysis of the anodic biofilm is in agreement with previous studies suggesting that dominant players an MFC anodes are iron reducers (γ-proteobacteria) or sulfate reducers (δ-proteobacteria).27,40,42 The presence of both α- and γ-proteobacteria at the cathode, along with previous studies33,34,42 may suggest some form of iron cycling as iron oxidizers (α-proteobacteria and γ-proteobacteria) and iron reducers (γ-proteobacteria) could both be present in the cathodic biofilm. Though, it is unclear if this activity is occuring at the cathode and should be studied with a more in-depth transcriptomic and proteomic study of SMFC biocathodes.
Conclusions
In this study, we compared the effects of two predominant energy harvesting strategies on power output and community structure of sediment microbial fuel cells (SMFCs). These two strategies, intermittent energy harvesting (IEH) and continuous energy harvesting (CEH), both resulted in similar power outputs at steady state of around 1 mW. The IEH strategy showed maximum power during operation between 0.4–0.5 V, while the CEH strategy operated in a similar potential range.
The startup methods and behavior for the two energy harvesting strategies was very different. The CEH systems were gradually started from open circuit potentials and were always anode limited, while the IEH systems were started immediately and were initially cathode limited, then transitioned to anode-limited at steady state. Since both systems generated similar power at steady state, it appears that allowing the system to come to open circuit and starting gradually may not be necessary to achieve optimal steady-state performance, and provides significantly more power in the short term.
Microbial community analysis of the anode and cathode communities showed similar groups present in both strategies, with minor differences in abundance. While power remained relatively similar between the systems, the results suggest that power output from these systems may not be very sensitive to relative abundance of certain microbes on the electrodes as long as key catalytic players are present.
Altogether, the results suggest little benefit to steady-state power production of one strategy over the other in microbial fuel cell systems enriched from natural sediment. More importantly, the startup behavior did seem to be affected by the choice of energy harvesting and will need to be studied in more depth with regards to optimizing the time to steady state and whether electrode communities can be established more quickly. Improving these characteristics will provide more useful sediment MFC systems as the technology moves into field-deployed scenarios.
Acknowledgments
This work was supported by the U. S. Office of Naval Research (ONR), grants N000140910090 and N0001414WX20018. Additional support was provided by the SPAWAR Systems Center Pacific's Naval Innovative Science and Engineering program and the ASEE Naval Surface Warfare Center Postdoctoral Fellowship program and NSF Career Award 0954186 for Timothy Ewing and Haluk Beyenal. The ONR Naval Research Enterprise Internship Program also provided valuable support.