Abstract
This study focuses on voltage cycling induced degradation of cathodes with different loading (0.4 and 0.1 mgPt/cm2) when applying square wave or triangular wave based accelerated stress tests (ASTs) between 0.6 and 1.0 VRHE. The degradation of the H2/O2 and H2/air performance upon extended voltage cycling (up to 30000 cycles) was analyzed in terms of the voltage loss contributions from ORR kinetics, O2 mass transport resistances and proton conduction resistances in the cathode. The extent of cathode thinning due to carbon support corrosion was determined by post mortem electrode thickness measurements. Square waves were found to cause a more rapid loss of ECSA and mass activity compared to triangular waves, which was shown to be due to the longer hold periods at high potentials rather than to the rate of the potential transient. The observed increase of the O2 mass transport resistance with voltage cycling was found to mainly depend on the available Pt surface area, while mass transport resistances due to carbon corrosion were found to be insignificant. Finally, it was shown that by lowering the upper potential limit to 0.85 VRHE, low-loaded catalyst layers can sustain 30000 potential cycles without degradation of the H2/air performance.
Export citation and abstract BibTeX RIS

This is an open access article distributed under the terms of the Creative Commons Attribution 4.0 License (CC BY, http://creativecommons.org/licenses/by/4.0/), which permits unrestricted reuse of the work in any medium, provided the original work is properly cited.
Currently, proton exchange membrane fuel cells (PEMFCs) are on the verge of widespread commercialization as an alternative power source for the automotive market, impressively demonstrated by the launch of PEMFC based vehicles by Toyota,1 Hyundai,2 and Honda3 in recent years. The major hurdle for a significant market penetration of PEMFC vehicles in the near future is the reduction of system cost and the amount of platinum, while meeting long-term durability targets.4,5 Despite remarkable achievements in lowering the Pt loading of the cathode catalyst layer in state-of-the-art membrane electrode assemblies (MEAs) down to ≈0.1 mgPt/cm2,6–8 recent studies have shown that additional overpotentials occur at low loadings and high current density.8–11 Even though the exact origin of these losses is subject to ongoing discussions in the literature, its occurrence was directly correlated to the available Pt surface area in the cathode, i.e., to the cathode roughness factor (rf, defined as Pt surface area per geometric surface area in units of cm2Pt/cm2), so that it is often referred to as Pt specific O2 mass transport resistance ( ).8–10 Additionally, it is well-known that MEAs degrade under the dynamic load-cycles relevant for automotive applications due to the associated voltage cycles. This made extended voltage cycling tests a frequently applied accelerated stress test (AST) to probe the durability of the cathode catalyst layer. Despite various reports in the literature employing different aging protocols, such as applying square wave (SW) potential perturbations or constant high potential phases, the most commonly applied aging protocol is based on triangular wave (TW) potential perturbations between cell voltages of 0.6 and 1.0 V at a scan rate of typically 50 mV/s.12–21
Thermodynamically, the carbon black support for the noble metal catalyst in the MEA is not stable under fuel cell operating conditions, since the equilibrium potential of the carbon oxidation reaction (COR) is only 0.2 VRHE (considering CO2 as reaction product).22 Fortuitously, the sluggish kinetics of the COR prevent the oxidation of carbon at potentials < 0.9 VRHE, i.e., within the typical fuel cell operating range,17,23,24 and therefore enable its use in the cathode catalyst layer. On the other hand, high voltage periods, occurring for example during system start-up or shut-down, can oxidize the carbon structure in the catalyst layer, eventually leading to a loss of void volume and a thinning of the electrode (often referred to as "cathode thinning").25–27 Since a sufficiently large void volume is crucial for the transport of O2 through the cathode catalyst layer, significant corrosion of the carbon support causes an increase of the O2 mass transport resistance and a decrease of PEMFC performance. In addition, carbon corrosion was found to cause a detachment of Pt from the carbon support, leaving the Pt nanoparticles electrically disconnected from the electrode, which decreases the available electrochemical surface area (ECSA) of Pt. Another source of ECSA loss during ASTs are repetitive changes of the cathode potential, leading to oxidation and reduction of the Pt surface.13,14,20 Upon its reduction/oxidation, Pt surface atoms can dissolve from the nanoparticle into the electrolyte as ionic species, eventually redepositing on existing Pt nanoparticles via a process referred to as Ostwald ripening, resulting in an increase of the average Pt particle size and an associated ECSA loss.28,29 Furthermore, as long as the electrode is held at high potentials, Pt ions can diffuse in the electrolyte phase towards the membrane where they can react with cross-over hydrogen to form electrically insulated Pt deposits within the membrane phase.30 Since these Pt deposits can no longer contribute to the electrochemical processes in the cathode catalyst layer, a significant decrease of the ECSA is observed.
To gain a better understanding of the aging processes occurring during voltage cycling ASTs, high-loaded (0.4 mgPt/cm2) and low-loaded (0.1 mgPt/cm2) MEAs were exposed to different potential cycling profiles: square waves, triangular waves, and triangular waves with an upper and lower potential hold (TW–H). The associated losses of ECSA and ORR mass activity were quantified by cyclic voltammetry and by differential flow H2/O2 performance measurements, respectively. Furthermore, the performance degradation of differential flow H2/air polarization curves was analyzed by quantifying the proton conduction resistance via electrochemical impedance spectroscopy (EIS) and by determining the oxygen transport resistance via limiting current diagnostics. The comparison of MEA performance vs ECSA over the course of extended voltage cycling provides insights into the voltage cycling induced increase of the O2 transport resistance. In addition, by deliberately corroding the carbon support through a high-potential hold of the cathode, where substantial carbon corrosion occurs (1.2 Vcell for 8 h), resulting in pronounced cathode thinning at a reasonable ECSA retention, we were able to distinguish between the impact of carbon corrosion and ECSA loss on the limiting current measurements. Comparing the various voltage cycling protocols, it could be shown that the higher degradation observed for square wave compared to triangular wave modulation were due to the extended time at high potentials in the former rather than to the voltage ramp rate between upper and lower potential. Our analysis also showed that the oxygen transport resistances developing over the course of voltage cycling ASTs predominantly depends on the specific current density (in units of A/cm2Pt), independent of the initial Pt loading of the MEAs.
Experimental
Comprehensive experimental details on MEA preparation and fuel cell testing are given in our previous publication,11 but the most pertinent information is given below. All potentials referred to in cyclic voltammograms and in voltage cycling experiments are referenced to the reversible hydrogen electrode (RHE) potential at a nominal H2 pressure of 100 kPaabs (VRHE). This was obtained by correcting for the Nernstian shift of the hydrogen anode if the H2 partial pressure was different from 100 kPaabs. For the voltage cycling tests conducted under H2/N2 (anode/cathode) at 100 kPaabs, 80°C, 100% RH, the different applied potential limits of 0.60, 0.85, and 1.00 VRHE correspond to cell voltage limits of 0.59, 0.84, and 0.99 Vcell. If not stated otherwise, area-normalized currents (e.g., cm2) refer to the geometric area of the electrode. Furthermore, note that all pressures were measured and controlled at the inlet of the fuel cell and are stated as absolute pressures.
Membrane electrode assembly preparation
All fuel cell tests were conducted with 5 cm2 MEAs, fabricated by the decal transfer method. Catalyst inks were prepared by mixing the catalyst with a low equivalent weight ionomer in a water-solvent dispersion (Asahi Kasei, 700 EW). To realize the same electrode thickness (identical carbon loading of 0.4 mgC/cm2), two catalysts with different Pt/C ratio were used. For low-loaded catalyst layers, a 20%wt Pt/Vulcan catalyst (TEC10V20E, Tanaka Kikinzoku Kogyo K.K., TKK) and for high-loaded catalyst layers, a 50%wt Pt/Vulcan (TEC10V50E, TKK) was used. The ink components were added into a 15 mL capped bottle (HDPE), already containing 16.5 g of 5 mm ZrO2 beads as grinding medium in the following sequence: catalyst, water, 1–propanol, and finally the ionomer dispersion. The water concentration of the ink was 10%wt, while the solid content was 0.03 g/mLink to obtain a suitable viscosity for the coating process. The ionomer to carbon weight ratio (I/C) was 0.65. The inks were mixed by placing the bottles onto a roller-mill (60 rpm) for 18 h at room temperature. Thereafter, the inks were coated on virgin PTFE using the mayer rod technique with the appropriate bar on a coating machine. The same type of anode was used for all experiments, namely 0.1 mgPt/cm2 consisting of 20%wt Pt/C (TEC10V20E, TKK) with an I/C ratio of 0.65. The MEAs were assembled by hot pressing a 15 μm membrane (Asahi Kasei) placed between the anode and cathode decals at 155°C for 3 min with an applied force of 0.11 kN/cm2. The cathode loadings were 0.1 mgPt/cm2 and 0.4 mgPt/cm2, with a maximum deviation of ±5%, as determined by weighing the decals before and after the catalyst layer transfer. For each aging procedure, two independent fuel cell measurements were conducted and subsequently averaged with error bars corresponding to the mean absolute deviation.
Fuel cell testing equipment
Electrochemical measurements were performed on an in-house manufactured, single-cell hardware, using commercial graphite flow fields (0.5 mm lands/ channels; manufactured by Poco Graphite according to our design).31 Gas diffusion layers (GDLs) were supplied by Freudenberg (H14C7) and the GDL compression was adjusted to 20 ± 1% by PTFE coated, incompressible fiberglass gaskets, assembled at a torque of 12 Nm (for details see Simon et al.).32 Fuel cell tests were performed on automated test stations (G60, Greenlight Innovation) equipped with a potentiostat (Reference3000, Gamry) to conduct electrochemical impedance spectroscopy (EIS).
Voltage cycling procedure and diagnostic measurements
The experimental testing procedure is depicted in Figure 1. All MEAs were conditioned prior to testing, using a voltage-controlled ramp-in procedure (H2/air flows of 1390/3320 nccm at 80°C, 100% relative humidity (RH), and 150 kPaabs): 0.6 V for 45 min, 5 min at OCV, and 10 min at 0.85 V. This sequence was repeated 10 times, after which constant performance was reached. Before each set of differential flow polarization curves and diagnostic measurements, an MEA recovery step was implemented, which consisted of a hold time in H2/air (2000 nccm/5000 nccm) at 0.3 V for 2 h at 40°C, 270 kPaabs, and 100% RH. The purpose of this procedure is to recover reversible losses prior to catalyst layer characterization.
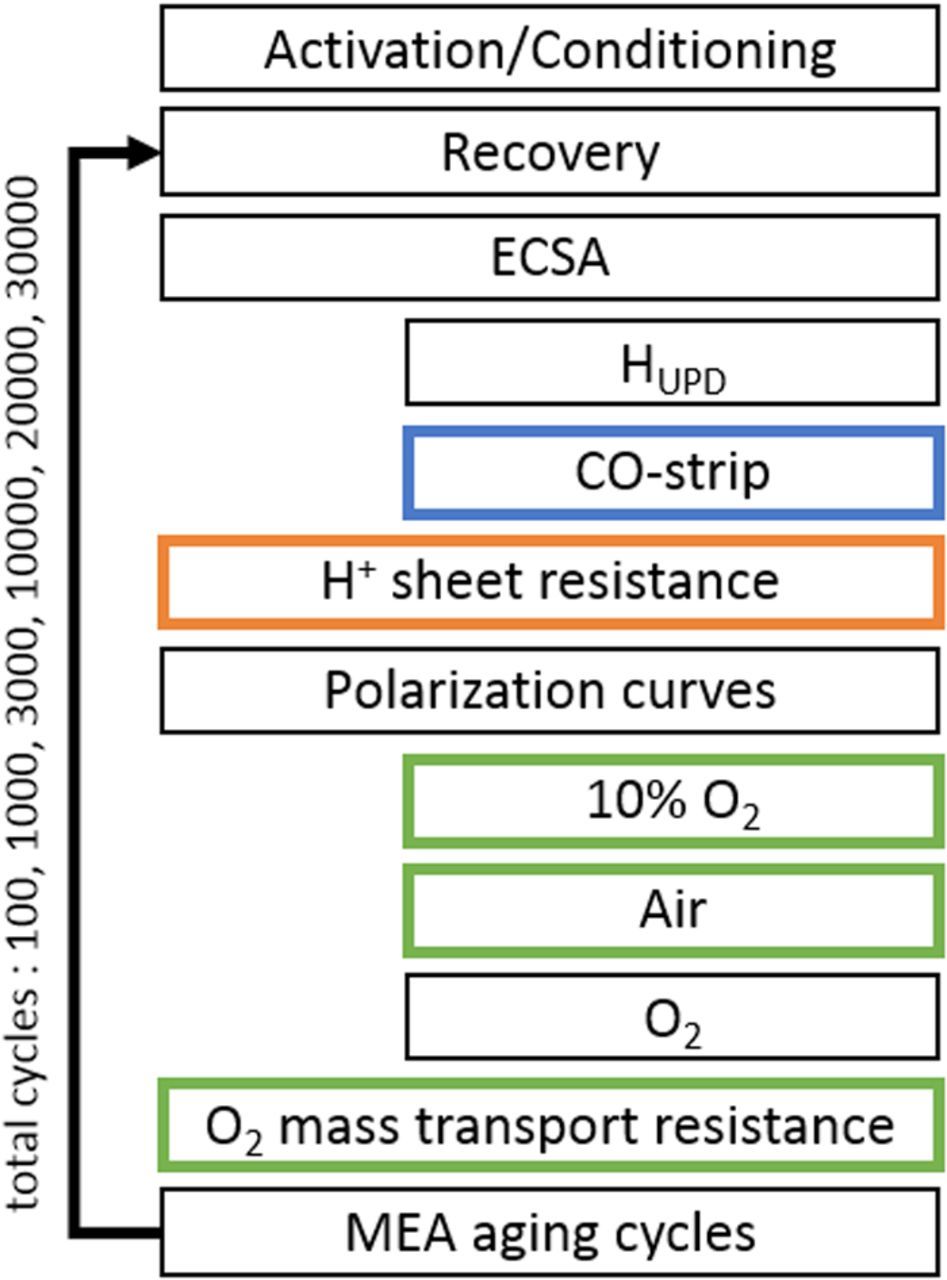
Figure 1. Overview of the experimental procedure for MEA aging. Complete MEA characterization (differential flow H2/O2 and H2/air curves, cyclic voltammetry, CO stripping, limiting current measurements, and EIS) was performed at beginning-of-test (BOT) and end-of-test (EOT). The color of the boxes indicates the type of MEA characterization after specific MEA aging cycles: after every aging cycle (black); only at BOT and EOT (orange); after 10000 and 20000 cycles (blue), after 10000 cycles (green).
Cyclic voltammograms (CVs) of the cathode electrode were recorded between 0.07 and 1.00 VRHE at a scan rate of 150 mV/s, at 40°C and ambient pressure, while the ECSA was evaluated from CVs with a limited upper potential of 0.6 VRHE by averaging the H-desorption and H-adsorption charge (using a specific charge of 210 μC/cm2Pt). The counter/reference electrode was fed with 200 nccm of fully humidified 5% H2 in N2, and the working electrode was initially purged with dry N2 at 50 nccm, while interrupting the gas flow to record the CVs.
CO stripping was done by adsorbing CO (10% CO in N2, 100 nccm) for 10 min at 40°C and 150 kPaabs while maintaining the cathode potential at 0.1 VRHE. Subsequently, residual CO was removed from the cell and the gas lines by purging with nitrogen for ≈1.5 h. A CV from the holding potential to 1.2 VRHE at a scan rate of 100 mV/s was performed to oxidize the adsorbed CO. Two additional sweeps were recorded to verify the full oxidation and removal of CO from the electrode and the gas feed system. The ECSA was determined by integrating the area of the first anodic scan with the subsequent sweep as baseline, using a specific charge of 420 μC/cm2Pt.
The proton conduction resistance of the cathode,  (in units of Ω·cm2), was determined from AC impedance spectra recorded in H2/N2 (anode/cathode) at 0.2 Vcell with a peak-to-peak perturbation of 3.5 mV between 500 kHz and 0.2 Hz (20 points per decade), according to a procedure reported in the literature,33,34 based on a transmission line model.35 In order to ensure reproducibility, the measurement was repeated three times at each condition: 100, 70, 50, and 30% RH, while maintaining constant gas partial pressures (i.e., at cell pressures of 270, 255, 246, and 236 kPaabs, respectively) under differential flow conditions (H2/N2 at 1000/1000 nccm) at 80°C. The proton resistivity,
  (in units of Ω·cm), was calculated by dividing
  by the cathode thickness.
Differential flow polarization curves were recorded in current-control mode at 80°C, 170 kPaabs inlet-controlled pressure, 100% RH for both reactants, and constant flows of 2000 nccm of H2 on the anode and 5000 nccm of O2, air, or 10% O2 (balanced with N2) on the cathode. Anode and cathode were operated in counter flow mode. At these conditions, the inlet to outlet pressure drop in anode and cathode was about 2 and 22 kPaabs, respectively. Prior to recording a polarization curve from low to high current densities, the cathode potential was held at 0.75 V for 15 min to reduce Pt-oxides; each current density point was held constant for at least 10 min and the resulting voltage was averaged over the final 30 s. The ORR kinetics (mass activity, specific activity, and Tafel slopes) were determined from H2/O2 polarization curves after application of two corrections: i) the potential was corrected for the iR-drop, using the high frequency resistance (HFR) obtained from the x-axis intersect in the Nyquist plot measured by galvano electrochemical impedance spectroscopy (GEIS) in the frequency range from 100 kHz to 10 Hz at each current density (applying a 10% AC amplitude with respect to the current, limited to a minimum/ maximum of 0.1/3.0 A); ii) the current was corrected for the ohmic short of the membrane, as well as for the H2 crossover, both determined in H2/N2 (150/600 nccm) at 170 kPaabs, 80°C, and 100% RH by applying a constant potential of 0.2, 0.3, 0.4, 0.5, 0.6 and 0.7 V for 2 min each.
The total mass transport resistance ( ) was extracted from limiting current measurements at 80°C and 100% RH under differential flow conditions (2000 nccm of H2 and 5000 nccm of O2/N2 mixtures).15,36,37 The dry mole fraction of oxygen was altered from 4 to 24% O2 in N2, while the cell potential was set to 0.30, 0.15, 0.10, and 0.05 V for 2 min each. To quantify pressure-independent and pressure-dependent oxygen transport resistances, limiting current measurements were also conducted at 170, 270, 350, and 500 kPaabs.
Aging of the cathode electrodes was performed at 100 kPaabs, 80°C, 100% RH and H2/N2 flows of 200 nccm/75 nccm on anode/cathode, respectively. In voltage cycling ASTs, various potential profiles were examined that are depicted in Figure 2: triangular wave modulation between a lower potential of 0.6 VRHE and an upper potential of either 1.0 VRHE (referred to as "TW", a) or a lower upper potential limit of 0.85 VRHE (referred to as "TW–LUPL", d) at 50 mV/s; square wave (SW, b) modulation between 0.6 and 1.0 VRHE; and triangular wave modulation with a potential hold at the lower (0.6 VRHE) and upper (1.0 VRHE) potential (referred to as "TW–H", c). Voltage cycling ASTs were controlled by a potentiostat (Reference3000, Gamry). To avoid reductive currents during potential cycling, all residual O2 was removed from the humidifier and gas line system by a N2 purging procedure, lasting about 45 min. The scan rate for all TW procedures was 50 mV/s, while the potential step in the SW procedure was completed in less than 0.1 seconds (corresponding to an average rate of >4 V/s). The hold times of 8 s at the vertex potentials in the SW procedure was chosen such that it is identical to the overall time required for one TW cycle (compare Figures 2a and 2b).
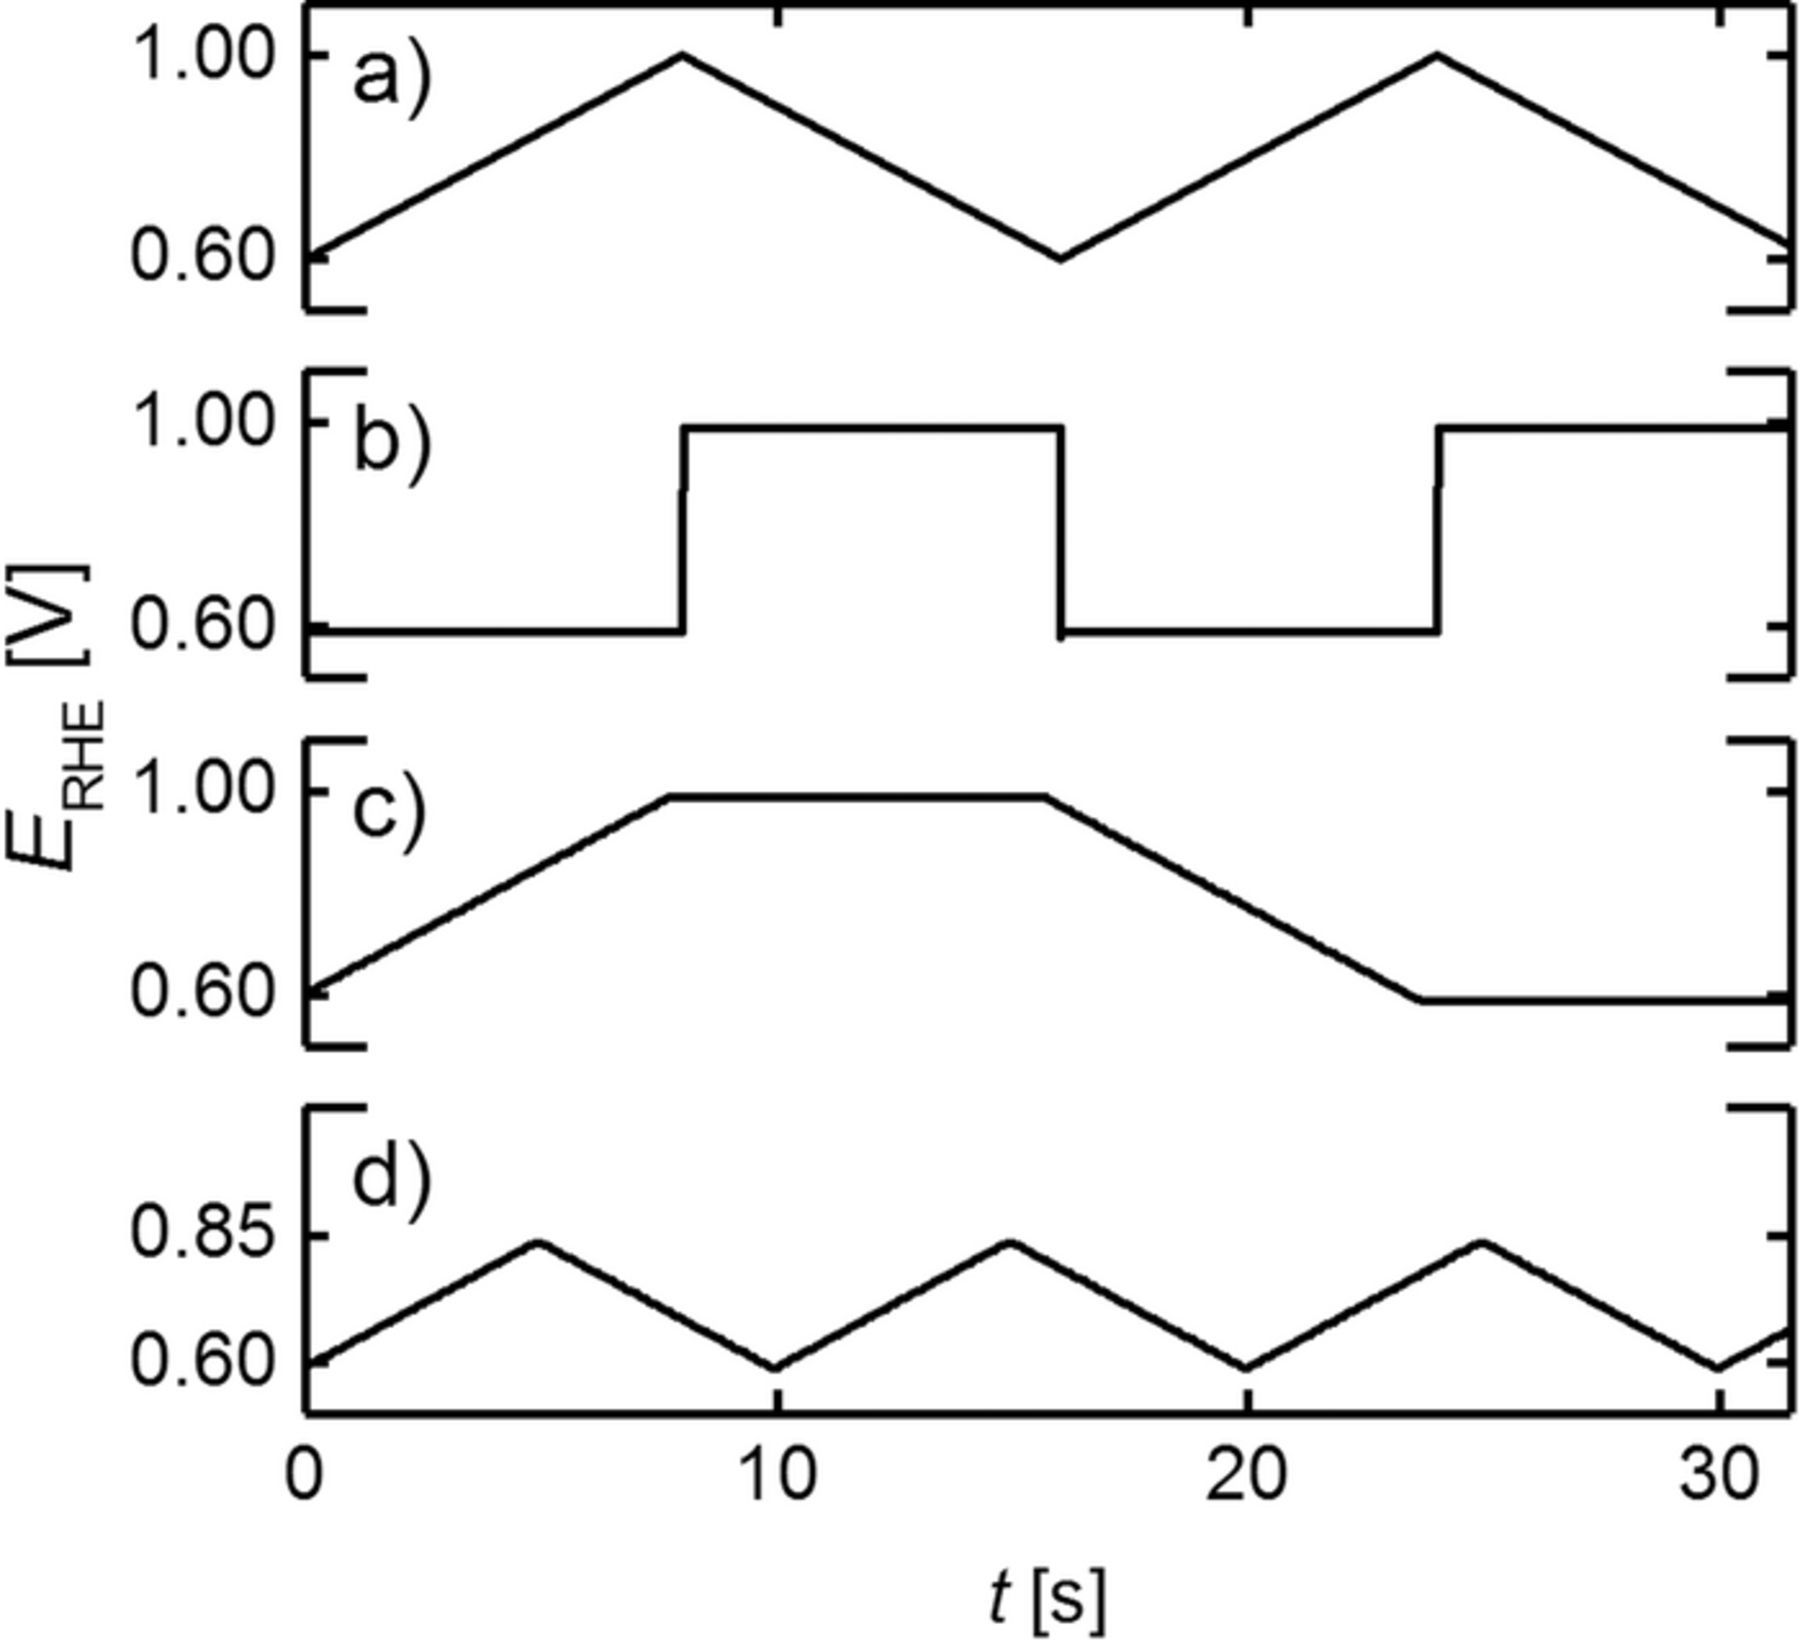
Figure 2. Voltage profiles used in voltage cycling ASTs performed at 100 kPaabs, 80°C, 100% RH and H2/N2 flows of 200 nccm/75 nccm on anode/cathode, respectively. a) triangular wave modulation ("TW") between 0.6 and 1.0 VRHE (corresponding to 0.59 and 0.99 Vcell) at a scan rate of 50 mV/s; b) square wave modulation ("SW"), applying a hold time of 8 s at the lower (0.6 VRHE) and upper (1.0 VRHE) potential; c) triangular wave modulation at a scan rate of 50 mV/s with 8 s potential hold at the lower (0.6 VRHE) and upper (1.0 VRHE) limits ("TW–H"); d) triangular wave modulation at 50 mV/s between 0.6 VRHE and a lowered upper potential limit ("TW–LUPL") of 0.85 VRHE (≡0.84 Vcell). The combination of an anodic and a cathodic scan is referred to as one cycle in this study.
Electrode thickness determination by SEM
The thicknesses of pristine (BOT), as well as aged MEAs (EOT) were determined from cross-section images, obtained by scanning electron microscopy (SEM). To get a more accurate comparison between BOT/EOT and to exclude any effects of cell assembly on the catalyst layer thickness, the pristine MEAs were assembled in a cell and operated at 80°C, 100% RH and 500 nccm N2/N2 flows at ambient pressure for 24 h before determining their initial thickness. The MEAs were cut in quarters, using one quarter close to the gas inlet and one close to outlet of the cell. The samples were fixed in a Teflon holder and embedded in epoxy resin (EpoThin 2 resin and hardener, Buehler Ltd.) at reduced pressure to remove gas bubbles. After hardening overnight at 40°C, the resin block was removed from the holder, ground on SiC (CarbiMet S, P280, Buehler Ltd.) under constant water flow and thoroughly cleaned by ultrasonification in water. SEM (JCM-6000PLUS NeoScope, Jeol) images were taken in backscattering mode at 15 kV accelerating voltage and a magnification of 2000x at ten arbitrarily chosen locations for each quarter of an MEA, generating 20 images per MEA. The thickness of the electrode was determined by integration of the electrode area with ImageJ (version 1.51j8) and dividing by the length of the image as shown in Figure 3. This way, the entire image is evaluated, which provides a more accurate measure of the catalyst layer thickness compared to a single point measurement.
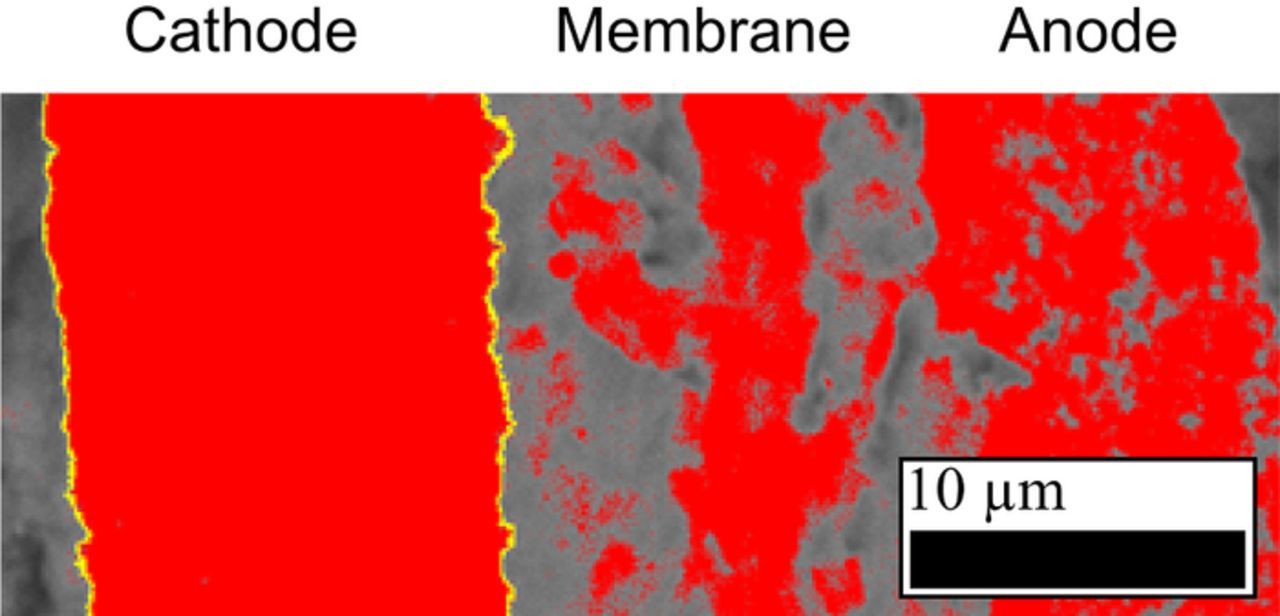
Figure 3. Cross-sectional SEM image of an MEA embedded in epoxy resin and taken at an acceleration voltage of 15 kV and a magnification of 2000x. The cathode edges are marked in yellow and the integrated area in between is shown in red, based on the grayscale of the image. Red areas outside the cathode are not included in the evaluation.
The thickness of pristine electrodes was used to calculate the packing density of the Vulcan carbon based electrodes. The obtained packing density of 22 ± 4 μm/(mgC/cm2) is in reasonable agreement with values in the literature.38 The BOT thickness for all tested MEAs was calculated from the transferred weight of carbon in the hot pressing process and the packing density.
Results and Discussion
In this study, we present the aging behavior of MEAs exposed to different voltage cycling protocols, with the respective voltage transients shown in Figure 2. The most commonly used AST is a potential scan between 0.6 and 1.0 VRHE at a scan rate of 50 mV/s and 80°C in inert gas atmosphere, termed TW in this manuscript (Figure 2a). In addition, many researchers reported the aging behavior of MEAs exposed to square wave (SW) voltammetry (Figure 2b), since the combination of fast potential transients and hold periods has proven to accelerate catalyst layer degradation.39,40 However, it is not well-understood yet, whether the holding time at the respective potential or the fast transient from one to the other potential is the dominating factor for the observed electrode degradation. To deconvolute between TW and SW modulations, triangular scans were combined with a potential hold period (TW–H) in order to eliminate the fast potential step while maintaining the effect of the hold time (Figure 2c). Furthermore, electrode aging by a TW modulation between 0.6 and 1.0 VRHE will be compared to a TW modulation with the same lower voltage limit but with a lowered upper potential limit of 0.85 VRHE (TW-LUPL), where carbon support corrosion can safely be assumed to be negligible and where Pt dissolution rates are expected to be reduced (Figure 2d). Finally, our study is complemented by a potential hold experiment at 1.2 Vcell for 8 h (under N2 at 95°C, 100% RH, and 100 kPaabs) to degrade the carbon support structure via COR, while maintaining a reasonably high electrode roughness factor. All of the aging procedures were conducted on high-loaded (0.4 mgPt/cm2) and low-loaded cathodes (0.1 mgPt/cm2) to identify similarities and/or differences in the aging behavior with respect to the ECSA and mass activity originating from different catalyst layer loadings. Moreover, changes of the cathode O2 mass transport resistance upon aging, especially with respect to the local O2 mass transport resistance which is commonly observed to be a function of the electrode rf was of major interest in this study.9,10,41 The utilization of high- and low-loaded catalyst layers enables a comparison over a wide range of rf, i.e., to compare low Pt specific current densities (A/cm2Pt) for high-loaded MEAs (high rf) to high specific current densities after aging of low-loaded cathodes (low rf). However, to establish a valid comparison of the total mass transport resistance, the same catalyst layer thickness was maintained (≈10 μm) for all MEAs at BOT by utilizing a 50%wt Pt/C catalyst for high-loaded and a 20%wt Pt/C catalyst for low-loaded electrodes.
ECSA evaluation: HUPD vs CO stripping
To evaluate the degradation of the Pt surface area over the course of MEA aging, CVs were recorded after each aging stage, exemplarily shown in Figure 4a for a single low-loaded MEA (0.1 mgPt/cm2) exposed to SW aging between 0.6 and 1.0 VRHE (see Figure 2b). To determine the ECSA by integration of the HUPD charge, additional CVs with a limited upper potential (0.6 VRHE) were recorded (not shown) to avoid a contribution of charge originating from the reduction of the Pt surface.42 Due to the above outlined Pt dissolution/redistribution mechanisms, the HUPD features of the CV degrade significantly, i.e., a decrease of the cathode rf is observed over the course of extended voltage cycling. In general, the evaluation of the ECSA via integration of the pseudo-capacitive HUPD current is influenced by a superimposed faradaic current at low potentials, originating from the hydrogen evolution reaction (HER). This superposition is especially dominant at low rf, as the rate of the HER above 0 VRHE in cyclic voltammetry is mostly thermodynamically controlled (i.e., it does not depend significantly on the active Pt surface area), whereas the pseudo-capacitive HUPD charge scales directly with the available Pt surface area. Hence, the strong decrease of the rf in the course of the voltage cycling AST renders the determination of the ECSA via the HUPD method increasingly erroneous, requiring the implementation of CO stripping to reliably determine the remaining Pt surface area for very low rf values,43 i.e., towards the end of the aging protocol.
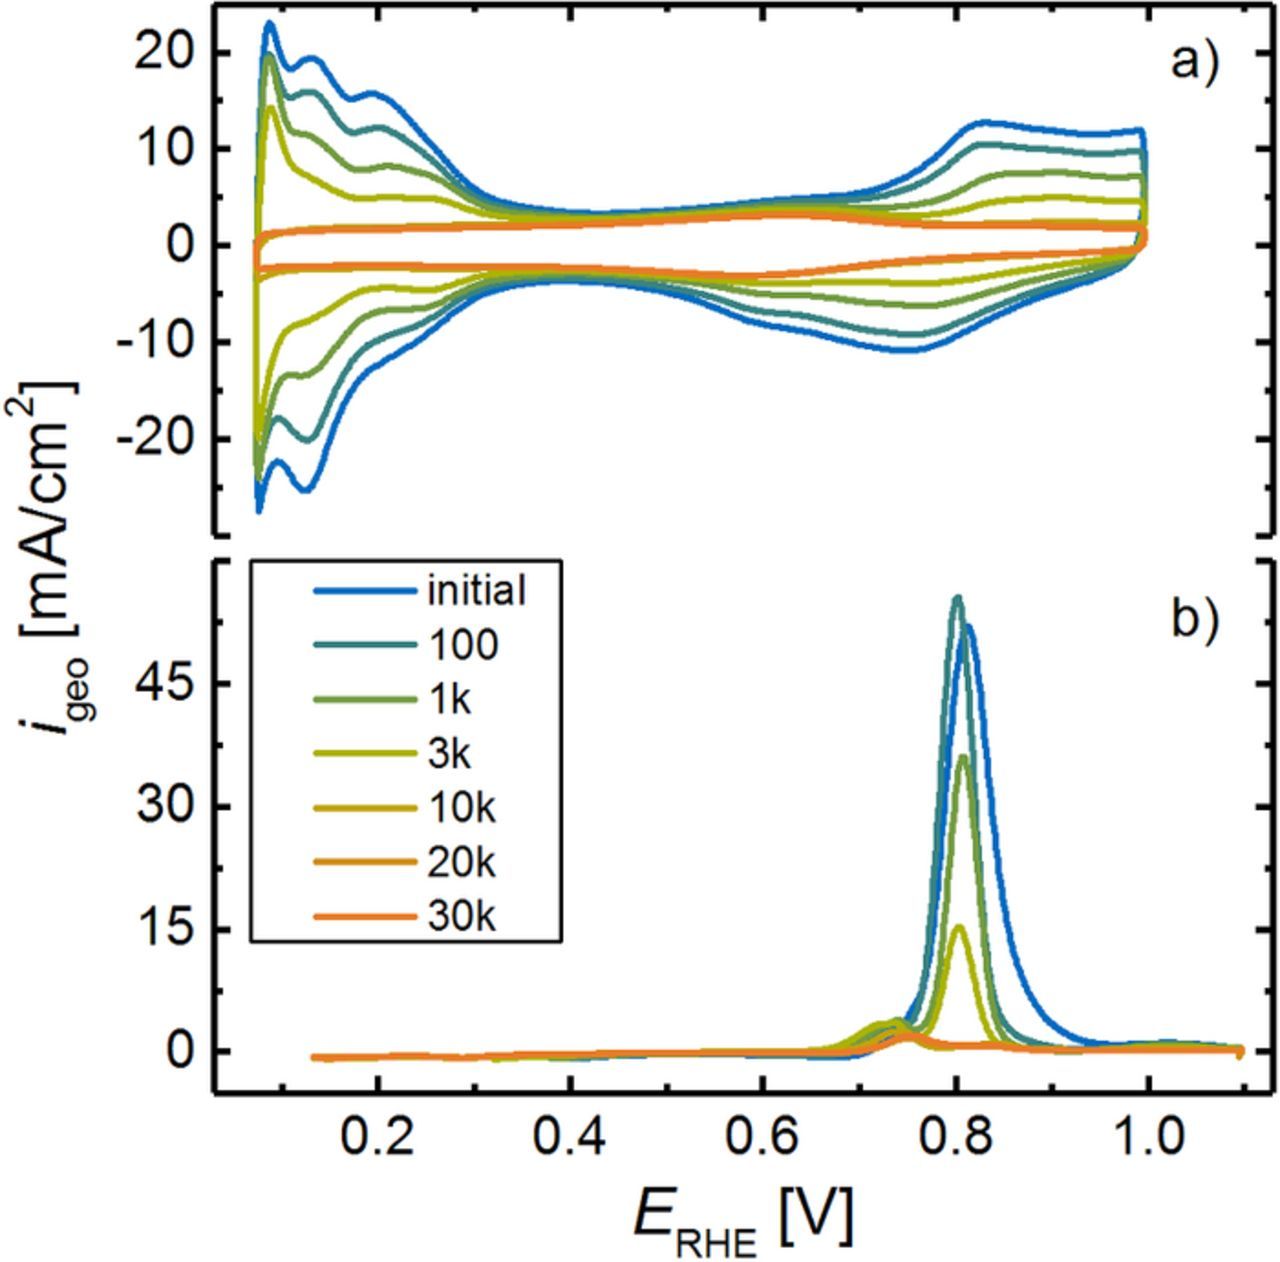
Figure 4. a) CVs of the cathode after different aging stages during a SW-based AST between 0.6 and 1.0 VRHE (see Figure 2b). CVs were conducted at a scan rate of 150 mV/s from 0.07 to 1.00 VRHE at ambient pressure and 40°C (the anode was supplied with 200 nccm of 5% H2 (in N2) and the cathode N2 flow was 50 nccm (set to zero flow when recording the CVs)). b) CO stripping voltammograms after subtraction of the subsequent anodic sweep, recorded at a scan rate of 100 mV/s to 1.1 VRHE at 150 kPaabs and 40°C (constant flows of 200 nccm 5% H2 on the anode and 5 nccm N2 on the cathode). CO was adsorbed for 10 min at a flow rate of 100 nccm prior to the CV, maintaining the potential at 0.1 VRHE. To remove residual CO gas from the cell and the test station, a purging procedure with N2, lasting approximately 1.5 h was executed.
Representative CO stripping measurements are shown in Figure 4b after subtraction of the second anodic scan. The peak for CO oxidation occurs at ≈0.81 VRHE, which is consistent with reports by other researchers for CO oxidation on Pt nanoparticles,44 mainly dominated by CO oxidation on Pt(111) facets.45,46 Furthermore, a second peak at ≈0.74 VRHE is observed, representing Pt(110)-like planes.47 Since those facets are less prone to dissolution upon surface oxidation/reduction, this peak becomes more dominant upon potential cycling. Consistent with the decrease in HUPD features, the charge associated with the oxidation of COads decreases significantly during cathode aging. Since ECSA determination via HUPD is reasonably accurate for high rf values, the charge ratio between HUPD and CO stripping remains constant  throughout the first phase of aging (up to ≈3000 cycles). As the Had formation is not quantitative in the applied potential range (≥ 0.07 VRHE), the ECSA determined by the HUPD method is slightly underestimated compared to the ECSA determined from CO stripping, hence their ratio is below unity.48 In the course of potential cycling, the ratio decreases significantly
  , as the electrode rf approaches very low values where the HUPD currents are small compared to the capacitive current contributions from the carbon support. As CO stripping was only implemented for electrodes with a considerably low rf, and HUPD was the preferred method for ECSA determination (due to its experimental simplicity), comparability of these two techniques was assured by introducing a scaling factor. The scaling factor was calculated as the ratio of ECSA determined by HUPD and CO stripping at BOT and was used to correct the values determined by CO stripping to an "HUPD-derived" ECSA at low rf (denoted by open symbols in figures showing ECSA data in this manuscript).
ECSA evolution during voltage cycling ASTs
A decrease of the ECSA with increasing number of voltage cycles for each cathode loading and aging protocol is given in Figure 5, eventually reaching similarly low ECSA values on the order of 5–10 m2Pt/g after 30000 cycles (apart from the TW-LUPL and CP protocols). Since the change of potential in the applied ASTs results in a repetitive reduction/oxidation of the Pt surface, Ostwald ripening and a loss of Pt into the ionomer phase are expected to be the major contributors to the overall loss of active surface area. The gradual stabilization of the ECSA after extended voltage cycling, also observed in previous studies,49 is likely due to the higher thermodynamic stability of larger Pt particles against dissolution. In contrast to the similar trend of decaying ECSA for all tested samples, its evolution with respect to the aging protocol and the cathode loading differs widely. First of all, it is noteworthy that the ECSA at BOT is higher for low-loaded cathodes (68 ± 1 m2Pt/g) compared to those with a higher loading (55 ± 1 m2Pt/g). As mentioned earlier, the electrode thickness was maintained constant for all tested MEAs (≈10 μm), which required a catalyst with 20%wt Pt content to prepare low-loaded catalyst layers, whereas 50%wt Pt/C was used for high-loaded electrodes. Even though both catalysts were obtained from the same supplier, Pt nanoparticles are commonly more homogeneously dispersed on the carbon support at low Pt to carbon ratio. This leads to a lower degree of Pt agglomeration, hence a lower average particle size and higher ECSA.50 In fact, an evaluation of the particle size distribution (Figure 5c) by counting ≈400 individual particles (in TEM images) revealed a number averaged diameter of 2.8 ± 0.8 nm and 3.2 ± 1.0 nm for 20%wt and 50%wt Pt/C, respectively. As reported frequently by other researchers, Ostwald ripening is more pronounced for small particles compared to larger ones due to their intrinsically lower stability versus dissolution upon oxidation/ reduction.19 In accordance with this, for any given aging protocol, a faster decay of the ECSA is observed for low-loaded (orange colored in Figure 5) compared to high-loaded cathodes (blue colored in Figure 5). In summary, the observed relatively stronger ECSA fade for lower catalyst layer loadings in this study is not primarily caused by the cathode loading itself, but is most likely due to the different aging behavior of Pt nanoparticles with different size and different degrees of agglomeration.
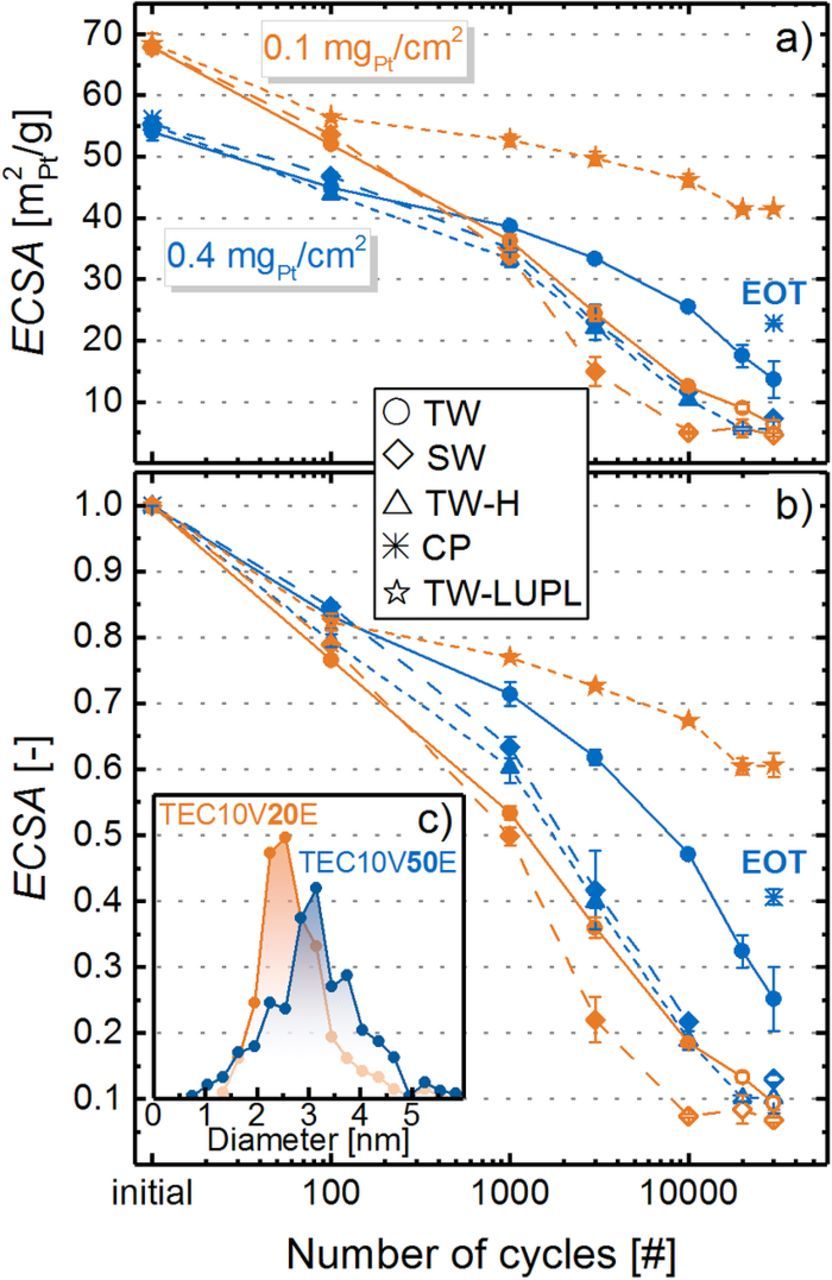
Figure 5. a) Cathode ECSA of all tested MEAs with cathode loadings of 0.4 mgPt/cm2 (blue symbols) and 0.1 mgPt/cm2 (orange symbols), recorded for TW cycling between 0.6 and 1.0 VRHE (s. Figure 2a; solid lines, circles) as well as SW cycling between 0.6 and 1.0 VRHE (s. Figure 2b; long-dashed lines, diamonds). For 0.4 mgPt/cm2 loadings, also a TW-H profile (s. Figure 2c; short-dashed lines, triangles) was examined, while for 0.1 mgPt/cm2 loadings a triangular cycle with a lowered upper potential limit of 0.85 VRHE (s. Figure 2d; short-dashed lines, stars) was tested. The single point labeled CP (blue star symbol placed at 30000 cycles) depicts the ECSA after an 8 hour hold at 1.2 Vcell, (under N2 at 95°C, 100% RH, and 100 kPaabs), where substantial carbon support oxidation occurs. For high rf values, the ECSA was evaluated from the integration of the Hupd area, shown by a full symbol in the graph; for low rf values, the ECSA was determined by CO stripping and corrected by the scaling factor to allow comparability with the ECSA determined from HUPD (denoted by open symbols). b) ECSA evolution over voltage cycling normalized to its initial value. The error bars represent the mean absolute deviation between two independently conducted experiments for each AST. c) Particle size distribution for the 20%wt Pt/C catalyst (orange) and the 50%wt Pt/C catalyst (blue).
Comparing different aging protocols, the ECSA loss is more pronounced for MEAs subjected to SW aging (long-dashed lines) compared to TW aging (solid lines), resulting in a dramatically low ECSA already after 10000 square wave cycles between 0.6 and 1.0 VRHE (11 m2Pt/g for high-loaded and 5 m2Pt/g for low-loaded cathodes). The accelerated degradation caused by square wave compared to triangular wave aging has frequently been observed for PEMFCs,40 as well as in liquid electrolyte.39 There are four possible hypotheses to rationalize the faster degradation during SW cycling: i) a more significant carbon corrosion due to an extended hold period at high potential, eventually resulting in Pt particle detachment, accompanied by a thinning of the cathode catalyst layer; ii) the fast potential transient of the square wave modulation (>4 V/s) could induce more severe Pt dissolution forced by a fast reconstruction of the Pt surface from an oxidized to a reduced state; iii) the holding time at high potential induces a growth of the oxide, resulting in a stronger dissolution in the subsequent cathodic scan;51 or, iv) the hold time at high anodic potentials provides more time for Pt dissolution and diffusion through the ionomer phase. As was shown by Cherevko et al., polycrystalline Pt in 0.1 M H2SO4 dissolves at constant anodic potential during about 600 s which is in the same order of magnitude as the dissolution during a potential transient.52 The constantly released Pt ions can diffuse towards the membrane, where they are reduced by H2 permeating through the membrane from the anode, causing a redeposition of electrically disconnected Pt particles within the ionomer phase.20 The following analysis will shed some light onto the origin of the different aging of MEAs exposed to SW or TW potential profiles as well as at the degradation caused by holding at high potential to deliberately corrode the carbon support.
To investigate whether significant carbon support corrosion takes place over the course of the various voltage cycling protocols, which should lead to cathode thinning, MEA cross sections were prepared at EOT and imaged by SEM. Since the initial thickness of the electrodes at BOT could not be determined by SEM without damaging the MEA, the packing density of high-loaded and low-loaded catalyst layers was evaluated by measuring the thickness and catalyst loading of pristine MEAs (amounting to 22 ± 4 μm/(mgC/cm2), see experimental section), from which the initial thickness of each MEA could be calculated by its measured catalyst weight. The catalyst layers exposed to TW or SW aging between 0.6 and 1.0 VRHE (Figures 6a/6b/6d/6e) show no catalyst layer collapse compared to a pristine MEA (Figure 6c), eliminating carbon corrosion as a likely contributor to the overall degradation. Interestingly, the catalyst layers depicted in Figures 6a/6b and 6d/6e show a bright area at the cathode/membrane interface, representing an accumulation of Pt in the membrane phase, caused by precipitation of dissolved Pt in the ionomer phase.20,30 However, due to the rather qualitative nature of such SEM images, no conclusion on the quantitative differences between the amount of deposited Pt during TW and SW cycling can be drawn, even though the larger ECSA loss in the SW protocol points towards a higher amount of disconnected Pt. The absence of cathode thinning was also confirmed for all other cathode electrodes which had been subjected to voltage cycling tests, whose thicknesses was found not to change between EOT and BOT, as is shown in Figure 6f. Quite clearly, carbon support corrosion must be rather minor over 30000 voltage cycles between 0.6 and 1.0 VRHE since any significant carbon corrosion is accompanied by cathode thinning (noticeable once ca. 5–7% carbon are corroded).53 However, we cannot fully exclude the possibility that a small extent of carbon corrosion might occur (small enough to not lead to cathode thinning), which then could contribute to the observed ECSA degradation by a particle detachment mechanism. To determine the effect of substantial carbon support corrosion on the ECSA, cathodes were held for 8 hours at 1.2 Vcell (under N2 at 95°C, 100% RH, and 100 kPaabs), which resulted in a decrease of the catalyst layer thickness by ≈40%; despite the large extent of carbon corrosion, the ECSA remained at a reasonably large value of ≈22 m2Pt/g (blue asterisks in Figure 5).
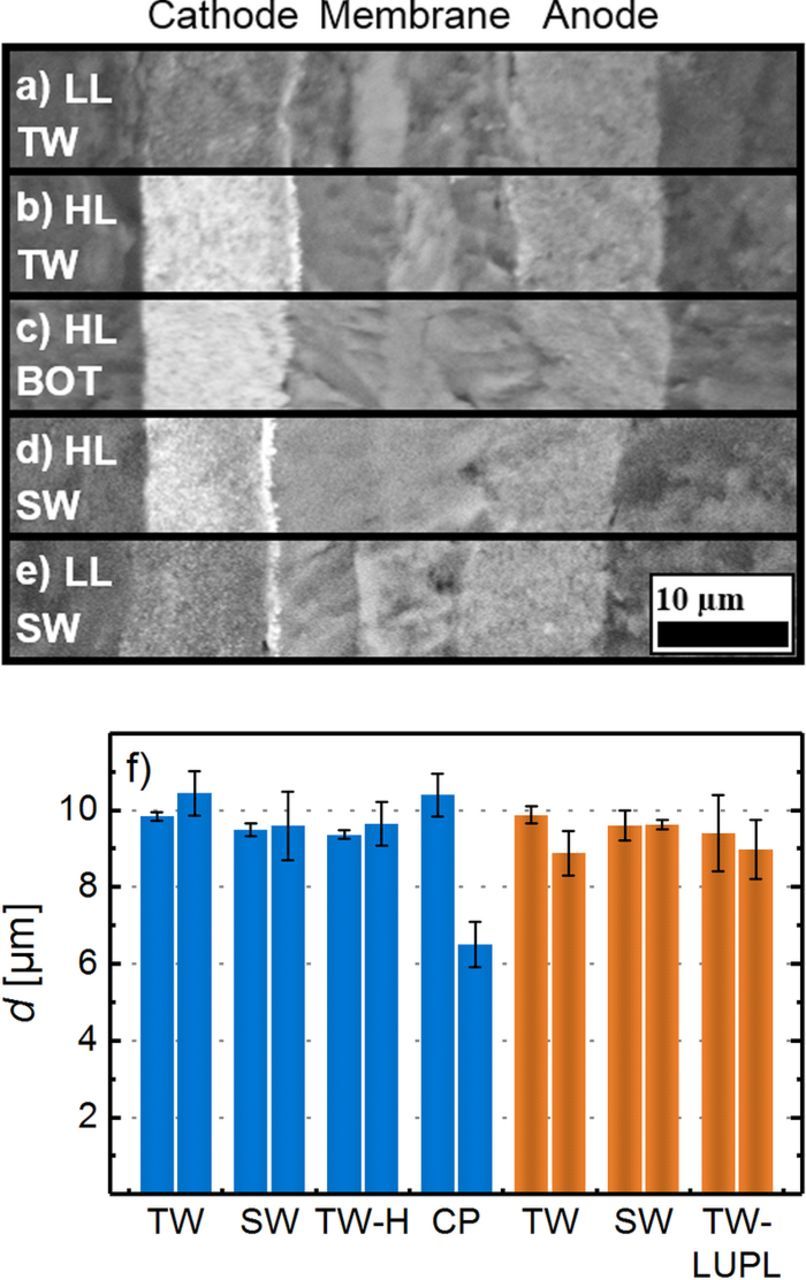
Figure 6. SEM cross-section images of MEAs at BOT and after 30000 potential cycles: low-loaded MEAs (0.1 mgPt/cm2) after TW (a) and SW (e) aging between 0.6 and 1.0 VRHE. High-loaded catalyst layers (0.4 mgPt/cm2) of a pristine MEA (c), an MEA after 30000 TW cycles and c) an MEA after SW cycles between 0.6 and 1.0 VRHE. Images were taken by SEM at a magnification of 2000x in electron back-scattering mode. f) Average cathode thickness of MEAs subjected to different aging protocols both at BOT (left-hand bars in each group) and at EOT (right-hand bars in each group), with high-/ and low-loaded cathodes shown in blue/orange color, respectively. The error bars represent the standard deviation between two independently conducted experiments for each aging protocol; voltage cycling aging protocols are described in Figure 2 and CP refers to cathodes subjected to an 8 hour potential hold at 1.2 Vcell (under N2 at 95°C, 100% RH, and 100 kPaabs).
To obtain further insights into the origin of the faster degradation upon SW aging, seeking to differentiate between ECSA loss caused by the holding time at high potential which might enhance Pt loss into the membrane phase and that originating from the fast Pt oxidation/reduction transient in SW cycling, the potential step in the SW protocol was replaced by a potential sweep with the same scan-rate as in the TW protocol (Figure 2c). This voltage cycling AST is referred to as TW–H. As shown in Figure 5, the decrease of the cathode ECSA over the course of SW (blue long-dashed line, diamonds) and TW-H (blue short-dashed line, triangles) is identical, indicating that the rapid potential transient has no influence on the ECSA degradation and that it is rather the holding time at each potential that is the controlling factor. This can either be explained by the higher oxide coverage of Pt formed at longer holds at high potential, which Gilbert et al. hypothesized to lead to a larger extent of Pt dissolution during a subsequent step to lower potentials at which the oxide is reduced, leading to faster ECSA losses for SW profiles.51,39 An alternative explanation is that the holding time at high potentials allows for a longer time of Pt dissolution and subsequent diffusion in the ionomer phase towards the cathode/membrane interface, where it can deposit as electrically insulated particles by reduction with cross-over hydrogen. The latter mechanism would explain the apparently higher accumulation of Pt at the cathode/membrane interface for the SW compared to the TW modulation suggested qualitatively by the above SEM analysis (compare Figures 6a/6b and 6d/6e). Therefore, our experiments suggest that the faster degradation by SW cycling is caused by a more severe Pt dissolution and simultaneously allowing sufficient time for Pt diffusion towards the cathode/membrane interface and its deposition as electrically insulated particles, rather than by carbon support corrosion or the fast voltage transient. It shall be mentioned that the aging per time interval was in fact smaller for TW-H compared to SW, since both methods showed a similar degradation per cycle while one scan in the TW-H procedure required double the time (32 sec) compared to SW (16 sec). However, the cathode potential remains below 0.9 VRHE for a substantial fraction of the time, while we believe that higher potentials are most detrimental for the ECSA.
To probe the degradation at lower potentials, a triangular scan procedure with a lower upper potential limit (TW-LUPL) of 0.85 VRHE (orange star symbols and short-dotted lines in Figure 5) was tested. In this case, carbon corrosion most certainly will not play a role, so that aging from Pt detachment from the carbon support can surely be excluded (the above analysis suggests, carbon corrosion is not a major contributor to ECSA loss even for upper potentials as high as 1.0 VRHE). In addition, Pt dissolution/redeposition effects should also decrease substantially, since the degree of Pt surface oxidation is limited, leading to less Pt dissolution, hence to a smaller overall ECSA loss (40% after 30000 aging cycles).20 Since the ECSA loss during TW-LUPL is comparatively low, we conclude that most of the additional time during TW-H compared to SW is non-damaging, e.g. below 0.85 VRHE. We therefore believe that the lower amount of ECSA loss per time (not per cycle) in the TW-H procedure can be mainly attributed to the additional time at these low, non-damaging potentials. In the light of the rather small ECSA loss when limiting the upper potential to 0.85 VRHE (TW-LUPL) compared to the TW aging protocols with an upper potential limit of 1.0 VRHE for which ECSA losses of ≈90% over 30000 cycles are observed, avoiding high voltages (e.g., OCV) appears highly advisable to maximize PEMFC durability.
AST induced ORR activity changes
Assuming simple Tafel kinetics for the ORR according to Equation 1, lowering the cathode rf over the course of ASTs should directly cause an increase of the ORR overpotential according to:6,54
![Equation ([1])](https://content.cld.iop.org/journals/1945-7111/165/6/F3118/revision1/d0001.gif)
where η denotes the ORR overpotential in mV, TS is the Tafel slope in mV/dec, i denotes the current density in A/cm2, i0 is the exchange current density in A/cm2Pt, and rf denotes the roughness factor in cm2Pt/cm2.
In Figure 7a, differential flow H2/O2 polarization curves at 80°C and 100% RH are shown for all AST protocols at BOT and after 30000 aging cycles. First of all, a voltage offset is observed in the initial polarization curves of low-loaded (solid orange lines) compared to high-loaded (solid blue lines) cathodes at BOT. Based on simple Tafel kinetics (Equation 1) and an ORR Tafel slope of 70 mV/dec, four times lower Pt cathode loadings should result in an approximately four times lower roughness factor (as the catalyst ECSA is very similar) and thus to an additional overpotential of ≈42 mV at the same current density, which is in excellent agreement with the observed offset between high- and low-loaded MEAs (e.g., 737 ± 3 mV vs 695 ± 8 mV at 1.5 A/cm2 (42 ± 11 mV) for high- and low-loaded electrodes, respectively).
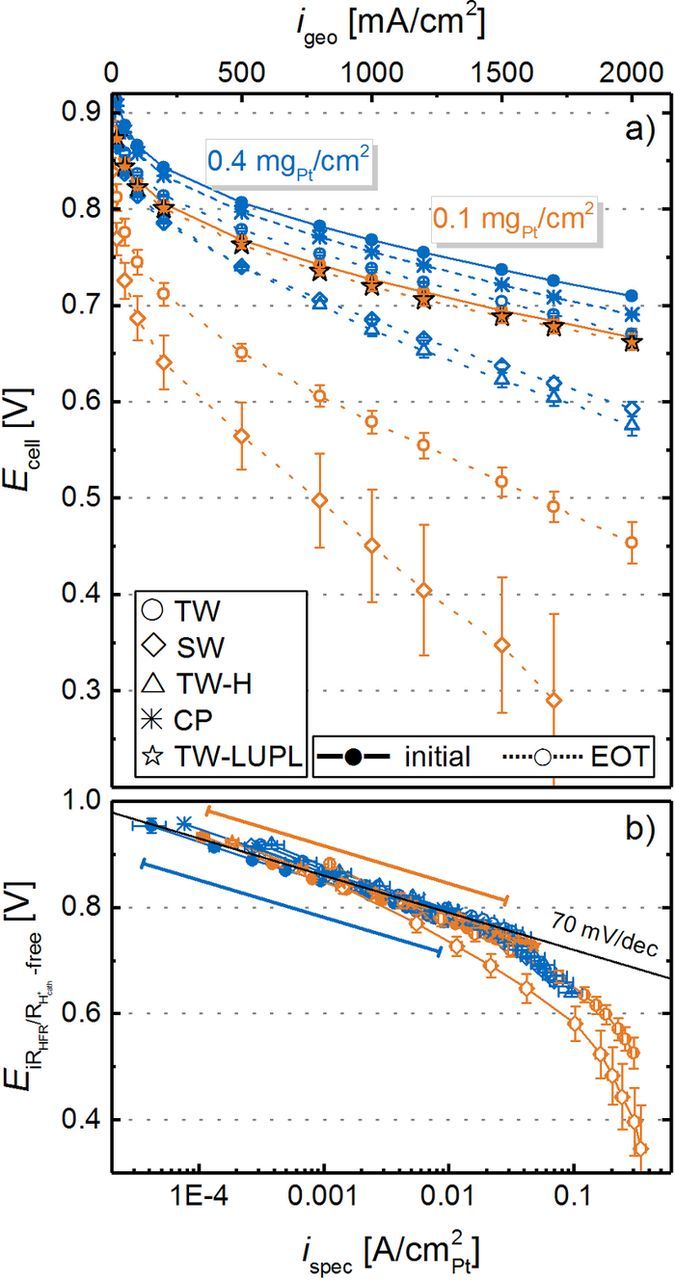
Figure 7. Differential flow H2/O2 (2000/5000 nccm) performance for MEAs with 0.4 mgPt/cm2 (blue lines/symbols) and 0.1 mgPt/cm2 (orange lines/symbols) cathodes at BOT (solid lines and filled symbols) and at EOT, i.e., after 30000 voltage cycles or an 8 hour hold at 1.2 Vcell (dotted lines or hollow symbols). a) Measured cell voltage curves at a pressure of 170 kPaabs, a temperature of 80°C, and an RH of 100%. b) Tafel plot representation normalized to the ECSA, corrected by the HFR, the effective proton conduction resistance, as well as by the H2 crossover and electrical short current. BOT polarization curves of all tested MEAs were averaged and error bars represent the standard deviation of all tested MEAs. Error bars for EOT curves represent the mean absolute deviation between two measurements. The two slanted lines in b) indicate the specific current density region for high-loaded (blue) and low-loaded (orange) MEAs at BOT.
Over the course of 30000 voltage cycles (≡ EOT condition), the polarization curves of all tested MEAs degrade significantly, with a more severe performance decay for low-loaded MEAs (e.g., 214 mV loss at 2 A/cm2 for the TW protocol) compared to high-loaded MEAs (39 mV loss at 2 A/cm2). When comparing polarization curves from different aging protocols, the previously identified higher ECSA loss for SW compared to TW cycling correlates well with the observed performance difference in the O2 polarization curve at EOT for both loadings. Furthermore, a similar performance decay is observed for the TW-H and SW protocol, e.g., a voltage of 593 ± 8 mV for SW and 575 ± 1 mV for TW-H at 2 A/cm2 and EOT, which is in accordance with the comparable loss of ECSA. In contrast to the other AST protocols, EOT polarization curves for the TW-LUPL protocol do not show any degradation compared to BOT, reflecting the comparably low degradation of the ECSA.
To determine the specific ORR activity for each MEA, the polarization curves were corrected by the HFR (RHFR), the H2 crossover current ( , on the order of ≈4 mA/cm2), the shorting current (ishort), the effective proton conduction resistance in the cathode catalyst layer (
 ), and were normalized to the Pt surface area (Figure 7b). As expected for H2/O2 polarization curves dominated by kinetic overpotentials, all data points fall on a straight line, with a BOT Tafel slope of 70 ± 3 mV/dec for high-loaded and 73 ± 3 mV/dec for the low-loaded MEAs. After 30000 voltage cycles, the apparent Tafel slope of high-loaded MEAs, determined in the low current density region (50–500 mA/cm2), increases to 79 ± 1 mV/dec for TW aged MEAs and more significantly (≈90 mV/dec) for the SW and TW–H aging protocols. Tafel slopes of around 120–160 mV/dec were observed for low-loaded MEAs subjected to 30000 TW and SW cycle protocols, while the Tafel slope remained unchanged over the course of the TW-LUPL voltage cycling AST. An increasing Tafel slope upon aging was also observed by other researchers,21 and is attributed to additional, non-kinetic overpotentials, such as O2 mass transport or proton transport losses which apparently increase with extended voltage cycling. Since the electrode thickness remained unchanged (Figure 6f), even for the most damaging aging protocols (SW and TW-H), a hindrance of the gas phase mass transport caused by a deterioration of the overall catalyst layer structure can be excluded. Although, slight corrosion of the catalyst support and a concomitant slight decrease of the available pore volume cannot be fully excluded, cathode thinning was clearly not observed by SEM in any of our experiments. Additionally, changes of the Tafel slope due to loss or restructuration of the ionomer can be excluded as the proton transport resistance did not change significantly upon voltage cycling (not shown) and major chemical degradation of the ionomer can be excluded due to the absence of oxygen in the largest fraction of the experimental time.56
We would like to emphasize that these measurements were performed with pure O2, where gas phase O2 transport resistances can be excluded as possible cause for the increasing apparent Tafel slopes. It is also worth noting that these severe and unassigned mass transport overpotentials occur at similar values of the Pt specific current density (near ≈0.05 A/cm2Pt) in all H2/O2 polarization curves. At high Pt specific current densities, caused by ultra-low rf values, additional voltage losses have also been observed by other researchers.9,10,55 Since this overpotential occurs at high geometric current densities and low cathode rf values, i.e., at high local oxygen flux to the Pt surface, we hypothesize that it is related to oxygen transport limitations at the catalyst/ionomer interface. Suggestions for the observed voltage losses at high Pt-specific currents by other research groups include a limited dissolution of oxygen into the ionomer phase,57 an intrinsically high transport resistance of the thin ionomer phase,58 a limited effective ionomer surface,10,37 or a decrease of the ORR kinetics at low potential.59 Although we cannot exclude any one of these effects, a Pt/ionomer specific resistance appears most reasonable to explain the observed voltage losses at high Pt-specific currents, as the voltage profile shows a shape resembling a mass transport limitation, rather than a kinetic phenomenon.
A linear regression of the measured data in the current density range from 50 to 500 mA/cm2 and extrapolation to 0.9 VRHE yields the kinetic ORR activity at 0.9 VRHE (at 120 kPaabs O2 partial pressure), commonly used to compare the catalytic activity of platinum. It can either be normalized to the measured ECSA to yield the specific current density for the ORR at 0.9 VRHE (i spec0.9 V, Figure 8b) or to the mass of Pt in the cathode catalyst layer to yield the mass activity for the ORR at 0.9 VRHE (i mass0.9 V, Figure 8a) to enable comparability between all experiments. In general, the here determined ORR mass activities at BOT (≈110–140 A/gPt for the 20%wt Pt/V catalyst and ≈85–105 A/gPt for the 50%wt Pt/V catalyst) compare well with those reported by other researchers for Pt supported on Vulcan type carbon.7,60,61 In accordance with the severe ECSA loss in most of the here examined aging protocols, the overall surface available for the ORR decreases significantly from BOT to EOT (low-loaded TW, SW and TW-H: ≈90% ECSA loss), there is also a significant loss of i mass0.9 V over the course of aging for all loadings and aging procedures (see Figure 8a). Comparing TW (solid lines, circles) and SW (long-dashed lines, diamonds), the decrease of i mass0.9 V as a function of cycle number is more pronounced for SW profiles, which is directly correlated to the stronger ECSA loss (see Figure 5). To clarify, the accelerated decrease of i mass0.9 V by SW compared to TW modulations most likely represents a true change in the ORR kinetics, as interference from O2 mass transport resistances in pure O2 in the low current density region (data evaluation was restricted to a maximum current density of 500 mA/cm2) should be negligible. This assumption is reasonably justified since only a slight increase in the apparent Tafel slope was observed upon aging (e.g., 70 ± 3 mV/dec at BOT increases to 86 ± 2 mV/dec at EOT for high-loaded SW cycled cathodes) and since we eliminated regions at high specific current density (where local transport resistances could be important) from the analysis. As expected from our preceding analysis of the ECSA development (see Figure 5), the mass activity of electrodes aged by TW-H cycles is essentially identical to those aged by SW cycles (compare blue triangle and diamond symbols in Figure 8a), underlining our previous hypothesis that the potential hold phase is the dominating factor for MEA degradation during square wave aging. Finally, the ORR mass activity loss over the TW–LUPL procedure (orange stars) is significantly lower compared to the other protocols, which again is in accordance with the lower ECSA loss.
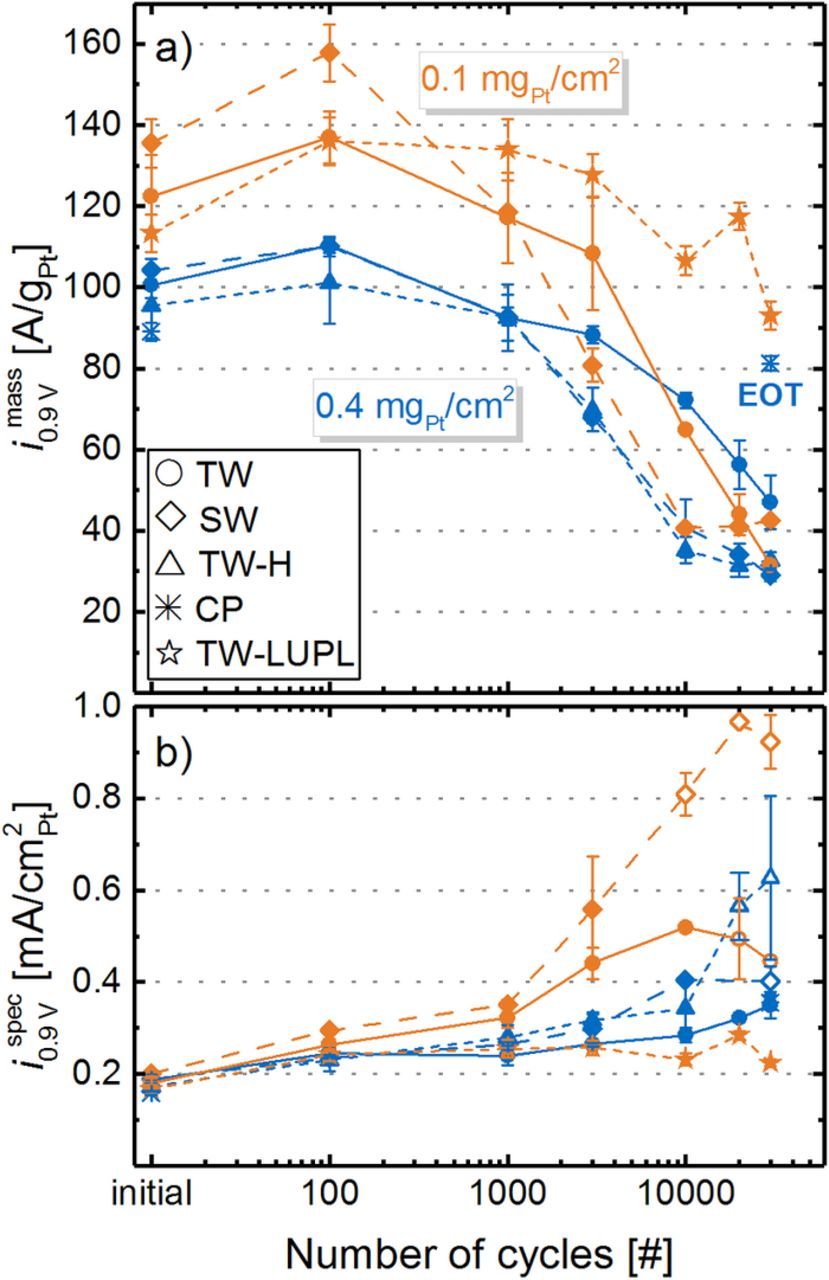
Figure 8. a) ORR mass activity at 0.9 V (i mass0.9 V) and b) ORR specific activity at 0.9 V (i spec0.9 V) extracted from Figure 7 for MEAs with 0.4 mgPt/cm2 (blue lines/symbols) and 0.1 mgPt/cm2 (orange lines/symbols) cathodes over the course of various ASTs. The exchange current density at 0.9 V was obtained by a linear regression of fully corrected polarization curves in O2 between 50 and 500 mA/cm2.
It is interesting to note that in contrast to the overall trend of decreasing ORR mass activity, i mass0.9 V reaches a maximum after 100 cycles, particularly noticeable for low-loaded MEAs. This could be ascribed to an activation of the catalyst particles due to cleaning of the Pt surface, which might overcompensate the ECSA loss of ≈20% in the initial 100 cycles. If true, this would mean that the initial activation procedure (see experimental section) was not sufficient to fully activate the cathode catalyst layer. Alternatively, there is the possibility that the measurement sequence (described in Figure 1) might influence the observed small variation of the measured ORR activity. While the O2 polarization curves at BOT as well as at 10000, and at 30000 cycles were recorded after polarization curves in 10% O2 and in air (each approximately 3.5 h), all other O2 polarization curves were recorded directly after a recovery step. Thus, it is possible that after these two polarization curves without an intermediate recovery step, a certain extent of reversible degradation (i.e., Pt poisoning) might have occurred,62 resulting in a lower ORR mass activity. Evidence for this behavior can be seen for the low-loaded MEAs tested with the TW-LUPL procedure (orange stars in Figure 8a), where ORR mass activities were always higher when measured directly after a recovery step (i.e., at 100, 1000, 3000 and 20000 cycles), while reproducibly lower values were obtained in the absence of a directly preceding recovery step (at BOT as well as at 10000 and 30000 cycles). Since the overall degradation rate induced by the TW-LUPL procedure is rather small (≈40% loss in ECSA and i mass0.9 V after 30000 cycles), this presumably testing procedure related inaccuracy of ≈10% in the quantification of i mass0.9 V might have become apparent. Nevertheless, this minor uncertainty in ORR mass activity values is of no consequence to the conclusions drawn from these data.
Further insights into the aging process can be obtained by examining the specific ORR activity at 0.9 VRHE, i spec0.9 V, as shown in Figure 8b. It is well-known that small Pt nanoparticles have a lower specific ORR activity due to their relatively larger amount of edge and corner sites compared to larger nanoparticles.63 Amongst others, Mayrhofer et al. found an increase of the specific activity of Pt particles by a factor ≈2 when going from 1 nm sized particles to 5 nm.64 In our case, the determined specific ORR activities of low-loaded (182 ± 18 μA/cm2Pt) and high-loaded MEAs (177 ± 16 μAcm2Pt) at BOT are essentially identical, consistent with the very similar average particle size of the two catalysts (2.8 ± 0.8 nm for 20%wt Pt/C and 3.2 ± 1.0 nm for 50%wt Pt/C). In the course of aging, the specific activity increases for all tested MEAs due to the constantly growing fraction of larger particles. The highest observed ORR activity (≈1 mA/cm2Pt) was found for low-loaded catalyst layers with the most significant ECSA loss (Figure 5) due to the harsh SW aging protocol. However, it shall be noted that the determination of the catalyst activity is slightly impaired by an increased Tafel slope for MEAs with a very small rf value, hence the calculation of i spec0.9 V becomes increasingly erroneous for strongly aged catalyst layers due to difficulties in determining kinetic parameters accurately.
AST induced H2/air and H2/10%O2 performance losses
To obtain further information about mass transport related overpotentials induced by the different aging protocols, polarization curves in air and 10% O2 (to simulate conditions at the cathode outlet of a PEMFC stack operated at an air stoichiometry of ≈1.75) were measured at several aging stages (Figure 9). The solid lines are the average BOT performance of MEAs with 0.4 mgPt/cm2 (blue) and 0.1 mgPt/cm2 (orange) cathode loadings at the here investigated operating conditions of 170 kPaabs, 80°C, and 100% RH (error bars represent the standard deviation across all measured MEAs, indicating the excellent reproducibility of the performance at BOT). Similarly to polarization curves in O2 (Figure 7a), a clear offset between high-loaded and low-loaded cathodes, resulting from a different cathode rf, is observed for BOT polarization curves in air (e.g., 689 ± 3 mV vs 634 ± 10 mV at 1.5 A/cm2 for high- and low-loaded electrodes, respectively) and 10% O2 (e.g., 620 ± 10 mV vs 496 ± 9 mV at 1.5 A/cm2 for high- and low-loaded electrodes, respectively). In contrast to pure O2, where the offset perfectly matched the increase of ηORR predicted by Equation 1, the voltage loss for low-loaded MEAs in air (e.g., 55 ± 13 mV at 1.5 A/cm2) and 10% O2 (e.g., 124 ± 19 mV at 1.5 A/cm2) was much higher than the kinetically expected penalty. The additional voltage loss for low-loaded cathodes in air, being even more pronounced in 10% O2, is an initial hint on a mass transport overpotential related to the rf value of the cathode. Several other researchers reported the occurrence of such a Pt surface area specific O2 mass transport resistance (termed  in this manuscript) for pristine cathodes with different loadings and showed its substantial increase with decreasing cathode rf values by limiting current measurements.8–10,41
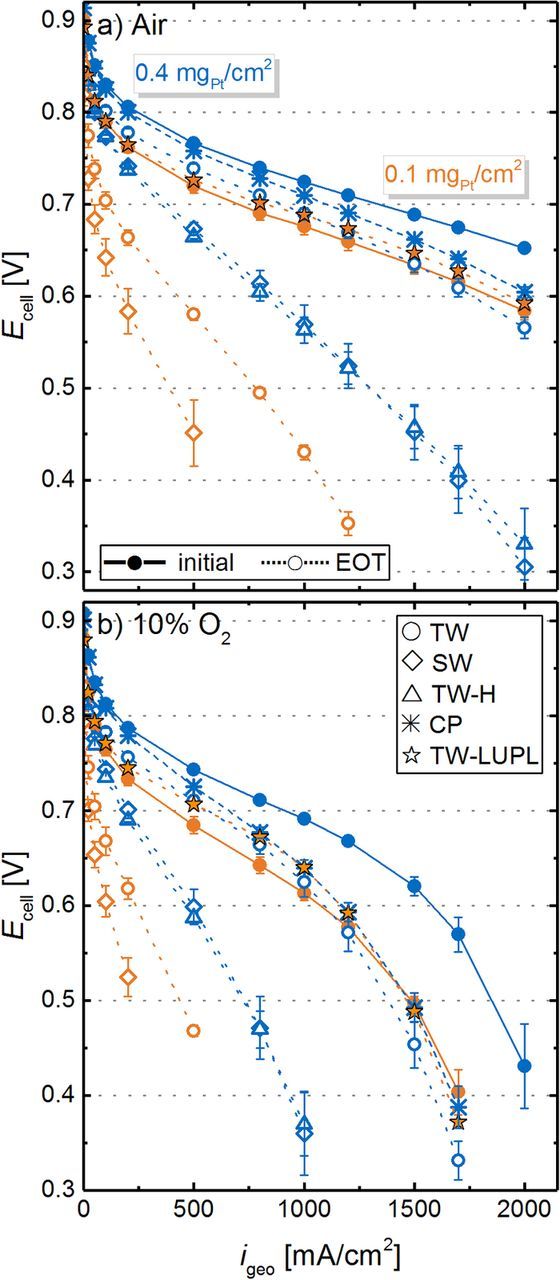
Figure 9. Differential flow a) H2/air and b) H2/10% O2 (2000/5000 nccm) performance (170 kPaabs, 80°C, and 100% RH) for MEAs with 0.4 mgPt/cm2 (blue lines/symbols) and 0.1 mgPt/cm2 (orange lines/symbols) cathodes at BOT (solid lines and filled symbols) and at EOT, i.e., after 30000 voltage cycles or an 8 hour hold at 1.2 Vcell (dotted lines or hollow symbols). BOT polarization curves of all tested MEAs were averaged and error bars represent the standard deviation of all measurement points. At EOT, error bars represent the mean absolute deviation of two measurements.
High-loaded MEAs aged by the SW and TW-H protocol (open blue diamonds and triangles in Figure 9) show a similar performance at EOT, which was significantly lower compared to MEAs aged by the TW protocol (open blue circles). This is in accordance with the above discussed O2 polarization curves (Figure 7a) and ECSA losses (Figure 5a). Even though the overall performance losses are rather dramatic for the low-loaded MEAs, they also show the same increased aging when subjected to SW rather than TW voltage cycling (open orange diamonds and circles). However, as one might have hoped based on the ECSA (Figure 5) and ORR mass activity (Figure 8a) data, even with low-loaded cathodes no voltage cycling induced performance losses occur over 30000 cycles when using the TW-LUPL protocol with a lowered upper voltage limit of 0.85 VRHE, neither in H2/air nor in H2/10% O2 (orange stars in Figure 9).
An interesting insight into the rf dependent  induced losses can be gained by comparing the H2/air EOT performance of the high-loaded cathode subjected to TW cycling (open blue circles) and the low-loaded cathode subjected to TW-LUPL cycling (orange stars). At EOT, the high-loaded cathode has a slightly higher roughness factor (56 ± 12 cm2Pt/cm2) compared to the low-loaded cathode (42 ± 2 cm2Pt/cm2), so that one would expect a similar or an even lower
  value for the former. At the same time, the specific ORR activity at 0.9 VRHE for the high-loaded cathode (350 ± 29 μA/cm2Pt) is substantially larger than that for the low-loaded cathode (224 ± 7 μA/cm2Pt). Since the product of (i spec0.9 V · rf), equating to 19.6 mA/cm2Pt for the high-loaded and 9.2 mA/cm2Pt for the low-loaded cathode, is proportional to (i0 · rf) under the same operating conditions, the ηORR difference predicted by Equation 1 is ≈23 mV, suggesting that the kinetically predicted EOT performance of the high-loaded cathode subjected to TW cycles should be ≈23 mV higher than that of the low-loaded cathode subjected to TW-LUPL cycles. This is consistent with the higher H2/O2 performance of the former (see Figure 7a) and also its superior low current density performance in H2/air or H2/10%O2 (see Figure 9). However, despite its higher EOT roughness factor, the TW-aged high-loaded cathode exhibits a larger (unassigned) mass transport loss, evident by its lower H2/air or H2/10%O2 performance at current densities above ≈1 A/cm2 (see Figure 9). Since no significant differences in the effective proton conduction resistance (measured by EIS) were observed between these two electrodes, an apparently larger oxygen transport resistance, which is not simply related to the cathode rf value and produced by voltage cycling, must exist. Its origin is unclear at the moment, but it may be related to the morphological changes and redistribution of Pt within the cathode electrode caused by voltage cycling.
O2 transport resistance evaluation
In order to disentangle mass transport resistances originating from gas transport in the flow fields and the GDL from those in the catalyst layer, and to identify resistances dependent on the cathode rf value, limiting current measurements were executed according to the method developed by Baker et al.36 In this approach, the concentration of O2 (dry gas fraction in N2) in the feed gas is varied from 4% to 24%, while a low potential between 0.05 and 0.30 V is applied to obtain the limiting current, where the O2 concentration at the Pt surface decreases to zero and the current-voltage profiles at different O2 concentrations resemble a vertical line (see Figure 10a). For each concentration, the O2 mass transport resistance is calculated and plotted versus the respective limiting current density, as illustrated in Figure 10b for the low-loaded cathode MEAs at BOT and after 30000 SW cycles (for details on the analysis see Simon et al.).32
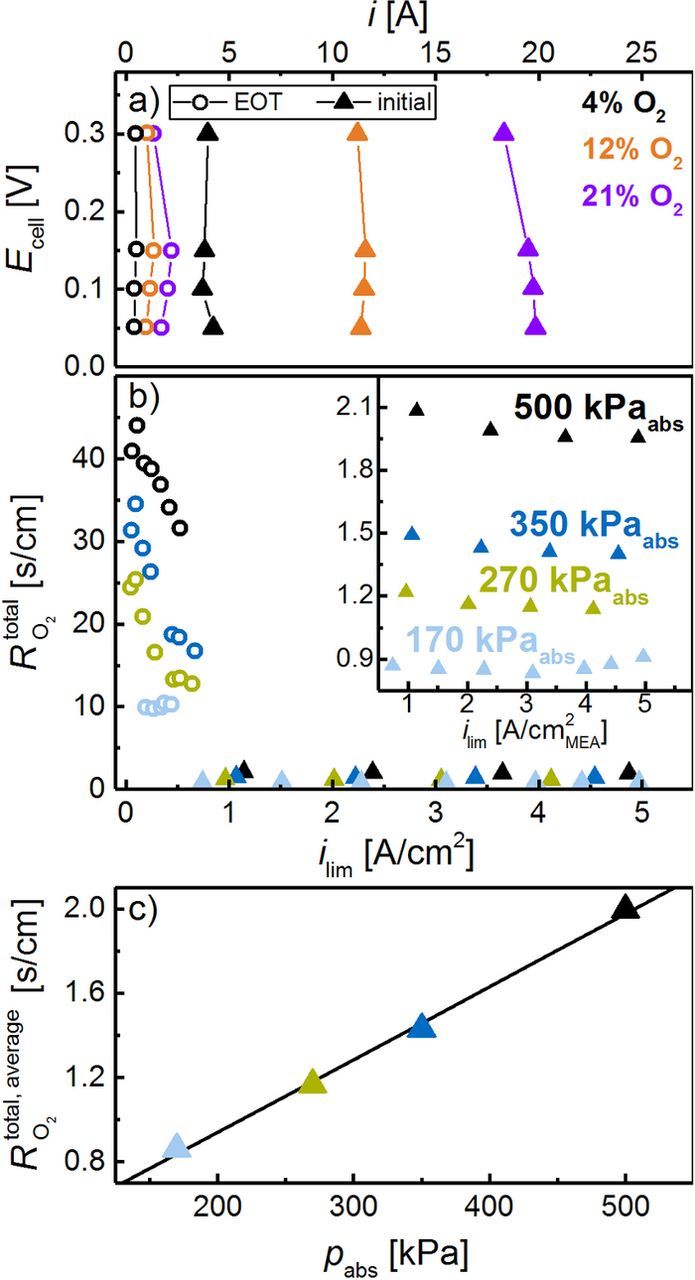
Figure 10. a) Limiting current measurement in the potential range between 0.30 and 0.05 V at O2 concentrations of 4%, 12%, and 21%, comparing a 0.1 mgPt/cm2 cathode at BOT (triangles) and after 30000 SW cycles (circles). Measurements were performed at 80°C, 100% RH, and 170 kPaabs (using 2000 nccm H2 and 5000 nccm O2 in N2). b) Total O2 mass transport resistance vs limiting current density at 170, 270, 350 and 500 kPaabs (O2 concentration between 4% and 24%); the inset is a zoom into the low  region at high limiting current densities. c)
  of the BOT cathode averaged over all O2 concentrations at the respective pressure; the shown linear regression line is used to deconvolute
  into
into  and
and  .
.
For all cathodes at BOT, the total oxygen mass transport resistance,  , is essentially independent of the limiting current density at all pressures (see triangles in Figure 10b and its inset), as is expected under these conditions for the Freudenberg GDL.65 Furthermore, the determination of the limiting current density at various pressures enables the separation of
  into a pressure dependent (
 ) and a pressure independent (
 ) oxygen mass transport resistance via a linear regression of
  versus the absolute pressure (Figure 10c). Nevertheless, a severe decrease of the limiting current is observed for low-loaded cathodes after extended TW or SW cycling, exemplarily shown in Figure 10a for the SW protocol (BOT ≡ triangles; EOT ≡ circles). At EOT, the limiting current density (circles in Figure 10a) is significantly lower, and the resulting
  values are more than an order of magnitude larger than at BOT and change severely with limiting current density, especially at higher pressures (circles in Figure 10b). We attribute this unsteady transport resistance at higher pressures to a local catalyst layer/GDL flooding (at an inlet RH of 100%) due to the low limiting current, at which no significant through-plane temperature gradient between MEA and flow field can be established, thereby hampering product water removal through the gas phase. This hypothesis is underpinned by the fact that the transport resistance is strongly decreasing with increasing current density, i.e., at a higher temperature gradient. The effect of flooding is even more pronounced at higher applied pressures, analogous to what is generally observed.66 As the evaluation of
  at higher pressure is not reliable in cases like the one shown in Figure 10b (circles), a deconvolution of
  into
into  and
and  is not trustworthy, hence only the total transport resistance at 170 kPaabs is considered in these instances. The origin of this effect is yet unclear, but as will be shown in the following, it is not related to carbon support corrosion.
The total oxygen mass transport resistance at different stages of the aging protocol is shown for high-loaded (blue) and low-loaded (orange) cathodes in Figure 11, separated into pressure dependent,  (solid bars), and pressure independent,
  (hollow bars) contributions, according to the above described analysis. All high-loaded (average of 0.73 ± 0.09 s/cm), as well as all low-loaded cathodes (average of 0.82 ± 0.10 s/cm) show a similar
  at BOT, demonstrating a reproducible MEA fabrication. In general, low-loaded cathodes show a slightly higher transport resistance than high-loaded electrodes at BOT, as already indicated by the observed voltage losses in H2/air (Figure 9a) and H2/10% O2 polarization curves (Figure 9b). The pressure dependent transport resistance associated with the GDL is, as expected, essentially identical for high- (
 = 0.44 ± 0.05 s/cm) and low-loaded (
 = 0.45 ± 0.05 s/cm) cathodes at BOT. Therefore, the differences in
  originate from a higher pressure independent transport resistance, due to their lower cathode rf values (
 high-loaded: 0.29 ± 0.04 s/cm;
  low-loaded: 0.37 ± 0.05 s/cm).
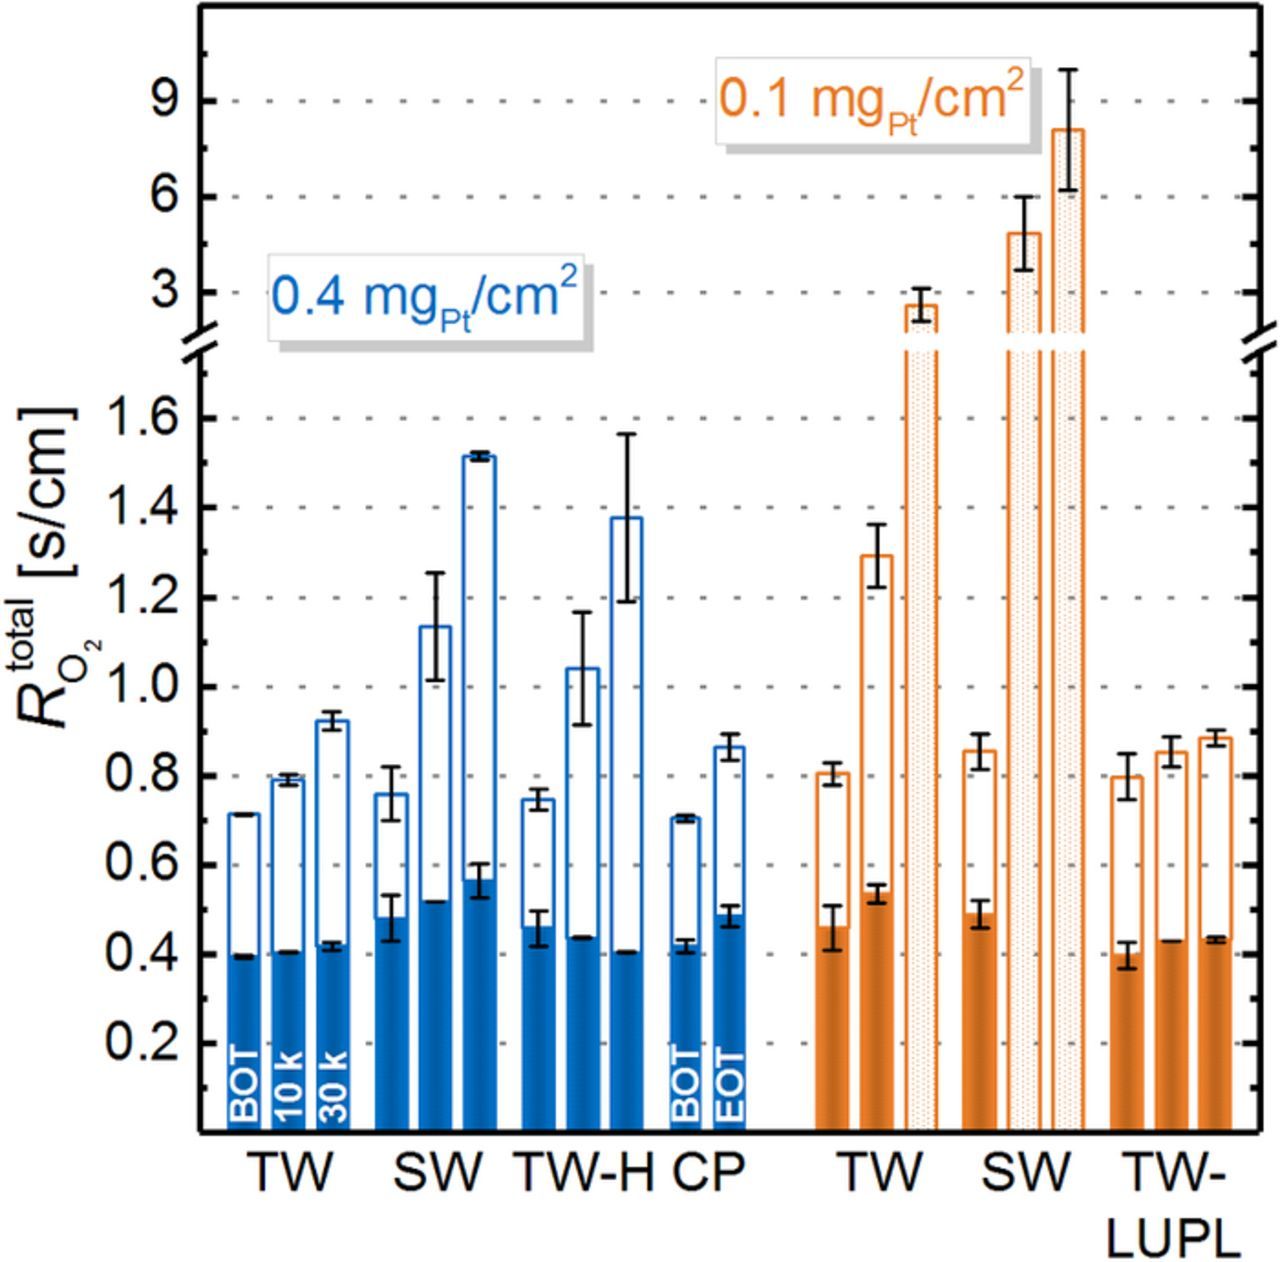
Figure 11. Total oxygen mass transport resistance ( ) determined at 80°C, 100% RH, and 170 kPaabs (differential flow of hydrogen and 4% - 21% O2 (balance N2) for high-loaded (blue) and low-loaded (orange) cathodes tested by different ASTs (for each, left bars are at BOT, middle bars at 10000 cycles, and right bars 30000 cycles).
  was also separated into pressure dependent (
 , solid bar) and pressure independent (
 , open bar) oxygen mass transport resistance contributions. For certain experiments, the deconvolution of
  was not reliable, thus only the total transport resistance at 170 kPaabs is plotted as a dotted bar. Error bars correspond to the mean absolute deviation of two repeat experiments with different MEAs.
Over the course of catalyst layer aging, the pressure dependent transport resistance remains reasonably constant, considering that the observed fluctuations are within the experimental accuracy. At the same time,  increases significantly. In general,
  is composed of various contributions, namely Knudsen diffusion in small pores, diffusion in the ionomer and in water, as well as of the so-called Pt surface specific resistance (
 ). Since the ionomer content and the overall electrode thickness was constant in all experiments, we ascribe the higher
  of low-loaded electrodes to a rf specific mass transport resistance. An increase of
  was also observed by other researchers who conducted limiting current measurements for MEAs with different loading.9,10,37,55 In accordance with the ECSA trends presented in Figure 5,
  increases with decreasing ECSA values in all aging protocols. Consistently, the highest transport resistances were obtained for procedures which showed the most severe ECSA losses, namely SW and TW-H for high-loaded cathodes as well as TW and SW for low-loaded cathodes. Comparing the transport resistance evolution for high-loaded catalyst layers, TW aging leads to less significant increases of
  compared to SW and TW-H aging, which in turn show a similar transport resistance at each aging interval. Taking the similar ECSA decrease and the same performance in polarization curves of TW-H and SW into account, it is evident that the potential transient during aging is of minor importance, while the hold time at high potentials is the main contributor to electrode degradation. As described earlier, for degraded cathodes with ultra-low rf values (low-loaded cathodes subjected to 30000 TW cycles or to ≥10000 SW cycles), the deconvolution of pressure dependent and pressure independent resistance is not reliable, hence only the total transport resistance at 170 kPaabs is shown in Figure 11.
To disentangle the effect of low rf values on the observed increase of the total transport resistance from possible transport limitations originating from carbon corrosion, cathodes were exposed to a constant potential hold (CP) of 1.2 Vcell for 8 h at 95°C and 100% RH. This procedure results in a thinning of the catalyst layer by approximately 40%, while maintaining a reasonably high rf value (from 222 ± 10 at BOT to 90 ± 2 cm2Pt/cm2 at EOT). Despite the fact that the catalyst layer structure collapses in this experiment, the total transport resistance increases only moderately from 0.70 ± 0.01 to 0.86 ± 0.01 s/cm (see Figure 11). On the one hand, the slight increase of the pressure independent resistance can be attributed to the loss of ECSA, comparable to the other testing procedures which lead to lower rf values. On the other hand, since  is mostly associated with the transport resistances in the flow-field, the GDL, and the in the void volume within the catalyst layer, it would be reasonable to expect that it increases upon cathode thinning. Nevertheless, since the pressure dependent part of the transport resistance increases solely by 0.07 ± 0.04 s/cm (Figure 11), this hypothesis cannot be proven within the limited accuracy of this method. Considering that no thinning was observed for electrodes exposed to voltage cycling, the changes of
  , and especially
  in the course of aging are clearly not attributed to carbon corrosion. In other words, the much larger increase of
  and
and  over the course of all voltage cycling protocols (with the exception of the TW–LUPL protocol) where no cathode thinning was observed, must be related to phenomena other than carbon corrosion. Consistent with the essentially identical BOT and EOT performance of low-loaded cathodes subjected to TW-LUPL cycling, there is also essentially no increase of the total oxygen mass transport resistance.
As a comparison to the data in literature,9 the pressure independent part of the O2 mass transport resistance was plotted as a function of the rf in Figure 12. The clear trend of strongly increasing  with decreasing platinum surface area (i.e., rf < 50 cm2Pt/cm2) presented here, was also observed by Greszler et al. and underlines the previously stated hypothesis that the high O2 mass transport resistance is a strong function of the cathode rf. The fact that aged, high-loaded electrodes show a similar
  (e.g., after 30000 TW cycles) compared to low-loaded cathodes at BOT further clarifies that the rf is indeed a major influencing factor on the O2 mass transport. However, a disentanglement of
  into a fraction caused by the AST and another contribution, originating solely from the rf of the cathode, cannot be drawn unambiguously with respect to the accuracy of the measurement.
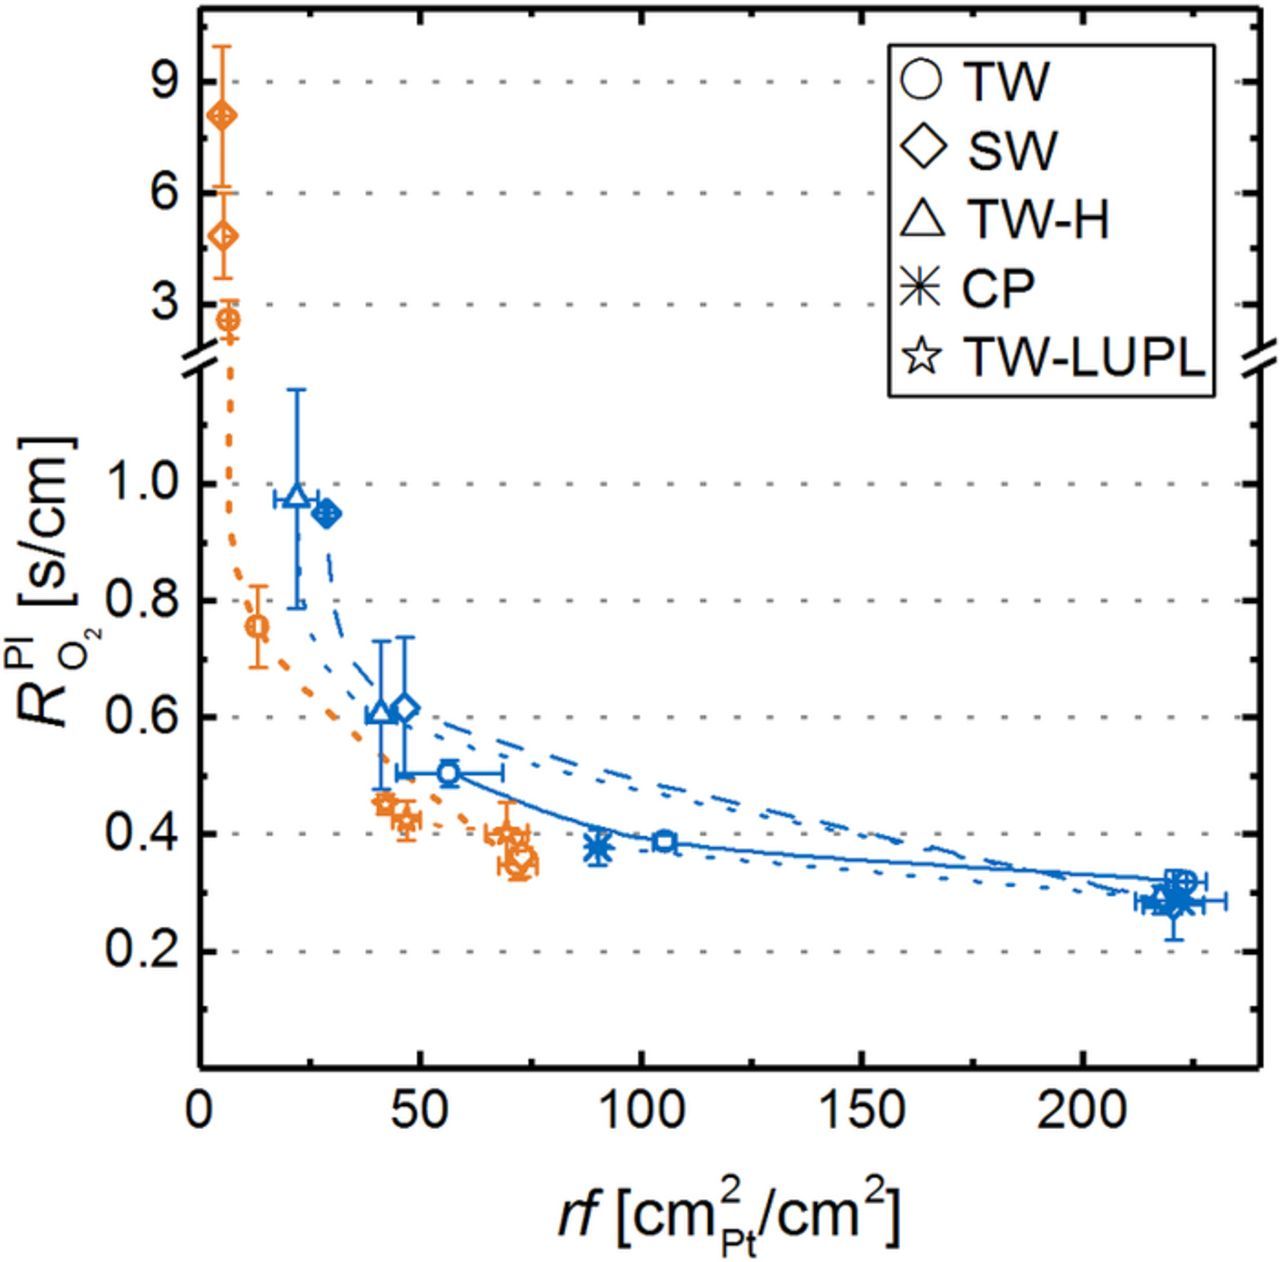
Figure 12. Pressure independent oxygen mass transport resistance,  , as a function of the electrode's roughness factor, rf, for high-loaded (blue) and low-loaded (orange) MEAs at BOT and the respective aging intervals. If the EOT transport resistance could not be separated into pressure dependent and independent contributions (see open bars in Figure 11), the total transport resistance at 170 kPaabs is given in this figure.
Voltage loss analysis of aged cathodes
Using the total oxygen mass transport resistance at BOT and EOT (Figure 11), the corresponding air polarization curves were corrected for all voltage loss contributions that are currently accessible by in situ measurement techniques, according to a preceding publication11 and are shown in Figure 13. In short, corrections of the potential include the HFR, the effective cathode proton conduction resistance, and the total oxygen mass transport resistance, while the current density was corrected for H2 crossover, electrical short current and was normalized to the cathode's ECSA.
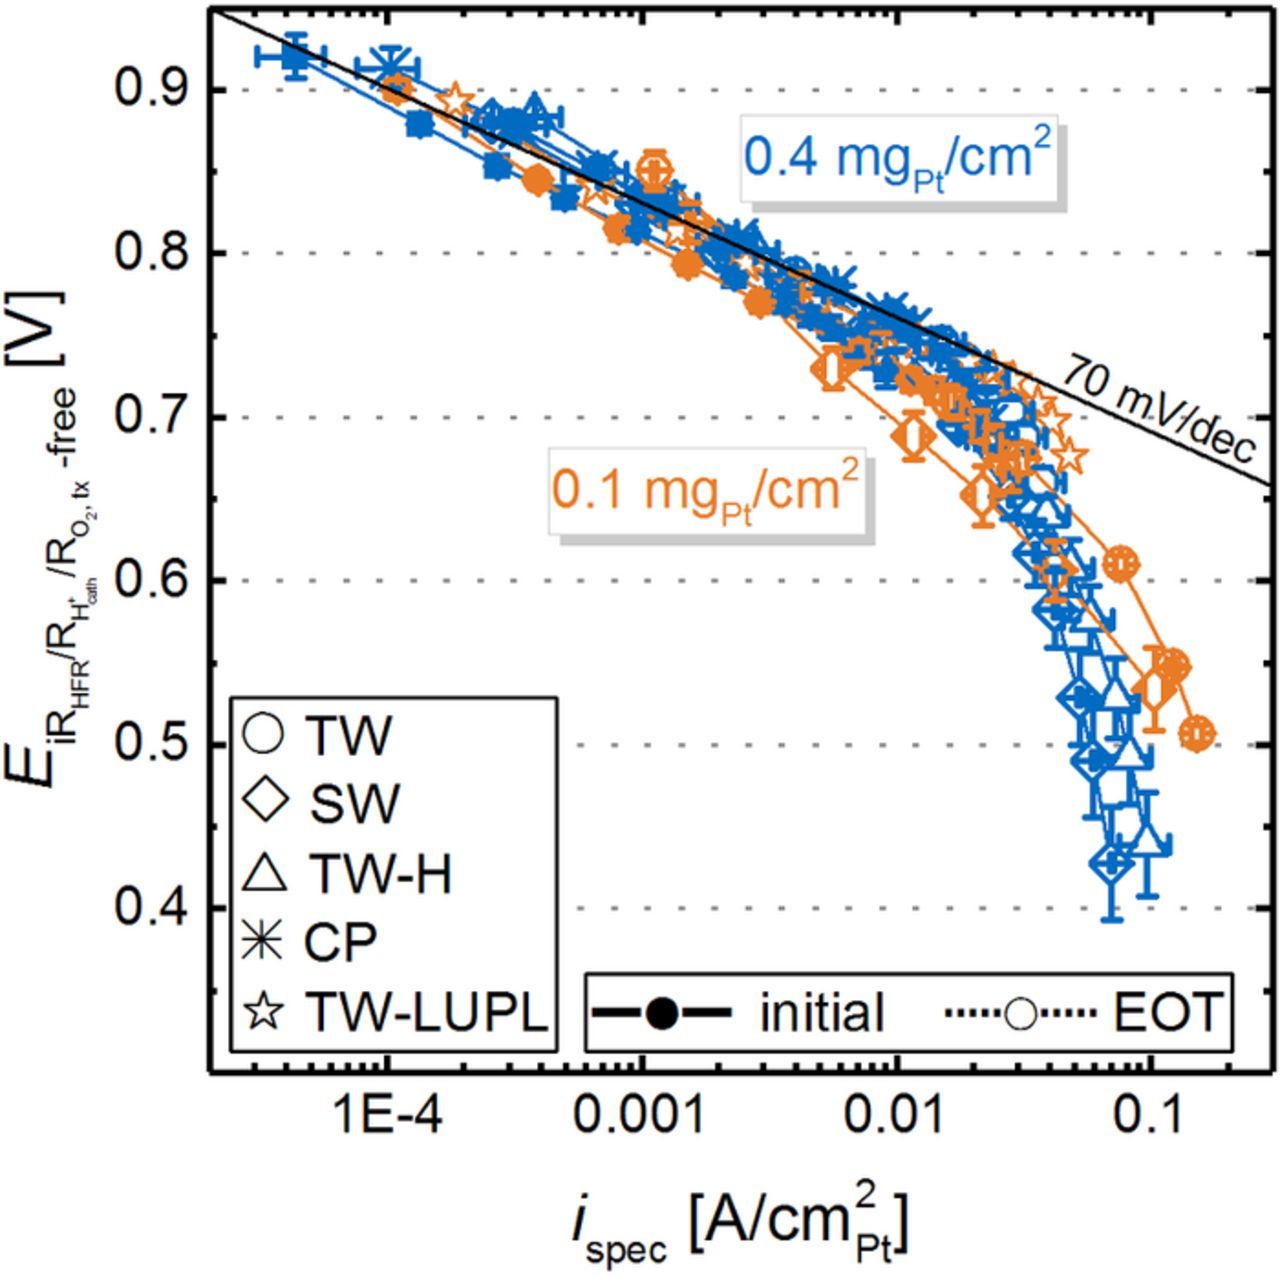
Figure 13. Transport-corrected differential flow H2/air polarization curves at 80°C, 100% RH, and 170 kPaabs at BOT (full symbols) and EOT (open symbols) for high-loaded (blue) and low-loaded (orange) MEAs. The potential is corrected for the HFR, effective cathode proton conduction resistance, and the total oxygen mass transport resistance, while the current is corrected for the H2 crossover and ohmic shorting currents, and is normalized to the cathode ECSA. The two slanted lines indicate the specific current density region for high-loaded (blue) and low-loaded (orange) MEAs at BOT. BOT polarization curves of all tested MEAs were averaged and error bars symbolize the standard deviation over all MEAs. Error bars for EOT curves represent the mean absolute deviation between two measurements.
For BOT, all H2/air polarization curves coincide with a Tafel slope of ≈73 mV/dec for high-loaded and ≈80 mV/dec for low-loaded catalyst layers. We attribute the higher Tafel slope in air compared to pure O2 to unaccounted mass transport limitations, which increase as the O2 concentration decreases. Upon aging, a strong deviation from the theoretical 70 mV/dec slope is observed at high current density, similar to the limitations observed in pure O2 (deviations from a straight Ecorrected vs log(i) line at EOT occur at ≈30 mA/cm2Pt for all aged cathodes, except for the low-loaded cathode subjected to SW cycling). However, the deviation from a straight Ecorrected vs log(i) line at EOT occurs earlier in air, viz., at ≈10 mA/cm2Pt (again, with the exception of the low-loaded cathode subjected to SW cycling, which deviates much earlier), which one would expect in case of significant oxygen transport resistances. The here observed deviation was also seen by other research groups at specific current densities ranging from 5–50 mA/cm2Pt in fully corrected air polarization curves with aged MEAs or at very low cathode rf values, commonly attributed to a local oxygen diffusion resistance.9,10,12 Although a correction for the mass transport was applied to these measurements, it seems that the deviation at high Pt specific current density is not accounted for by the transport resistance determined by the limiting current method. Indeed, the conditions of the MEA during the limiting current measurement (local MEA temperature and RH due to a high heat production rate at <0.3 V) are not identical to the operating conditions during the polarization curve (lower heat production rate at voltages of ≈0.6–0.5 V) where the corrections are applied, which certainly introduces an error. Furthermore, due to changes in temperature or local RH, the utilization of the Pt surface area may change, increasing the oxygen flux to the remaining Pt surface or altering the ORR kinetics.59,67 While we cannot prove one or the other hypothesis, we consider the limitations of the oxygen mass transport determination method to be a probable cause of at least part of the observed deviations at high current density. However, whatever the origin of these unaccounted transport resistances may be, they clearly scale with the specific current density.
After full correction of the recorded H2/air polarization curves for all known voltage loss contributions (namely the HFR, the effective cathode proton conduction resistance, and the total oxygen mass transport resistance), the H2/air polarization curves can be compared to the theoretical, kinetically limited polarization curve, constructed from the experimentally determined ORR mass activities (see Figure 8a) and assuming simple Tafel kinetics with an intrinsic Tafel slope of 70 mV/decade. The remaining unaccounted voltage losses are shown in Figure 14a for high-loaded and in Figure 14b for low-loaded catalyst layers at BOT (solid lines) and EOT for all aging protocols.
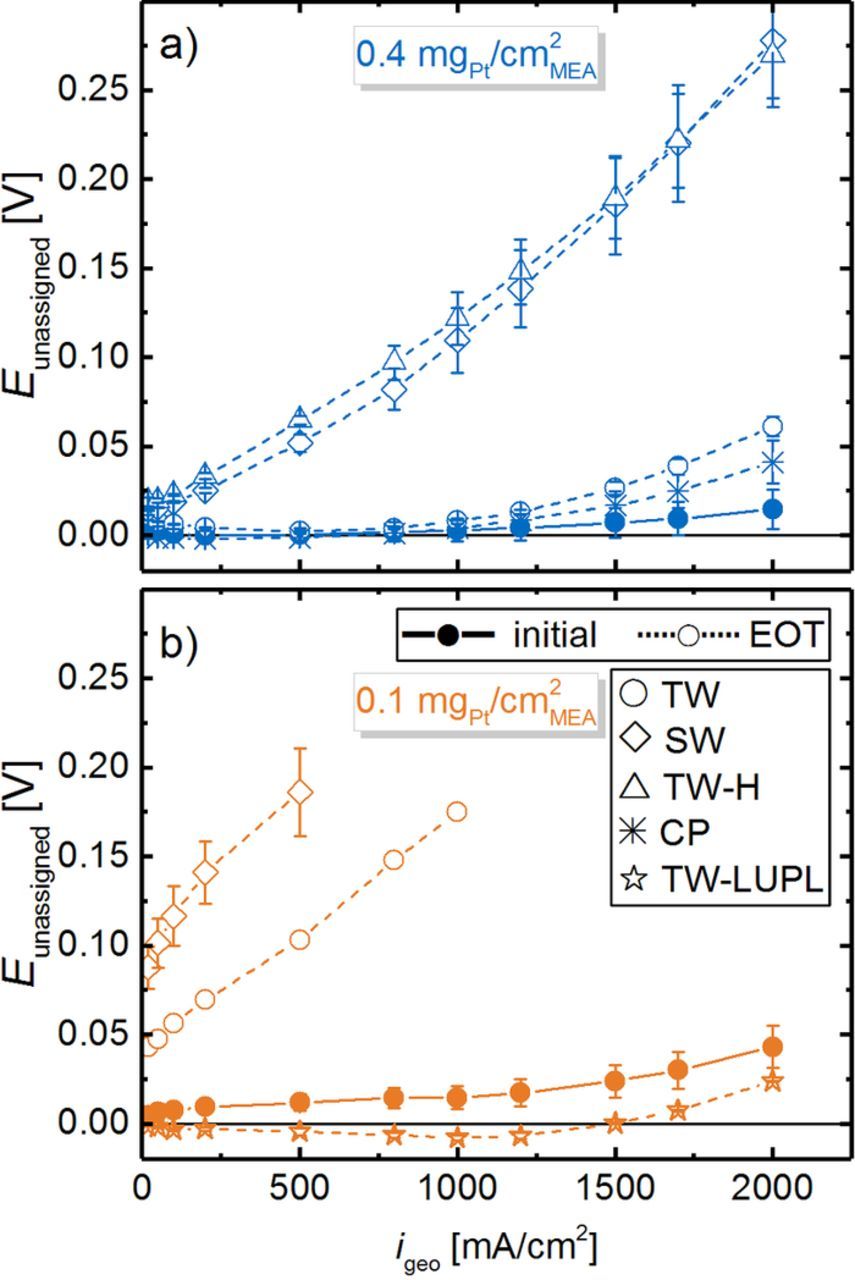
Figure 14. Unaccounted voltage losses between a theoretical, kinetically limited H2/air polarization curve calculated from the measured ORR mass activity (assuming simple Tafel kinetics with an intrinsic Tafel slope of 70 mV/dec) and polarization curves recorded in H2/air (differential flow, 170 kPaabs, 80°C, and 100% RH), where the potential is corrected for the HFR, effective cathode proton conduction resistance, and the total oxygen mass transport resistance for a) high-loaded and b) low-loaded cathode catalyst layers at BOT (full symbols) and EOT (open symbols).
An analysis of Figure 14a reveals an almost quantitative account of all voltage losses for high-loaded MEAs at BOT (blue solid line), with only minor unaccounted losses at 2 A/cm2 (15 ± 11 mV). Upon catalyst layer aging over 30000 TW cycles (open blue circles), the unaccounted voltage losses at higher current density (>1 A/cm2) increase, pointing to the fact that not all voltage losses can be assessed by the current in situ diagnostic measurements. This discrepancy is even more pronounced for the MEAs exposed to SW and TW-H aging, where unaccounted voltage losses on the order of 250 mV were observed at 2 A/cm2. In accordance with the previously described evolution of the ECSA, the ORR mass activity, and the total oxygen mass transport resistance, both aging protocols (SW and TW-H) lead to identical unaccounted losses. In contrast, the corrosion of the carbon support (CP aging) does not lead to a significant increase of the unaccounted losses (e.g., 41 ± 12 mV at 2 A/cm2) and therefore cannot explain the high, unaccounted voltage losses for SW and TW-H cycling.
The unaccounted voltage losses for low-loaded MEAs (Figure 14b) at BOT are slightly higher compared to high-loaded MEAs, and are in reasonably good agreement with our previous voltage-loss analysis with the same catalyst.11 After aging by the TW or SW procedure, rather dramatic unaccounted voltage losses are already observed at low geometric current densities and become increasingly larger with current density. Considering the SW and TW-H aged, high-loaded catalyst layers, the significant unaccounted voltage losses of all these measurements suggest that the quantitative evaluation of voltage loss contributions is impaired when using cathodes with low rf values, i.e. at a high Pt specific current density. This hypothesis is further validated by the TW-LUPL voltage cycling test applied to the 0.1 mgPt/cm2 cathodes: even after 30000 potential cycles, the unaccounted voltage losses were substantially less compared to all other aging protocols, being as little as 24 ± 1 mV at 2 A/cm2 at EOT, where the roughness factor is 42 ± 2 cm2Pt/cm2. A very intriguing observation is that this roughness factor is only ≈2–fold larger than the EOT roughness factor of the high-loaded cathodes subjected to SW cycling (29 ± 1 cm2Pt/cm2), while the unaccounted voltage losses of the latter are >250 mV at 2 A/cm2. Quite clearly, the currently available in situ diagnostics do not capture the critical voltage loss phenomena which must be related to the morphological changes with regards to Pt particle size and location within the electrode.
Conclusions
To better understand the influence of voltage cycling based ASTs on the development of mass transport resistances and on the extent to which they can be captured by currently available in situ diagnostics (ORR kinetics in H2/O2, cathode proton conduction resistance by impedance, oxygen transport resistance via limiting current measurements), we conducted a comprehensive voltage loss analysis on MEAs with high- and low-loaded cathodes (0.4 and 0.1 mgPt/cm2) over the course of ASTs based on different voltage cycling protocols. These include triangular wave (TW) and square wave (SW) cycles between 0.6 and 1.0 VRHE, TW cycles between 0.6 and a lowered upper potential limit of 0.85 VRHE (TW–LUPL), as well as a combination of a triangular sweeps between 0.6 and 1.0 VRHE, with potential hold periods at the upper and lower potential (TW–H), all conducted in H2/N2 (anode/cathode) at ambient pressure, 80°C, and 100% RH.
A comparison of the ECSA and the O2 mass transport resistance evolution of MEAs aged by SW cycles leads to considerably faster degradation compared to TW cycles. To identify whether the fast potential transients or the potential hold phase is responsible for the faster degradation rates during SW aging, an additional procedure, consisting of a triangular potential scan followed by potential hold phase (TW-H) was tested. A comparison of the evolution of the cathode's ECSA, mass activity, and mass transport resistance revealed that the potential hold rather than the rate of the potential transient is the main contributor to cathode aging in voltage cycling ASTs, so that SW and TW–H cycling profiles lead to identical aging rates with respect to the number of cycles.
For all ASTs, the magnitude of assignable and unassigned O2 mass transport resistances scaled predominantly with the cathode roughness factor, increasing with decreasing roughness factor, whereby the pressure dependent O2 transport resistance remained essentially constant. At the same time, ex situ cathode thickness measurements indicated the absence of cathode thinning and thus of significant carbon support corrosion. These results were further compared to an aging procedure which consisted of a constant potential hold at 1.2 Vcell for 8 h (at 95°C and 100% RH), leading to significant carbon corrosion and concomitant cathode thinning, while maintaining a reasonably high cathode roughness factor. This analysis showed that the impact of carbon corrosion on the O2 mass transport resistance is minor compared to its increase with decreasing roughness factor.
While 30000 TW or SW cycles between 0.6 and 1.0 VRHE dramatically decrease the H2/air performance of low-loaded MEAs, it shows negligible degradation over 30000 cycles when a lowered upper potential limit of 0.85 VRHE is applied (TW–LUPL). This provides a guideline to limit cathode degradation under automotive conditions, namely by eliminating high potential periods (e.g., OCV).
Acknowledgment
The authors of this work would like to guide special thanks to Christoph Simon for insightful discussions about limiting current measurements and mass transport resistances. We would also like to thank Daniel Herein and Annett Reichl for fruitful discussions and valuable suggestions. Furthermore, the effort of Hany A. El-Sayed to acquire high quality TEM images is greatly appreciated.
ORCID
Gregor S. Harzer 0000-0002-1830-1931
Jan N. Schwämmlein 0000-0001-8902-4508