Abstract
High power density microbatteries could enable new capabilities for miniature sensors, radios, and industrial electronics. There is, however, a lack of understanding on how battery architecture and materials limit power performance when battery discharge rates exceed 100 C. This paper describes the development and application of an electrochemical model to predict the performance of microbatteries having interdigitated bicontinuous microporous electrodes, discharged at up to 600 C rates. We compare predicted battery behavior with measurements, and use the model to explore the underlying physics. The model shows that diffusion through the solid electrodes governs microbattery power performance. We develop design rules that could guide the development of improved batteries.
Export citation and abstract BibTeX RIS

This is an open access article distributed under the terms of the Creative Commons Attribution 4.0 License (CC BY, http://creativecommons.org/licenses/by/4.0/), which permits unrestricted reuse of the work in any medium, provided the original work is properly cited.
High power density microbatteries would enable new capabilities for miniature sensors, radios, and industrial electronics.1–4 Recent improvements in electrode architectures, materials, and fabrication technologies have enabled microbatteries with power densities as high as 7.4 mW cm−2 μm−1, which is about 100 times greater than power densities provided by larger conventional format batteries.5–9 The ultra-high power densities were achieved by the simultaneous reduction of ion and electron transport resistances across the anode, cathode, and electrolyte. Fabricating electrodes with increasingly fine nanostructures that provide shorter ion and electron transport paths has been the main strategy for reducing transport resistances.2,5–7,10–18 However, as the electrode dimensions decrease, electrode fabrication and incorporating large volume fractions of high capacity materials into the nano architectures (important for obtaining high energy densities) become more difficult. Additionally, the larger surface area leads to increased SEI formation during battery fabrication. To realize both high power and high energy density, it is important to understand how battery architecture and materials affect the physical processes that limit power density and improve energy density, and to develop experimentally validated design rules that address the many engineering constraints in full battery assemblies.
Simulations of battery operation, considering ion transport across both the anode and cathode regions, can be used to assist in battery design and optimization. A key parameter in understanding battery discharge is the C rate, where the time it takes to discharge a battery in one hour is 1 C rate. An X C rate discharge corresponds to a current density X times the 1 C rate current density. The validity of battery discharge models has rarely been explored above discharge rates of 25 C,19–32 with only a few exceptions.33–37 To our knowledge, there is no published work that validates models for batteries discharged at the 100–1000 C rates relevant to high power microbatteries. There is thus a need for an experimentally validated battery model that describes the physical processes that limit battery performance at high C rates. Such a model would provide valuable insights for future high power microbattery designs and fabrication, as well as guide the design of macroscopic battery architectures.
In this paper we present a 1-D electrochemical model that accurately predicts the power performance of batteries discharged at up to 600 C rates. The predictions were compared to discharge data from high power microbatteries we previously reported.5 The model enables the study of local lithium concentration and overpotentials, which indicate that diffusion through the solid electrodes most limits the microbattery performance. Using the validated model, we propose design rules for high power batteries that optimize battery performance.
System Description and Modeling Approach
Figures 1a and 1b show a schematic and SEMs of the high power battery modeled in this work.5 The battery has interdigitated electrodes composed of a highly porous bicontinuous nickel current collector (blue) conformally coated with electrochemically active materials (active materials). The active material is nickel-tin (red) in the anode and lithiated manganese oxide (yellow) in the cathode. The electrolyte fills the volume between the electrodes and inside the electrode pores. Figure 1c shows the lithium and electron transport paths during discharge. Lithium is stored at a high energy state in the anode. An oxidation reaction at the anode-electrolyte surface releases lithium ions and electrons that flow to the lower energy state cathode where they undergo reduction. Electrons do not travel through the electrolyte and instead travel from the anode active material surface through the anode active material, anode current collector, external circuit where they power a load, cathode current collector and cathode active material until they react at the cathode surface (black). Lithium ions flow from the anode to the cathode through the electrolyte (light blue). As lithium ions are released or inserted into the active material, lithium stored in the active material bulk diffuses toward or away from the active material surface according to the concentration gradient (dark blue). The microbattery architecture achieves high power density by simultaneously reducing the ion and electron transport lengths.
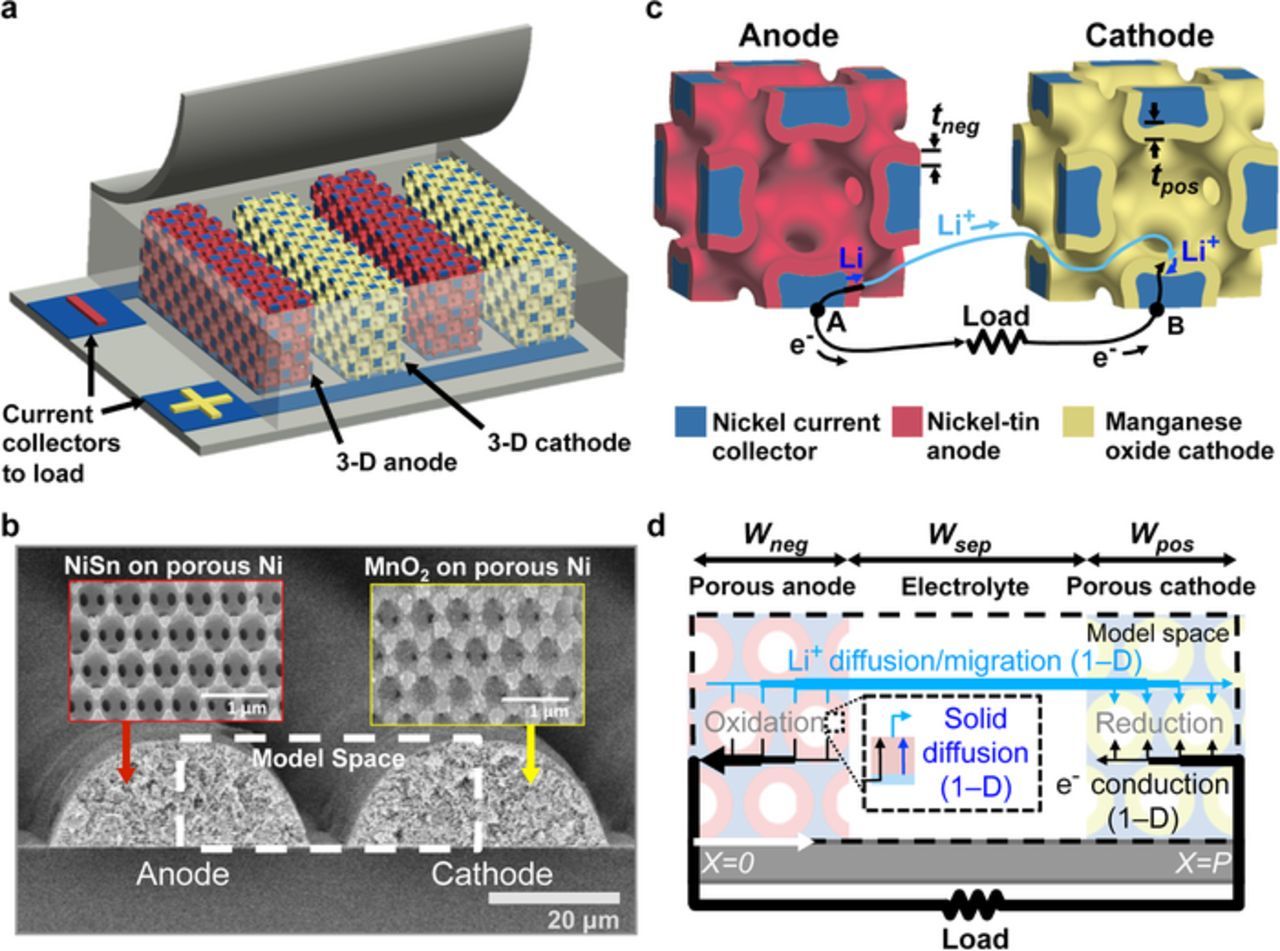
Figure 1. a) A diagram of a microbattery with interdigitated electrodes that consist of an electrochemically active layer (red and yellow) coated on an electrically conductive porous bicontinuous nickel scaffold (blue). b) Electron microscope image of the interdigitated battery electrodes. c) Diagram of a unit cell of the lithium ion microbattery electrodes showing the key transport paths. d) The simulation domain of this microbattery.
The battery power performance depends upon the battery voltage, which is the difference in anode and cathode electrochemical potentials minus any internal voltage drops. The electrochemical potential difference depends on the lithium concentrations at the active material surfaces. Internal voltage drops are due to the ohmic conduction of electrons through the electrodes, the ohmic conduction of ions across the electrolyte, and the electrochemical kinetics at the anode and cathode surface. Energy density is the product of the battery voltage and amount of charge transferred between electrodes per battery volume. Power density is the product of the battery voltage and charge transfer rate between electrodes per battery volume. As the charge transfer rate increases, the electrochemical potential difference decreases and the internal voltage drops increase, so that the battery voltage falls below its equilibrium value and reaches a cutoff voltage before all of the energy can be fully extracted. The reduced battery voltage at high charge transfer rates decreases power performance, or amount of energy extracted at a given power density.
Here, we model the power performance of high power interdigitated bicontinuous microbatteries using a 1-D model of ion and electron transport.19,20 Figure 1d shows the model space, which includes the porous anode, porous cathode, and separator. The model space simplifies the interdigitated electrode design to two electrodes bounded by the electrode centerlines with a symmetric boundary condition. The electrodes are approximated as rectangular, with widths (Wneg and Wpos), height (H), and cross sectional areas equal to the measured cross sectional areas of the experimental electrodes. Fig. 1d shows the 1-D transport of ions and electrons. Ion transport through the electrolyte is governed by migration and diffusion using concentrated solution theory,19,20 and electron transport is ohmic. The total current through each differential length, dx, along the battery is the sum of the current due to local conduction of electrons and ions and is constant across the entire pitch. At each differential length in the electrodes, 1-D diffusion models predict lithium concentration through the active materials. The active material coating is approximated as a thin film with zero lithium flux to the nickel scaffold and flux at the electrode-electrolyte interface determined by Fick's law. The amount of lithium inserted or removed from the active material is determined by Butler-Volmer kinetics which link the electrolyte simulation to the electrochemical potential determined by the active material surface concentration. The model space and boundary conditions are chosen to match conventional battery formats so that the results can be generalized to other electrode architectures.
The nickel current collector volume fraction, εNi, active material volume fraction, εact, and electrolyte volume fraction, εe, are important model inputs that determine the energy density of the batteries and impact the transport of ions and electrons. εNi, εact and εe depend on the bicontinuous electrode structure and are calculated from a geometric model of self-assembled polystyrene (PS) spheres organized in a FCC unit cell. The current collector volume is the cubic unit cell volume minus the void volume left by the sintered PS spheres after PS etching, Vvoid. The active material volume, Vact, is the volume of a thin layer coated on the current collector, calculated from thickness t. Figures 2a and 2b show an inverse opal unit cell and the simplified geometry of two neighboring spheres used to calculate the volume fractions. PS spheres in contact after opal self-assembly are represented by circles with radius R and have 0.74 volume fractions. Sintering the PS increases the radius from R to Rn such that neighboring radii overlap by a length b. Vvoid is the volume of 4 sintered PS spheres of radii Rn in a FCC unit cell minus the volume of 48 overlapping spherical caps of height h or
![Equation ([1])](https://content.cld.iop.org/journals/1945-7111/164/11/E3122/revision1/d0001.gif)
where  and h is Rn – R. Vact is the volume of 4 spheres with radius Rv subtracted from Vvoid, where Rv is Rn – t. Additionally, the volume where the active material does not deposit, marked with hatching, is integrated and subtracted out of Vact, but not including the volume of the spherical cap marked by h2.
![Equation ([2])](https://content.cld.iop.org/journals/1945-7111/164/11/E3122/revision1/d0002.gif)
where h2 is Rv (1 – R / Rn). εNi, εact and εe are calculated from the Vact and Vvoid normalized by the unit cell volume,  .
.
![Equation ([3])](https://content.cld.iop.org/journals/1945-7111/164/11/E3122/revision1/d0003.gif)
![Equation ([4])](https://content.cld.iop.org/journals/1945-7111/164/11/E3122/revision1/d0004.gif)
and
![Equation ([5])](https://content.cld.iop.org/journals/1945-7111/164/11/E3122/revision1/d0005.gif)
Equations 3–5 calculate εNi, εact and εe from fitting parameter t and experimental measurements of R and b. εNi = 0.12 for the experimental batteries where b is 200 nm and R is 500 nm.
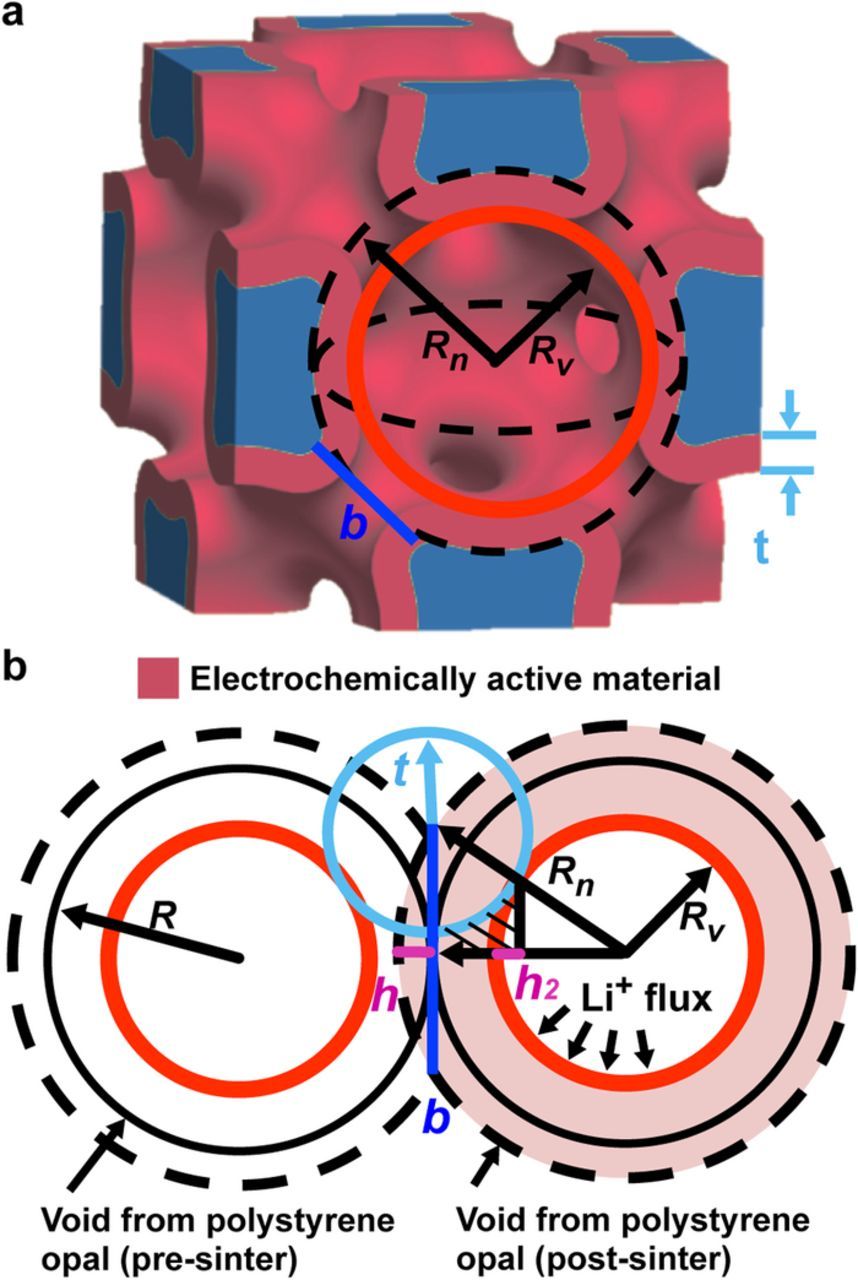
Figure 2. Model of the electrode showing key parameters. a) Unit cell of the microbattery electrode with some geometric parameters. b) Model used to calculate the polystyrene radius (R), active material thickness (t), and volume fractions of the current collector and electrochemically active materials.
An effective electrode conductivity across the electrode width, keff, is approximated by equating the conductance across the width to the conductance down the length, using
![Equation ([6])](https://content.cld.iop.org/journals/1945-7111/164/11/E3122/revision1/d0006.gif)
as electrical conduction occurs primarily down the length (normal to the model space in Fig. 1d), L, in the interdigitated architecture. The bicontinuous electrode conductivity, σeff, is approximated by conduction through the two media in parallel with their volume fractions normalized to 1, such that
![Equation ([7])](https://content.cld.iop.org/journals/1945-7111/164/11/E3122/revision1/d0007.gif)
σeffpos is 3.3 × 10⁶ S m−1 and σeffneg is 1.1 × 10⁷ S m−1. keff is then corrected for the porosity of the electrode with a Bruggeman exponent of 1.5.
The model uses electrolyte material properties from available electrolyte data. The experimental electrolyte is 1:1 ethylene carbonate: dimethyl carbonate (EC:DMC) with initial 1000 mol m−3 LiClO4 concentration, c0e. The electrolyte interdiffusion coefficient is approximated as 2.6 × 10⁻¹⁰ m2 s−1 based on 1 M LiClO4 in propylene carbonate (PC).38 The electrolyte conductivity depends on concentration and is taken from data on LiClO4 in EC:PC,39 where the 8.5 × 10⁻³ S cm−1 maximum conductivity, σe, is close to that of 1 M LiClO4 in EC:DMC.40,41 The lithium transference number, t+, is 0.363 based on LiPF6 in EC:DMC because the transference number depends on the solvation radius of the anion, which is similar for PF6− and ClO4−.19,40,42 The electrolyte conductivity and diffusivity through the porous electrodes are corrected for the increased path length using a Bruggeman exponent of 1.5.19,20 Changes to the pore shape or volume fraction in the microbattery electrodes would change the tortuosity and affect the Bruggeman exponent.8
The following are material properties for the electrochemically active materials. Figure 3 shows the open circuit voltage (OCV), versus lithium, as a function of the state of charge for the anode and cathode active materials. The OCV is measured from batteries discharged at low rates. The maximum capacity of the cathode, cmaxpos, is 23,000 mol m−3 based on a 145 mAh g−1 manganese oxide cathode.43 The initial cathode concentration, c0pos, is approximated as 50 mol m−3 for all batteries. The nickel-tin anode is composed of 80% tin. At a full state of charge, the anode OCV corresponds to Li3Sn with a 55,000 mol m−3 volumetric capacity.44 c0neg is set so that the low rate voltage plateau matches between predicted and measured batteries.
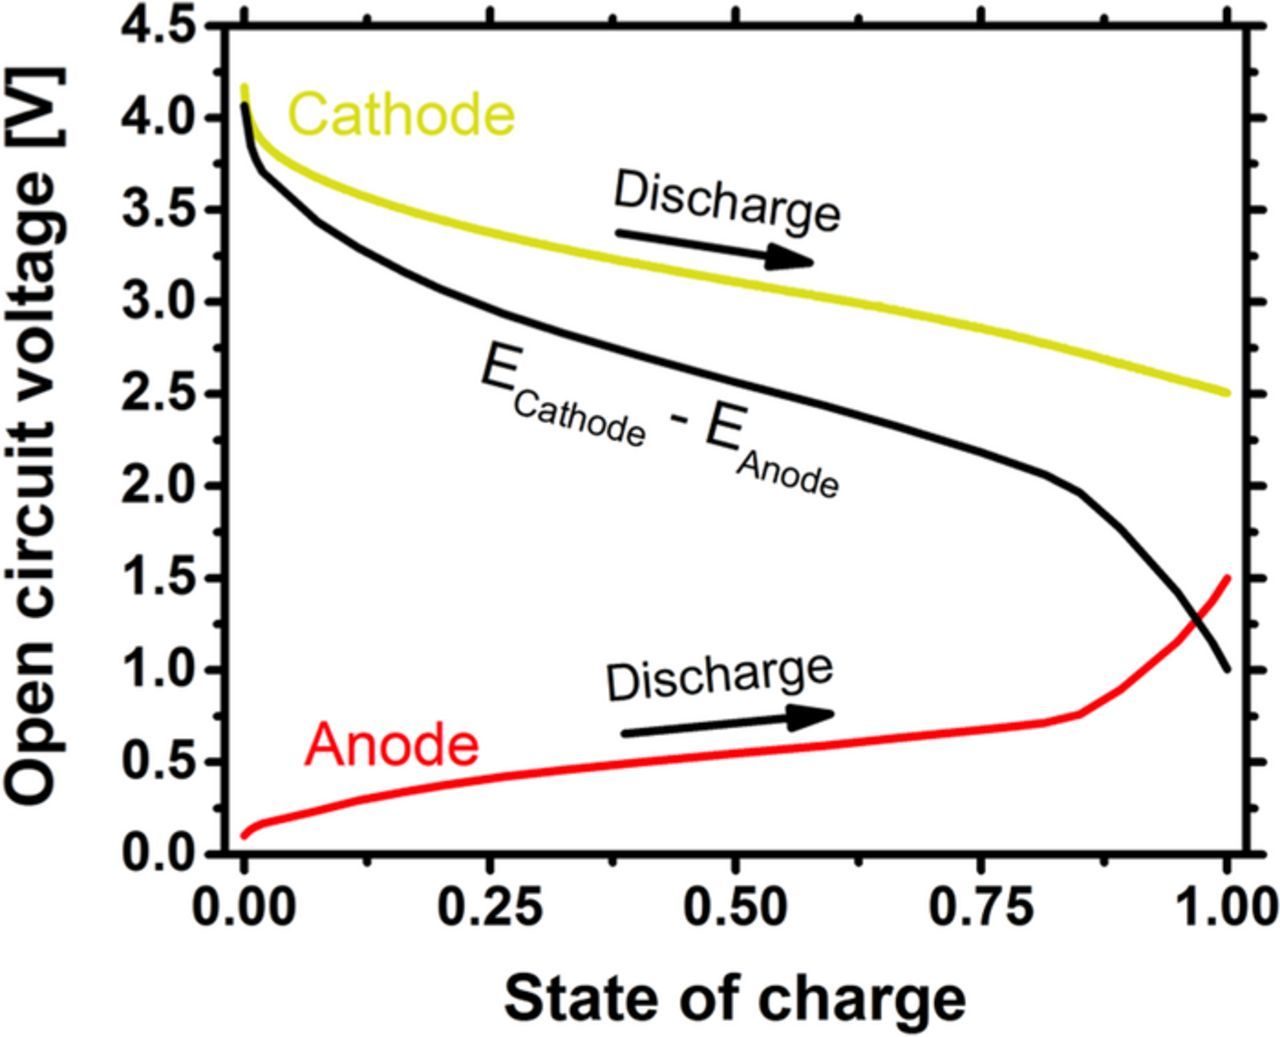
Figure 3. Equilibrium voltage profiles used for the anode and cathode materials in the simulation. During discharge, the cathode voltage decreases and anode voltage increases. The black line shows the difference between the cathode and anode equilibrium voltages.
Table I shows the active material thickness, t, and diffusivity, D, used to simulate each battery in addition to experimentally measured parameters. The active material thickness and diffusivity are fitting parameters bound by half the interconnect pore size (100 nm) and PITT diffusivity measurements in the anode and cathode materials. Measured anode diffusivities varied between 9.34 × 10⁻¹⁸ and 8.51 × 10⁻¹⁷ m2 s−1, with an average of 3.35 × 10⁻¹⁷ m2 s−1. Cathode diffusivities varied between 1.57 × 10⁻¹⁹ and 1.14 × 10⁻¹⁶ m2 s−1, with an average of 1.83 × 10⁻¹⁷ m2 s−1. The anode and cathode diffusivities in the simulation vary by a maximum of 3.35 and 3.66 X the average measured diffusivities for each battery. The model was simulated in COMSOL using a 1-D battery module.
Table I. Parameters used for the simulation of batteries 1 through 5.
| Battery | ||||||
|---|---|---|---|---|---|---|
| Parameter | 1 | 2 | 3 | 4 | 5 | |
| Dneg | [m2 s−1] | 3.0 × 10⁻¹⁷ | 1.0 × 10⁻¹⁷ | 3.0 × 10⁻¹⁷ | 3.5 × 10⁻¹⁷ | 4 × 10⁻¹⁷ |
| Dpos | [m2 s−1] | 1.3 × 10⁻¹⁷ | 5.0 × 10⁻¹⁸ | 6.0 × 10⁻¹⁸ | 3.9 × 10⁻¹⁷ | 6.0 × 10⁻¹⁸ |
| tneg | [nm] | 30.0 | 17.0 | 30.0 | 21.0 | 27.0 |
| tpos | [nm] | 55.0 | 37.0 | 20.0 | 29.5 | 13.3 |
| cneg0 | [mol m−3] | 54,500 | 54,500 | 21,000 | 54,500 | 15,700 |
| H | [μm] | 14.9 | 9.9 | 14.9 | 12.6 | 14.9 |
| Wneg, Wpos | [μm] | 12.6 | 8.4 | 12.6 | 10.7 | 12.6 |
| P | [μm] | 45 | 27 | 45 | 45 | 45 |
Modeling Results
Figure 4 shows predicted and experimental discharge curves of Batteries 1–4, which have the highest combined energy and power densities of our previously tested microbatteries.5 At low C rates, predictions and measurements compare very well. At greater than 30 C rate discharges, there is a slight departure between prediction and measurement, up to 3 percent of total capacity. The measured and predicted discharge curves for Batteries 2 and 3 closely overlap at low and high discharge rates, but the higher predicted capacities at 8.6 and 20 C rates are likely due to error in the thin film approximation as the amount of capacity extracted from a thin film is larger than the concave geometries in the curved electrode pores at moderate discharge rates. The lower average voltages of the discharge curves in Battery 3 indicate that the anode was not fully charged before cycling, which caused to cathode to be overcharged when Battery 3 was charged to a 4.0 volt cutoff. The overcharging caused a higher voltage for the first 0.15 Ah m−2 of experimental discharge. The overall good agreement between predicted and measured discharge curves indicates that the model captures the major physics for high rate discharging and that the 1-D transport model provides an accurate foundation for design studies of batteries discharged at up to 600 C rates.

Figure 4. Comparison of predicted and measured discharge curves in Batteries 1 through 4. The capacity is normalized by the separator area.
We use the calculated lithium concentration throughout the battery to understand how different parameters affect battery performance. Figure 5a shows the electrolyte concentration in Battery 1 at the end of discharge at multiple C rates. The change in electrolyte concentration increases as the C rate increases, except at 457 C, where the battery quickly shuts off before a significant amount of ions can be removed from the electrolyte. This quick shut off is due to limits in the solid active material diffusion and will be discussed later. The maximum concentration change is 250 mol m−3 at 146 C, which decreases the electrolyte conductivity from 8.6 × 10⁻³ S cm−1 to 8.2 × 10⁻³ S cm−1 in the cathode region and 8.5 × 10⁻³ S cm−1 in the anode region. The minimal changes in conductivity indicate that diffusion in the electrolyte did not limit the power performance of Battery 1. Figures 5b and 5c show the final lithium concentrations in the solid electrode active materials in Battery 1 at each discharge rate. The differences in surface and center concentrations increase as the discharge rate increases. The surface and center concentrations in the cathode are 22,200 mol m−3 and 2,600 mol m−3 at 30.5 C, which corresponds to a 1.26 volt difference, or 63% of the battery voltage window. At 457 C, the cathode surface concentration reaches a maximum in 0.17 seconds and limits the capacity to 0.058 Ah m−2. The large concentration differences across the anode and cathode active materials and the associated overpotential at moderate and high discharge rates show that diffusion in the active material limits the power performance of Battery 1. Diffusive limitations in the active materials limit the power performance of all simulated batteries.
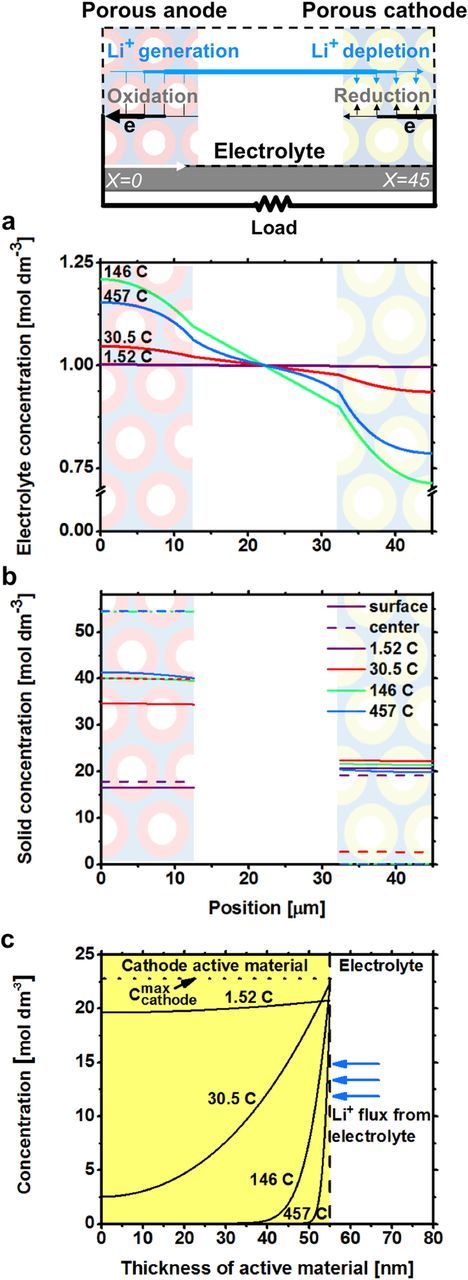
Figure 5. Predicted lithium concentrations for Battery 1 at various discharge rates. a) Lithium concentration in the electrolyte. b) Lithium concentration in the solid. c) Lithium concentration across the cathode active material.
Design and Optimization Considerations
The design process that follows informs how microbattery geometry influences the trade-offs between energy and power density, and develops design rules that guide these trade-offs. The power density of a battery is proportional to the energy density times the C rate, Power ∼ Crate × Energy, so an improved power performance results from an improved C rate and energy density. Figure 6 shows the microbattery geometries that govern ion and electron transport. The electrode width, W, governs diffusion through the electrolyte because the largest electrolyte concentration gradients occur from depletion and generation of lithium ions across the electrode width. The electrode pitch, P, governs ionic conduction in the electrolyte. The active material thickness, t, governs active material diffusion. The particle radius could function as the thickness in other electrode designs. The bicontinuous electrode architecture and the electrode length, L, have the largest impact on electrode electron conduction in this work. Simulating the energy density of Battery 1 at various C rates for a range of values of a single geometric component or governing transport property isolates the influence of each geometric component on the power performance. Data from Battery 1 provides the primary comparison between experiment and simulation in many of the design plots because the experimental microbatteries cover a small subset of geometries compared to the large variation required to cover the simulation range.
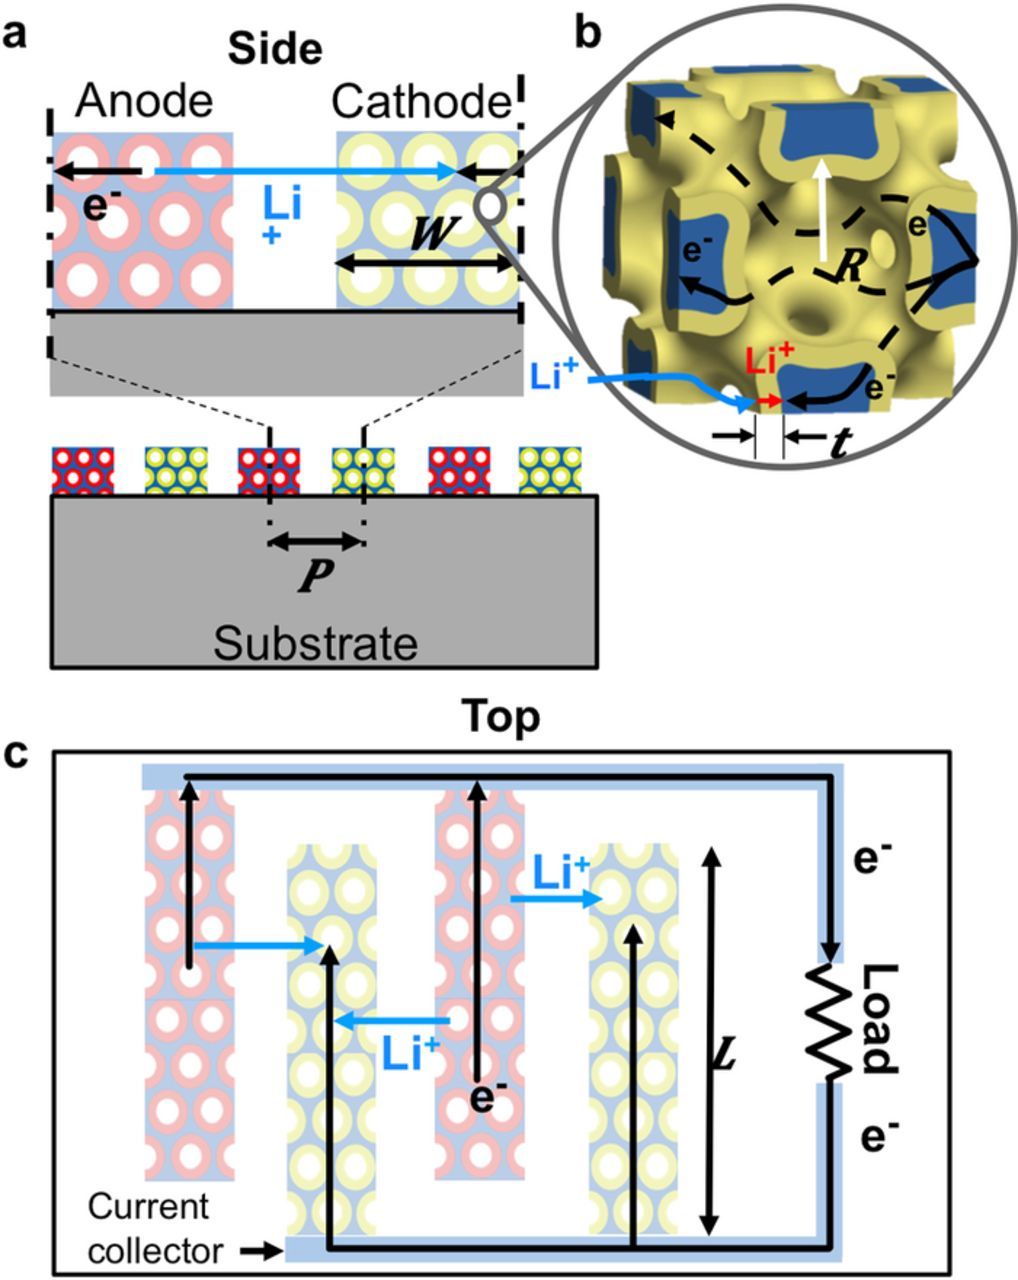
Figure 6. Diagrams of the microbattery electrodes showing important design parameters. a) Cross-section of the microbattery showing electrode width, W, and electrode pitch, P. b) Microbattery electrode architecture showing the electrode pore size and active material thickness, as well as electron transport through the bicontinuous nickel scaffold. c) Microbattery top view showing the interdigitated layout and the electrode length, L.
Electrode width (W)
Figure 7a shows the predicted energy and power density of Battery 1 for various values of the electrode width (5, 12.6 and 50 μm) and electrolyte diffusivity (scaling factor 0.04, 0.2, 1, 5, and 25X from the value in Table I). For batteries with wide electrodes and low electrolyte diffusivities, the Ragone curves show large drops in power density for a given energy density. This results from lithium ions severely depleting in the cathode region such that the concentration is near zero in the electrolyte close to the electrode center. The near zero concentration significantly reduces the local electrolyte conductivity and causes a large voltage to develop across the electrolyte, which brings the battery to the shut off voltage before more energy can be extracted. At higher C rates, the Ragone curves return to normal because diffusion in the active material causes the battery to shut off before severe electrolyte depletion occurs. We conclude that diffusion in the electrolyte has a minimal effect on the battery performance unless the concentration in the cathode region depletes to near zero, at which point the effect is dramatic.
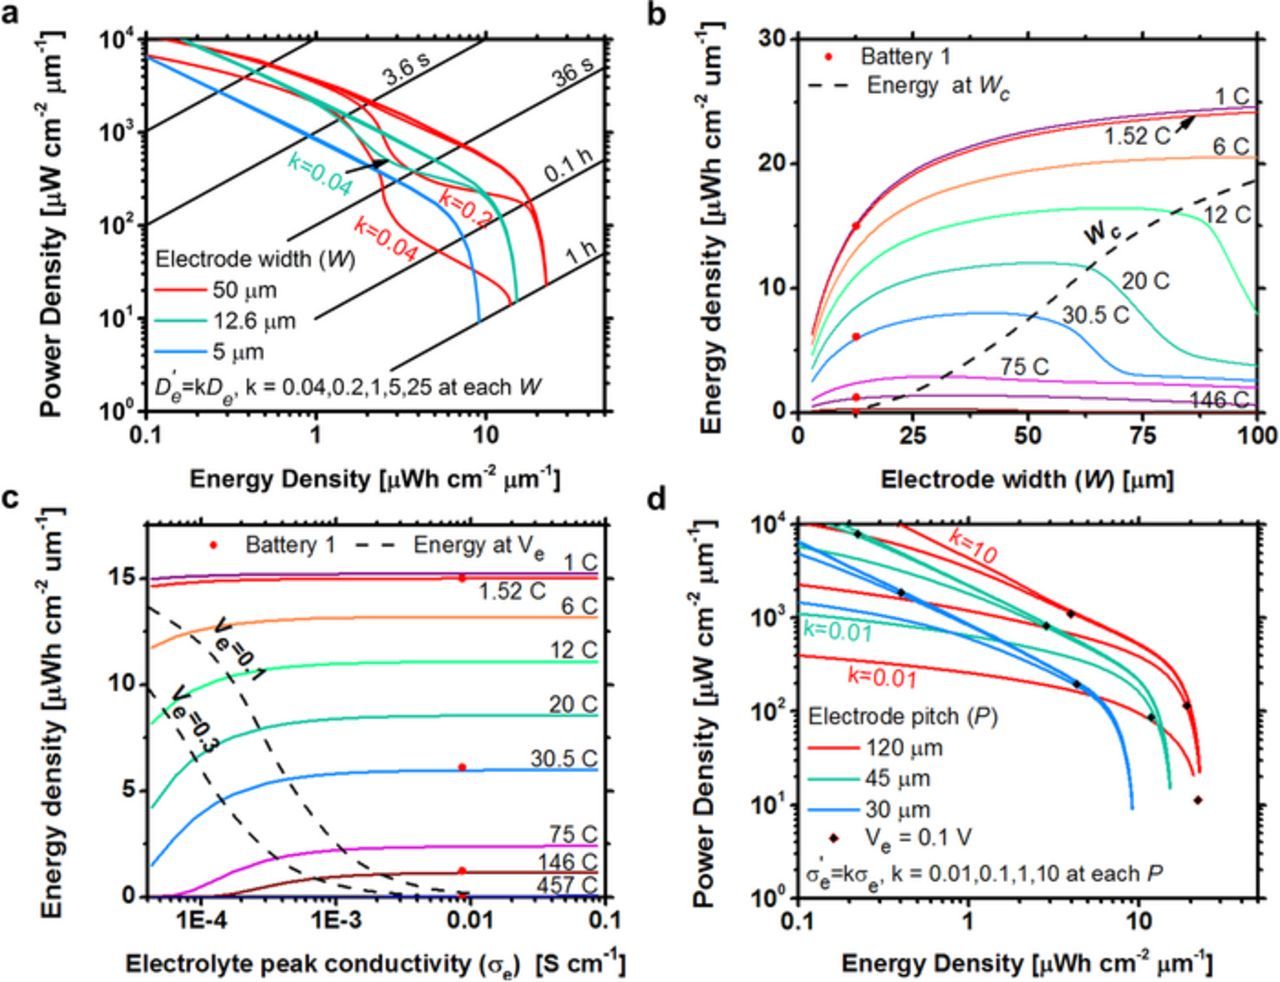
Figure 7. a) Ragone plot of Battery 1 for various values of electrode width (5, 12.6, and 50 μm) and diffusivity (scaling of 0.04, 0.2, 1, 10, and 25X). b) Predicted energy density versus electrode width for Battery 1 at 1 to 146 C rate discharges. The dashed line is the design parameter, Wc, for the electrode width, which corresponds to the complete depletion of lithium ions at the cathode centerline for each C rate. c) Predicted energy density versus electrolyte peak conductivity for Battery 1 at 1 to 457 C rate discharges. The dashed lines are the design parameter, Ve, for the electrode pitch calculated with 0.1 and 0.3 voltage drops across the electrolyte for each C rate. d) Ragone plot of Battery 1 showing the effect of a change in electrolyte conductivity by 0.01, 0.1, 1, and 10 for each electrode pitch. The red dots are experimental data from Battery 1. Black diamonds correspond to inflection points calculated from design parameters.
The point when the concentration in the cathode region depletes to zero is predicted by solving for steady state diffusion in the cathode electrolyte region. The governing equation for 1-D diffusion in the electrolyte with constant and uniform depletion is
![Equation ([8])](https://content.cld.iop.org/journals/1945-7111/164/11/E3122/revision1/d0008.gif)
The depletion rate in the electrolyte,  , is assumed constant when discharged at a constant C rate and uniformly distributed throughout the electrode region.
  is the amount of lithium ions that enter the cathode from the electrolyte, per electrode volume, or
![Equation ([9])](https://content.cld.iop.org/journals/1945-7111/164/11/E3122/revision1/d0009.gif)
Equation 9 is valid when the capacities in the battery electrodes are balanced, or when the cathode limits capacity. The discharge time is approximated as the time it takes to fully discharge a battery at a constant current density (3600 / Crate). Solving Equation 8 yields the concentration profile
![Equation ([10])](https://content.cld.iop.org/journals/1945-7111/164/11/E3122/revision1/d0010.gif)
where x is the distance between the separator, x = 0, and the electrode centerline, x = Wpos. The diffusivity is corrected using the Bruggeman approximation. The initial concentration of the electrolyte, c0e, is the concentration at x = 0, which is valid for most batteries because the concentration change across the separator is small. A symmetric boundary condition exists at x = Wpos. Equation 10 solves for the critical electrode width, Wc, where the steady state electrolyte concentration depletes to zero by setting x = Wc = Wpos when c = 0. Wc is then
![Equation ([11])](https://content.cld.iop.org/journals/1945-7111/164/11/E3122/revision1/d0011.gif)
Figure 7b shows the predicted energy densities of Battery 1 discharged at multiple C rates with varying electrode width (3–100 μm) and constant Wsep = 19.8 μm. The dashed line shows the energy density of batteries with electrode widths equal to Wc. A maximum energy density occurs for each C rate because of competition between the increases in electrode volume fractions (W/P) that improve energy density and the increase in ion diffusion length through the electrode width. The energy density at 12, 20 and 30.5 C dramatically decreases after the maximum energy density is reached because the concentration of lithium is depleted to near zero in the cathode electrolyte. An electrolyte with increased or decreased diffusion coefficient would increase or decrease the electrode width required to deplete to zero concentration. We conclude that Wc is a good design parameter for the cathode width as it predicts the largest allowable cathode electrode width before severe ion depletion occurs.
Electrode pitch (P)
Figure 7c shows the predicted energy density of Battery 1 discharged at 1–500 C rates with electrolyte conductivities varied between 4 × 10⁻⁵ S cm−1 and 1 × 10⁻¹ S cm−1. The electrolyte conductivity was scaled by 1 × 10⁵ to study the effect of the pitch on power performance without affecting other physics in the system, and also represents the affect of changing the battery electrolyte. The dashed lines represent a constant potential drop across the electrolyte calculated using Ohm's law, where the voltage drop, Ve, and electrolyte conductivity, σe, are related to the pitch, P, by
![Equation ([12])](https://content.cld.iop.org/journals/1945-7111/164/11/E3122/revision1/d0012.gif)
The current density is
![Equation ([13])](https://content.cld.iop.org/journals/1945-7111/164/11/E3122/revision1/d0013.gif)
i is the electrode with the lowest total capacity. m = 0.5 in the positive and negative electrode region because on average half the current is transported by ionic conduction and the other half by electron conduction in the electrode. m = 1 in the separator region. εe is the volume fraction of the electrolyte in each region. Equation 12 is valid when the electrolyte concentration has little variance during discharge, which is true if Wpos < Wc. The energy density at each C rate in Fig. 7c remains constant as the conductivity decreases until the voltage drop in the electrolyte, calculated from Equation 12, is greater than 0.1 volts.
Figure 7d further demonstrates how the electrolyte conductance affects power performance by plotting power density versus energy density for various electrode pitches (30, 45, and 120 μm). The electrode separation is held constant. At each pitch, the peak electrolyte conductivity is scaled by a factor of 0.01, 0.1, 1 or 10X. At low power density, battery performance has minimal dependence upon electrode pitch or conductivity. The point at which the power performance begins to rapidly change (marked by a black diamond for each battery) is predicted by Equation 12 when Ve = 0.1 volts. We conclude that high power performance microbatteries should be designed so that Ve < 0.1 volts.
Electrode electron path
Figure 8a shows how the electrode conductivity affects the energy density of Battery 1 at 1–500 C discharge rates. The conductivity is varied by up to 1 × 10⁻⁸ times the conductivity in Table I. The dashed lines in Fig. 8a correspond to the energy density of batteries where the voltage drop across the electrodes, Vs, is 0.3 or 0.1 V. The voltage drop is estimated using Ohm's law,
![Equation ([14])](https://content.cld.iop.org/journals/1945-7111/164/11/E3122/revision1/d0014.gif)
where the current density is calculated from Equation 13. Figure 8b shows predicted power density versus energy density for Battery 1 with varying electrode conductivities. The point at which the power performance begins to rapidly change (marked by a black diamond for each battery) is predicted by Equation 14 when Vs = 0.1 volts. We conclude that high power performance microbatteries should be designed so that Vs < 0.1 volts.

Figure 8. a) Predicted energy density versus electrode conductivity scaling factor for Battery 1 at 1 to 457 C rate discharges. The dashed lines are the design parameter, Vs, for the electrode length and architecture calculated with 0.1 and 0.3 voltage drops across the electrode for each C rate. b) Ragone plot of Battery 1 as the electrode conductivity is scaled from 10−7 to 100 times the reference conductivity.
Active material thickness (t)
The active material thickness influences the fraction of lithium extracted or inserted into the active material at a discharge rate. A smaller active material thickness allows more energy to be extracted in less time; there are however practical limits on the thickness. Figure 9a shows how the cathode active material thickness in Battery 1 affects the energy density at 1–500 C rate discharges. A maximum energy density occurs because of competing effects between an increase in the total volume fraction of the active material and an increase in the distance that lithium travels. The maximum can be predicted by comparing the diffusion time, τ, to the diffusion distance, l. The active material thickness corresponding to the maximum power performance, to, is predicted from the diffusivity, Ds, and C rate using Dτ/l2, or
![Equation ([15])](https://content.cld.iop.org/journals/1945-7111/164/11/E3122/revision1/d0015.gif)
where n is 1 for a slab and  for a sphere. The dashed line in Fig. 9a is the energy density corresponding to to, when n = 1, which predicts the maximum with reasonable accuracy. The amount of lithium extracted or inserted into the active material is constant for a constant Dτ/l2 when the discharge is stopped at a set surface concentration, which is valid for batteries discharged at a constant C rate.45 It follows that the extracted capacity of a microbattery with to active material thickness is a constant fraction of the total capacity if the shutoff concentration is set to the maximum concentration in the cathode or minimum in the anode. The fraction of extracted capacity is 2/3 the maximum when n = 1 and the active material thickness is to. Figure 9b is a simulated Ragone plot for Battery 1 with cathode active material thicknesses varied between 13 and 100 nm. The power curve for 15.5 C shows the energy and power density of each battery when discharged at a 15.5 C rate. The maximum power performance occurs at the apex of the 15.5 C power curve and corresponds to to = 55 nm, which is the optimal active material thickness predicted from Equation 15 at 15.5 C rate. The energy and power density corresponding to to for each battery is marked with a diamond. We conclude that power performance is near optimal when the active material thickness is to.
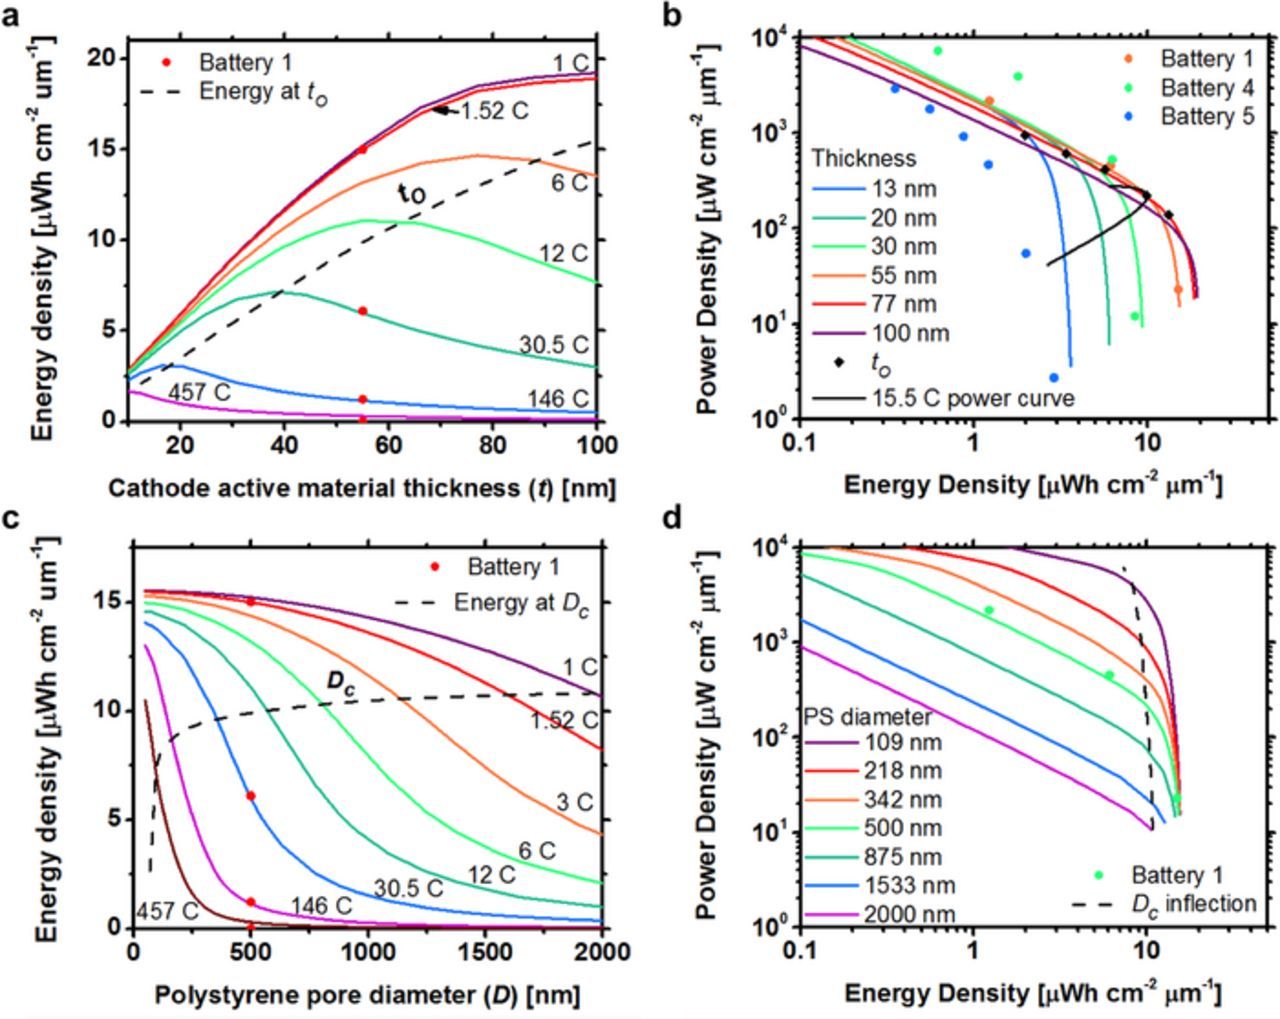
Figure 9. a) Predicted energy density versus active material thickness for Battery 1 at discharge rates of 1 to 457 C. The dashed line is the design parameter to for the active material thickness. b) Ragone plot of Battery 1 as active material thickness is varied. The 15.5 C power curve is the energy and power density of batteries with varied thicknesses discharged at 15.5 C rate. Colored dots are experimental data. Black diamonds correspond to inflection points calculated from design parameters. c) Predicted energy density versus pore diameter for Battery 1 at discharge rates of 1 to 457 C. The active material thickness is varied with the pore size to maintain a constant volume fraction. Dc is the pore diameter corresponding to to. d) Ragone plot of Battery 1 as active material thickness is varied and volume fraction maintained.
Figures 9c and 9d show how the active material thickness affects the power performance independent of the volume fraction by changing the pore diameters. The active material thickness is varied with the pore size to maintain a constant volume fraction so that the pore diameters in Figs. 9c and 9d are approximately proportional to the active material thickness. The dashed line in Fig. 9c shows battery performances when the active material thickness is to. Increasing the active material thickness past to dramatically reduces the power performance at all C rates, including 1 C. Decreasing the pore size (PS diameter) improves the power performance because the diffusion distance through the solid active material is reduced (higher power) while the active material volume fraction remains the same (constant energy). A battery fabricated with 109 nm PS diameter particles can be discharged at 300 C and maintain 55% of its total energy density.
In the simulated batteries, the electrode pores are FCC closed packed. If the pore distribution deviated from FCC close packed toward random close packed, the nickel volume fraction would increase and the active material volume fraction would decrease. If the active material thickness was maintained, and thus the C rate performance held constant, the power density would still decrease because the reduced active material volume fraction would decrease the energy density.
Battery Design Summary
The design parameters (to, Wc, Ve, and Vs) provide a simple tool to optimize the power performance of a battery using only battery geometry and material properties. To illustrate the design utility, we optimize Battery 1 for a 50 C rate discharge using the design parameters and compare the optimized performance to experimental data. Figure 10a shows a diagram of the optimized microbattery. The microbattery geometry was chosen by setting the active material thickness to to and cathode width to Wc, while decreasing the pore size to 250 nm to increase the active material volume fraction. Additionally, the pitch was set so Ve ⩽ 0.1, and the electrode length so that Vs ⩽ 0.1. Figures 10b and 10c show the power performance of the 50 C rate optimized microbattery. The microbattery capacity at 50 C is 56% of the 1 C rate capacity, which agrees well with the 2/3 performance predicted by Equation 15. The 50 C rate optimized design has ∼ 10 X increase in energy density compared to Battery 1 at 1,000 mW cm−2 μm−1 power density and ∼ 10 X increase in power density at 10 μWh cm−2 μm−1 energy density. The most significant power performance improvements came from increasing the cathode width and optimizing the active material thickness while reducing the pore size to 250 nm. Figure 10d shows sensitivity analysis results for the 50 C rate optimized design when all combinations of the active material thickness and electrode width are varied by ±10 and 25%. Microbatteries with better power performance than the 50 C optimized design are to the right of the red line. A majority of the microbatteries have lower power performance than the 50 C rate optimized design. We conclude that the design parameters can be used to optimize microbattery geometry for maximum power performance.
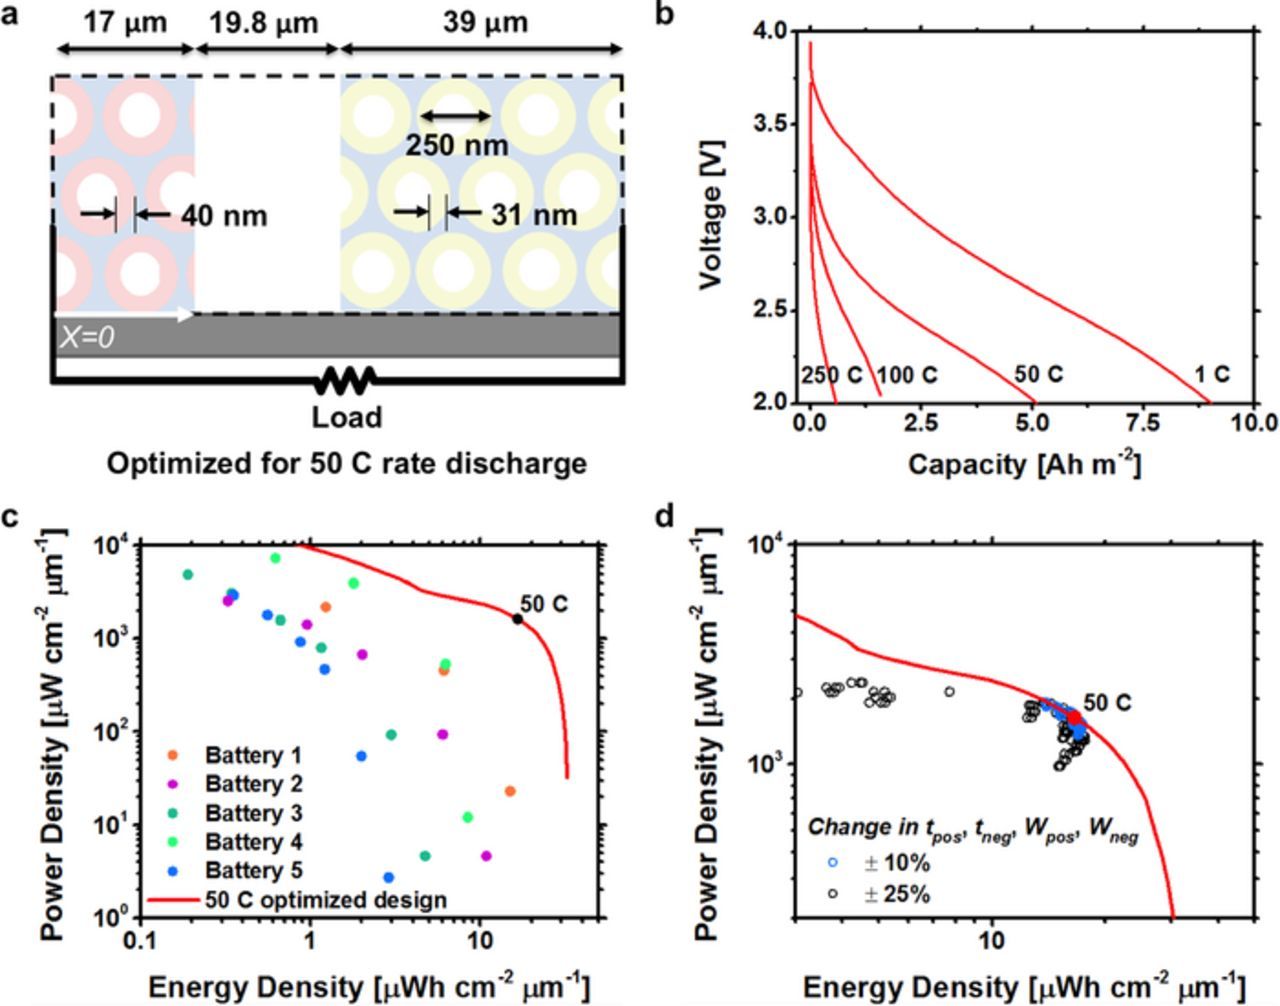
Figure 10. a) Schematic of a battery architecture optimized for a 50 C discharge rate using the design rules presented here. b) Predicted discharge curve of the battery. c) Ragone plot of the battery performance compared to previously fabricated batteries. The 50 C rate discharge point is marked. d) Sensitivity analysis of the optimized battery. The electrochemically active material thickness and electrode width are varied by plus and minus 10 and 25 percent.
The design optimization presented here is for a single porous anode and cathode separated by electrolyte. Stacking many of these anode, cathode, and electrolyte sections together would increase the total battery energy and power, but maintain the same energy and power density, and thus performance, as long as the electrodes are stacked so that the geometric properties that control transport (represented by to, Wc, Ve, and Vs) remain the same.
Conclusions
In conclusion, the performance of microbatteries with up to 7.4 mW cm−2 μm−1 power densities were predicted using 1-D transport models combined with a geometric model of the bicontinuous electrodes. The 1-D model showed good agreement between predicted and measured discharge curves at up to 600 C rate discharges and indicated that diffusion through the electrochemically active material limited battery power performance. The accuracy of predictions could be improved by accounting for material property changes, including capacitive transport, and accounting for pore wall or surface film mass transport limitations. The microbattery geometry was related to the power performance using four design parameters, to, Wc, Ve, and Vs. The microbattery geometry can be optimized for a desired output power by setting the active material thickness to to, the cathode width to Wc, the pitch so Ve ⩽ 0.1, and the electrode length so that Vs ⩽ 0.1. A 50 C rate optimized microbattery based on the interdigitated bicontinuous architecture showed a ∼ 10 X improvement in power performance over the experimental batteries, indicating that significant improvements in power performance are possible with advances in microbattery design and fabrication. The 1-D electrochemical model and design parameters provide a new tool for developing novel material architectures, nano composites, and full battery cells with improved power performance, which is critical for the maximum exploitation of energy storage technologies in many applications. In addition, the performance limitations and design parameters developed in this work are based on the same physical models used for macroscopic batteries; therefore, these design principles might be applicable for improving the performance of macroscopic batteries.
List of Symbols
| 1-D | One dimensional |
| A | Area |
| b | Interconnect diameter |
| c | Concentration |
| Crate | C rate of discharge |
| D | Diffusion coefficient |
| Dc | Polystyrene diameter corresponding to to |
| DMC | Dimethyl carbonate |
| EC | Ethylene carbonate |
| F | Faraday constant [96,485.3365 A s mol−1] |
| FCC | Face centered cubic |
| h, h2 | Spherical cap height |
| H | Electrode height |
| i,I | Current |
| k | Electrode conductivity |
| l | Length |
| L | Electrode length |
| n | Shape factor |
| OCV | Open circuit voltage |
| P | Electrode pitch |
| PC | Propylene carbonate |
| PITT | Potentiostatic intermittent titration technique |
| PS | Polystyrene |
 |
Depletion rate (in electrolyte) |
| R | Polystyrene radius, or resistance |
| ρ | Resistivity |
| SEI | Solid electrolyte interphase |
| SEM | Scanning electron microscopy |
| t | Active material thickness |
| τ | Time |
| t+ | Transference number |
| V | Voltage or volume |
| W | Electrode width |
Greek
| σ | Conductivity |
| ε | Volume fraction |
Subscripts
| act | Active material |
| c | Critical |
| e | Electrolyte |
| i | Electrode with the lowest total capacity |
| n | Sintered polystyrene |
| neg | Negative electrode |
| Ni | Nickel |
| o | Optimal |
| pos | Positive electrode |
| s | Solid component |
| sep | Separator or region between electrodes |
| v | Central void |
| void | Non-solid pore space in between polystyrene particles |
Superscripts
| 0 | Initial condition |
| eff | Effective |
| max | Maximum |
Acknowledgments
This research was supported by the National Science Foundation Engineering Research Center for Power Optimization of Electro Thermal Systems (POETS) with cooperative agreement EEC-1449548 and in part by the Department of Energy Office of Science Graduate Fellowship Program (DOE SCGF), made possible in part by the American Recovery and Reinvestment Act of 2009, administered by ORISE-ORAU under contract no. DE-AC05-06OR23100.