
Abstract
Magnesium (Mg) with a concentration range of 1 to 3 at% was successfully doped in zinc oxide (ZnO) and prepared via a hydrothermal process in powder form. X-ray diffraction patterns revealed a polycrystalline nature of the prepared powders. Images taken by a scanning electron microscope showed that the synthesized powders had clear solid hexagonal rod structures. Furthermore, the solid hexagonal structures were hollow because of the Mg ions introduced into the ZnO. The photoluminescence emission of the undoped and Mg-doped ZnO showed an enhancement of the ultraviolet emission with the Mg concentrations. Furthermore, the Gaussian fitting reveals that the UV band emission is consist of two emissions. The first peak was at 3.36 eV for the undoped ZnO that shifts to 3.4 eV, 3.43 eV for the 1 at% Mg and 2 at% Mg concentration, respectively. Thereafter the UV peak position reduced to 3.39 eV for the 3 at% Mg ions concentration. The results were studied, and the correlation of the results was attributed to the doping process.
Export citation and abstract BibTeX RIS
Zinc oxide (ZnO) has been widely used in various advanced applications such as optoelectronic and electronic devices. ZnO performs well in ultraviolet (UV) sensors,1 gas and biosensors,2,3 field effect transistors (FET),4 light-emitting diodes (LED) and laser applications.5,6 Furthermore, ZnO find their applications in the area of photocatalysis and biomedical applications.7,8 ZnO is a semiconductor compound and belongs to the VI-II group. It has a wide bandgap with energy equal to 3.37 eV at room temperature,9,10 which is near the UV spectral region, and exciton binding energy of 60 meV.11,12 These characteristics of ZnO place it among the most prominent materials for various applications. Several low-cost growth techniques have been developed to prepare high-quality ZnO nanoparticles; these include thermal evaporation, sol-gel processing, hydrothermal processing, and mechanical milling.9,13–16 Hydrothermal processing produced highly durable and repeatable structures and could be used for large-area substrates at relatively low temperatures.17
The modulation of the bandgap energy of ZnO by a doping process has become a crucial task. This process can result in profound changes in the optical and electrical properties of ZnO. Certain elements such as chromium, aluminum, indium and gallium,2,18–20 have been successfully doped into ZnO for use in various applications such as gas sensors and transparent conductive layers. Magnesium-doped ZnO attracted attention because of its potential in optoelectronic applications such as deep UV sensing.21,22
Several groups have studied extensively the effect of Mg concentration on the performance of ZnO for different applications. The effect of Mg concentrations on ZnO nanorods was studied by Te-Hua Fang and Shao-Hui Kang.23 The thermoelectric effect of ZnO:Mg was investigated at various temperatures. The study revealed that the turn-on voltages and average resistances at 50–120°C were significantly better than those at room temperature (22°C). The tuning of the optical bandgap of ZnO nanowires was controlled via Mg doped process in the range (0, 5, 10 and 20 at. %) by Singh et al.24 The optical bandgap was increased from 3.35 eV to 3.65 eV with the Mg content. Furthermore, the performance of organic solar cells based on Mg-doped ZnO nanorod arrays has been investigated. It was observed that the diameter of the nanorods were decreased with the Mg concentration. The highest power conversion efficiency was achieved at Mg concentration of 3 at.%.25 The electronic properties of Mg doped ZnO thin films were studied by Wu et al.26 It was found that the resistivity of the films increased with the increase of Mg concentrations, which was due to the decrease of the carrier concentrations. Ju et al.27 manufactured field effect transistors (FET) based on Mg doped ZnO nanorods. The effect of Mg doped on the performance of the ZnO FET was studied. A higher ON currents were achieved without significant degradation in ON–OFF ratio. The manufactured FET based on the Mg doped ZnO nanorods find a possible application in the field of display technologies. UV photodetector based on Mg-doped ZnO nanorods have been examined by Liu et al.28 At bias volt of 1 volt, the ratio of UV/VIS response was approximately 400. Furthermore, the prepared UV photodetector based on Mg-doped ZnO have a sharp cutoff at wavelength of 350 nm which make it blind at the visible range of the light.
Few reports were published on the doping of ZnO with Mg by a hydrothermal method that produced ZnO:Mg in a powder form,29–33 so further investigation is necessary. This report describes the growth of micro and nano rods of Mg doped ZnO. The effect of Mg-doped ZnO (in the range of 1 to 3 at%) on the structure and optical properties of prepared samples will be studied. This investigation is useful for preparing the ZnO:Mg rods for optoelectronic applications such as deep UV photodetectors. For the best of our knowledge, the growth of ZnO rods doped with Mg without substrate support was not report.
Experimental
Undoped ZnO powder samples and doped with various Mg concentrations were prepared using a hydrothermal process. The undoped ZnO powders were prepared from 50 mM aqueous solutions of zinc nitrate hexa-hydrate Zn(NO3)2•6H2O and hexamethylenetetramine (CH2)6•N4 (from Sigma-Aldrich). Both precursors with equi-molar ratio were dissolved in 100 ml of DI water (which corresponds to 3.72 and 1.0514 gm, respectively). The solution was stirred continuously for 1 h at room temperature. For Mg-doped ZnO with Mg/Zn ratio of 1, 2 and 3 at% concentrations, which corresponding 35.75, 71.50, 107.25 mg of Mg(NO3)2•6H2O. The aqueous solutions were stirred for 1 hr at room temperature, after that it was kept in a screw-capped bottles and were inserted in a convection oven at a temperature of 95°C for 6 h. The bottles were removed from the oven and cooled to room temperature. A white-color precipitate substance was noticed in all samples. The contents were centrifuged, washed several times with DI water, and dried at 100°C. The samples then were post-annealed for 2 h at 750°C under ambient atmospheric conditions. The high annealing temperatures enhanced the crystallization of ZnO structures.34,35
The surface morphologies of the ZnO structures were investigated using field emission scanning electron microscopy (FE-SEM), which was conducted on a LEO SUPRA 55VP (Carl Zeiss) with energy-dispersive X-ray spectroscopy (EDX, Oxford Inca) to determine the elemental compositions. The X-ray diffractometer from Bruker D8 ADVANCE was used to identify the phase structures. The X-ray diffractometer was operated at a voltage of 60 kV and a current of 60 mA using a copper target that emitted 1.54 Å X-rays. The surface composition of the sample was analyzed by (XPS) using the OMICRON Nano Technology model - ESCA+, Mg Kα (1253.6 eV) radiation was used as the excitation source. The spectra were analyzed using the CASA XPS software (Casa Software Ltd). The binding energies were corrected for the charge shift using the C1s peak of carbon (BE = 284.8 eV) as a reference. For the optical emission measurements, the photo-luminescence (PL) spectrum was recorded using an Edinburgh Photonics FLS920 device with a xenon lamp (450 W). The measurement range was in the wavelength of 330 to 550 nm. The excitation wavelength was 300 nm. The measurements were performed under atmospheric conditions (21°C, 50% relative humidity).
Results and Discussion
The crystalline structure of the prepared samples was investigated by analyzing the X-ray diffraction (XRD) patterns of the prepared samples. Figure 1 revealed the XRD patterns of the prepared samples with the scanning Bragg angle of 20° to 80°. The samples exhibited a polycrystalline structure with high-quality crystallinity as indicated by the sharp XRD peaks even after doping with 1 to 3 at% Mg. The peaks appeared in the pattern match well with the ZnO hexagonal structure (JCPDS No. 36-1451). Furthermore, it is clear from Fig. 1 that no diffraction peaks other than the ZnO were detected. This might be due to the doping concentration is beyond the sensitivity of X-ray diffractometer unit.
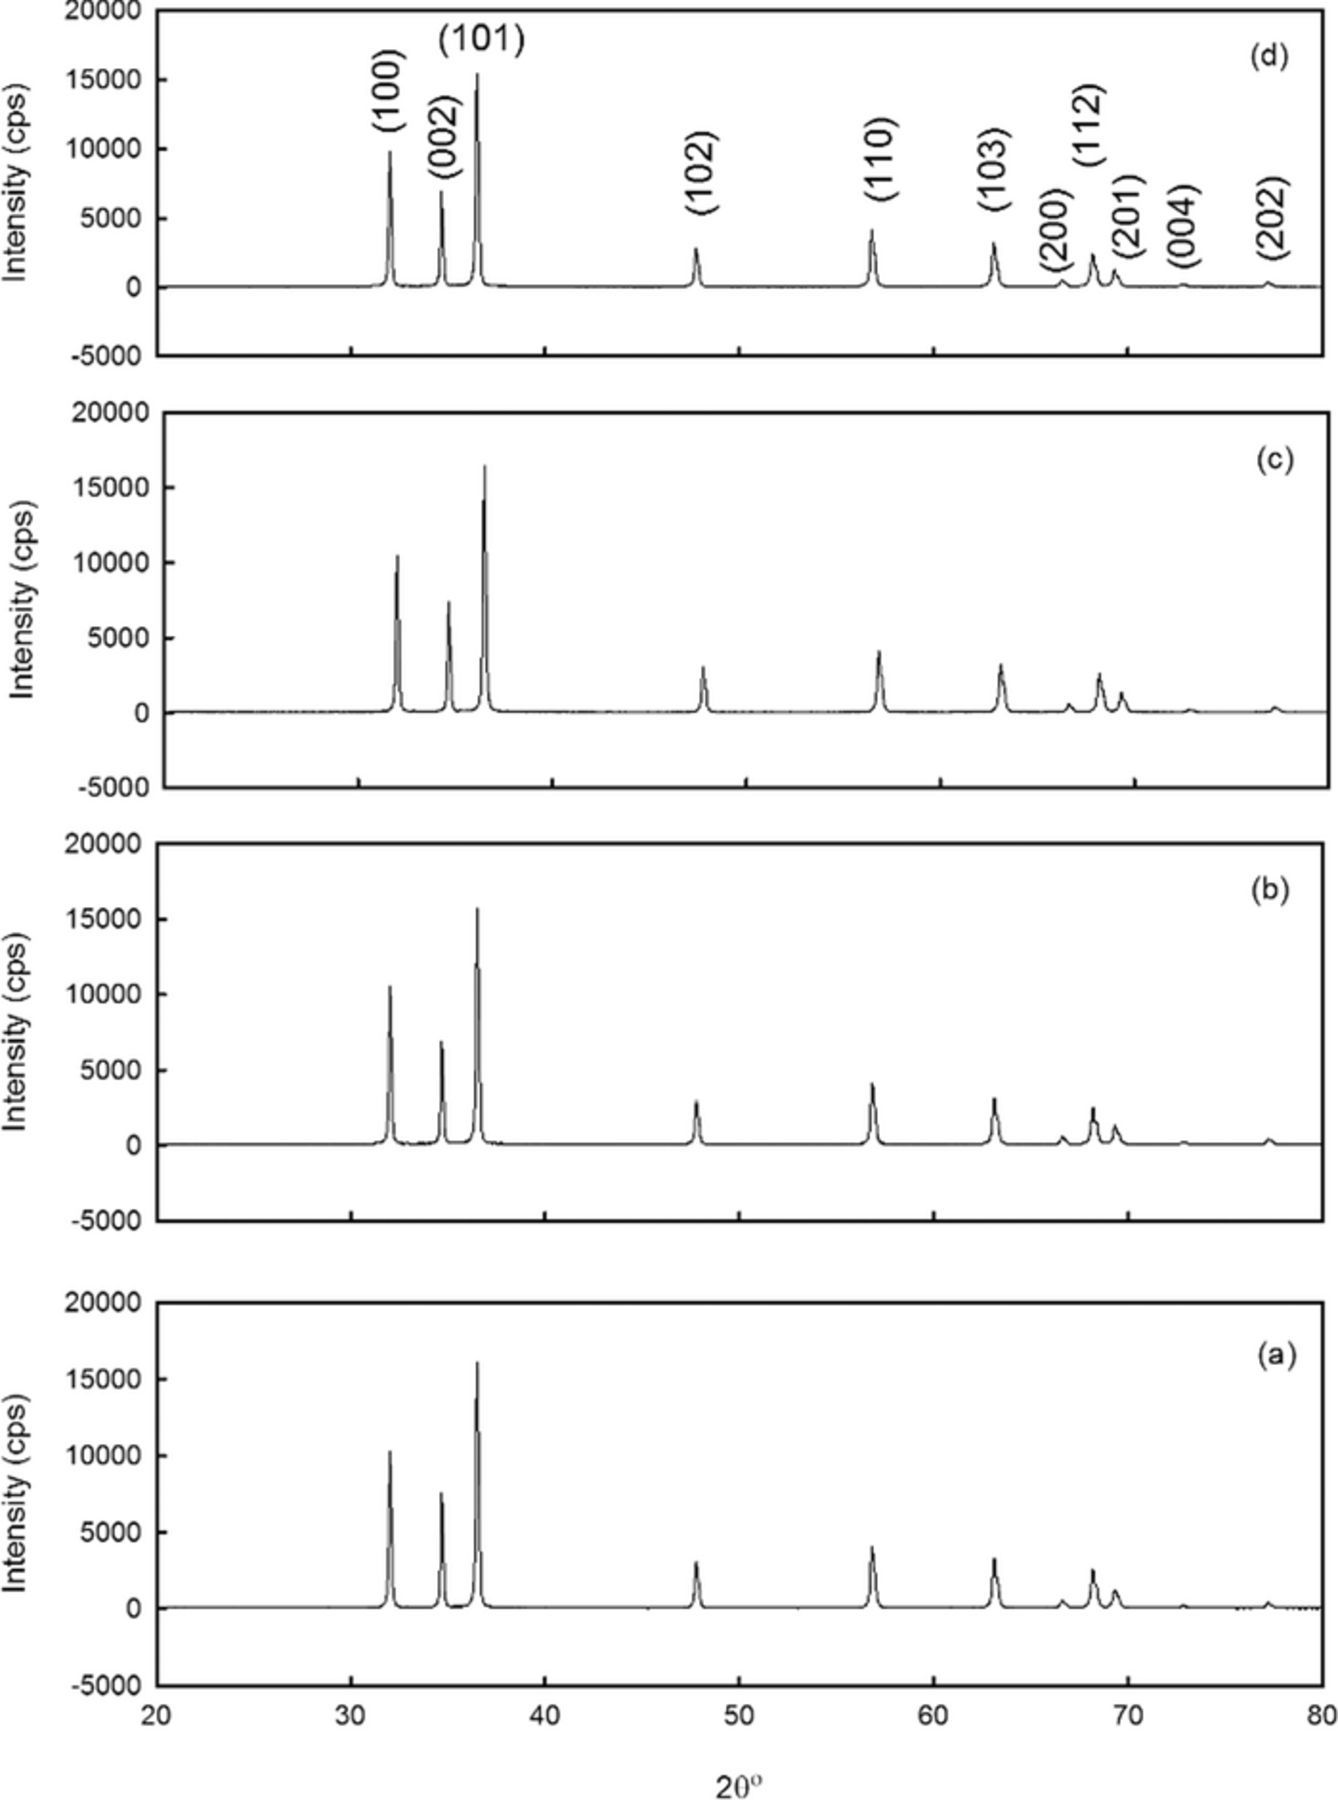
Figure 1. The XRD pattern of the prepared undoped and ZnO doped with 1 to 3 at% Mg concentration via hydrothermal process. (a) Undoped ZnO, (b) ZnO: Mg (1 at%), (c) ZnO: Mg (2 at%) and (d) ZnO: Mg (3 at%).
The substitution of Mg insignificantly changed the Bragg angle position of the diffraction peaks as expected from the similar ionic radii of Mg2+ (0.57 Å) and Zn2+ (0.60 Å).26,36 No other peaks related to Mg were detected in the prepared samples, which suggest that the samples do not have any phase segregation or secondary phase formation. This is probably due to the uniformly crystalline structure when a small amount of Mg dopant is added. The lattice constants of the ZnO wurtzite structure were calculated according to:37
![Equation ([1])](https://content.cld.iop.org/journals/2162-8777/6/9/P571/revision1/d0001.gif)
The calculated lattice constants (a) and (c) for the prepared Mg-doped ZnO are tabulated in Table I.
Table I. Structural parameters for polycrystalline undoped and ZnO-doped Mg at concentrations of 1 at%, 2 at%, and 3 at%.
| Mg | ave Mg by EDX | a (Å) | c (Å) | c/a | Intensity peak Ratio (101/100) | D (nm) |
|---|---|---|---|---|---|---|
| 0% | 0% | 3.249 | 5.204 | 1.602 | 1.54 | 43 |
| 1 at% | 1.05 | 3.248 | 5.204 | 1.602 | 1.16 | 50 |
| 2 at% | 1.94 | 3.249 | 5.205 | 1.602 | 1.13 | 57 |
| 3 at% | 1.70 | 3.241 | 5.194 | 1.602 | 1.17 | 43 |
From Table I, the lattice index for both (a) and (c) is near the standard results of the ZnO (JCPDS No. 36-1451), and the ratio (c/a) proves that the prepared samples of the undoped and doped ZnO are nearly an ideal wurtzite structure. The insignificant effect of the Mg concentrations on the ZnO lattice parameters is probably due to the high solubility of the Mg ions in ZnO lattice.38
From Fig. 1, it was noticed that the intensity ratio of the (101) to the (100) peak decreased significantly as the Mg is introduced to the ZnO lattice, indicating higher growth rate along (101) direction as compared to the other two main reflection peaks in the undoped and Mg doped ZnO samples, as can be seen in Table I. These degradations in the peak ratios is probably due to the substitution of the Mg ions in the ZnO lattice. The mean crystallite size (D) from the width of the (101) reflection peak was estimated using Scherrer's equation.39 It can be noticed the increase of the mean crystalline size with Mg concentrations up to 2 at% after that the mean crystalline size experienced a decrease. The same behavior was noticed by Abed et al.40 The increase in mean crystallite size is due to the enhancement of the agglomeration of particles with the Mg concentrations. Hence, the decrease in the mean crystallite size with 3 at% Mg is probably due to the less occupation of the Mg in the ZnO lattice.37,38
The FE-SEM images of the undoped and doped ZnO with Mg concentrations of 1 to 3 at% are shown in Fig. 2.
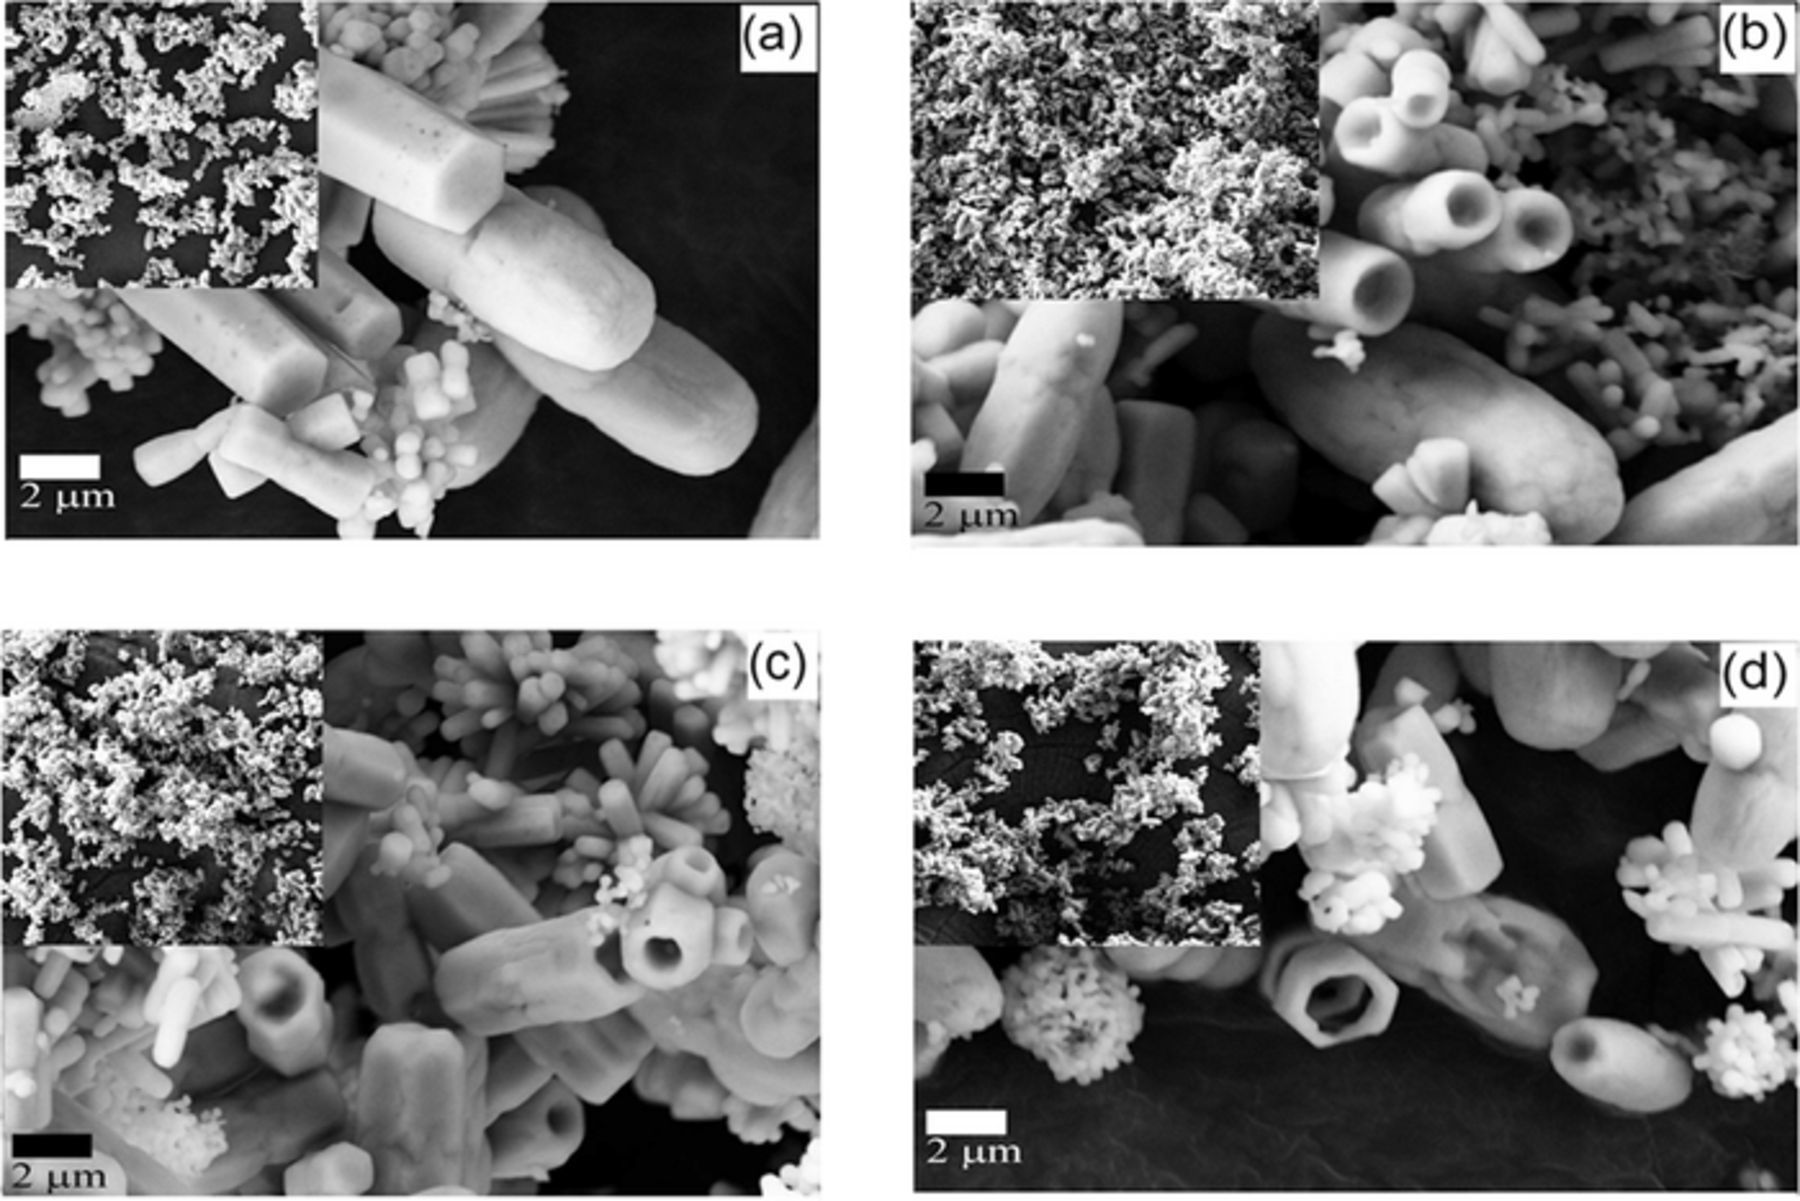
Figure 2. The FE-SEM images of the prepared ZnO doped with Mg with (a) undoped ZnO (b) ZnO: Mg (1 at%), (c) ZnO: Mg (2 at%) and (d) ZnO: Mg (3 at%). All the images were taken at magnification of 5.0 kx
The micro images show that the prepared powders are shaped in nearly hexagonal rods. The size of the rods was in the submicron range, and the Mg concentrations had an insignificant effect on the grain size of the prepared ZnO. Furthermore, the ZnO rods became hallow as the Mg was added to the prepared solution. The same effect of the Mg on the ZnO morphology was noticed by Caglar et al.41 and Hammad and Salem.31
The nucleates and the growth of ZnO rods in the hydrothermal process are controlled through the inhabitant growth of the ZnO crystals.15,41 In this process, the ZnO rods are grown in two nucleation sites, either with Zn- or O-terminated (001) surfaces.42 The growing of both tube and rods structures are significantly based on these polar, respectively.18 Once the Mg ions are introduced in the ZnO lattice, the local density of OH− ions on the Zn-terminated (001) polar surface of the rods will increased as a result of the addition of the precursor to the solution.18,42 Consequently, the Mg doped ZnO will grow in the tubes form. At the same time, the rods will grow from the nucleation sites on the O-terminated (001) polar surface.18 This will result in the co-appearing of both forms as can be seen from the FE-SEM images in Figure 2.
The quantitative EDX analysis of the surface indicated that the oxygen content was higher than the zinc content. The results of the quantitative amount as measured with the EDX are tabulated in Table I. From the EDX measurements, it was noticed that the Mg average concentration (at%) at 3% was 1.70%. It was reported from the phase diagram of the ZnO–MgO binary system, that the solubility of MgO is approximately 4 at% in the bulk form. In view of these results, it can be concluded that the solid solubility of MgO in ZnO is between 2 at% and approximately 3 at%, which is lower than what has been published previously.24,42,44 The results obtained in this study are similar to the work published by Abed et al.,40 where they prepared Mg doped ZnO nanocrystals via sol-gel process. This may be attributed to the large structural dissimilarity between Mg-ZnO with high Mg content.43,45 Furthermore, it was found that the fabrication methods have a significant role in the solubility limit of MgO in ZnO.46,47
The lower amounts of the Mg concentrations detected via the EDX measurements from the calculated precursors probably might be due to the inhomogeneous distribution of Mg atoms in ZnO matrix.24,31,48
The chemical states of the undoped ZnO and the Mg-doped ZnO powder samples were investigated using XPS measurements. Fig. 3 depicts the wide scan of the prepared undoped ZnO and Mg-doped ZnO (3 at%) powder; the XPS spectra were mainly composed of C, Mg, O, and Zn. The C 1s peak at a binding energy of 284.8 eV was incorporated from the starting material. This line is used frequently as an internal reference. To obtain a more detailed image, high resolution and narrow range scanning at the area with the elements of interest were employed. These regions were 80 to 100 eV for the Mg,49–51 525 to 540 eV for the oxygen, and 1016 to 1024 eV for the Zn. We chose to focus on the binding energy range from 80 to 100 eV as it demonstrates the existence of the Mg ions.
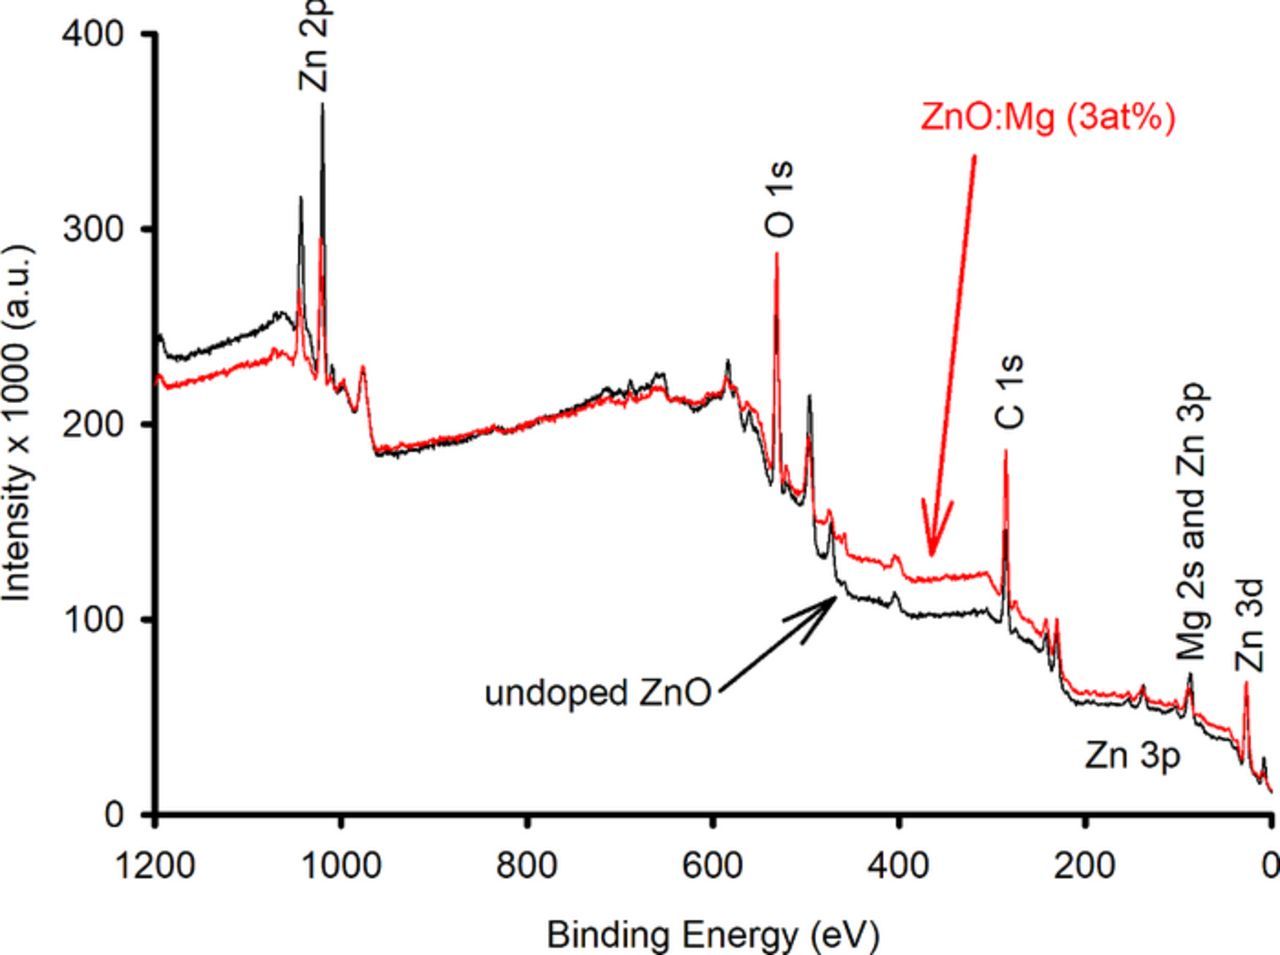
Figure 3. The XPS wide scan spectrum of undoped ZnO and Mg-doped ZnO (3 at%).
According to the XPS database, it is known that the Zn 3p and the Mg 2s have a binding energy of 89.0 and 88.0 eV, respectively. Deconvolution of the spectra of the undoped ZnO at that area can be best fitted with a single peak as shown in Fig. 4. The peak of the Mg-doped ZnO is also depicted in Fig. 4. Peak fitting is best accomplished with two Gaussian shape peaks, with the lower representing the Mg 2s and the higher representing the Zn 3p. As the Mg was added to the ZnO, the XPS peak at this energy grew larger, it was noticed that the best fit for the peaks was consistent with two nearly Gaussian curves. The first peak located near the binding energy of 88.0 eV was attributed to the Mg 2s, and the second peak found near 89.8 eV was attributed to the Zn 3p in the ZnO lattice. The binding energy of the Mg 2s for Mg-doped ZnO prepared samples shifted to the higher-energy side, as the Mg content increased from 1 at% to 2 at%. This is due to the incorporation of Mg ions into the lattice position in the ZnO structure and ensures the existence of the Mg ions as MgO.50 The ZnO doped with 3 at% Mg shows a shift to the lower binding energy; this might be attributed to the limited solubility at this concentration.
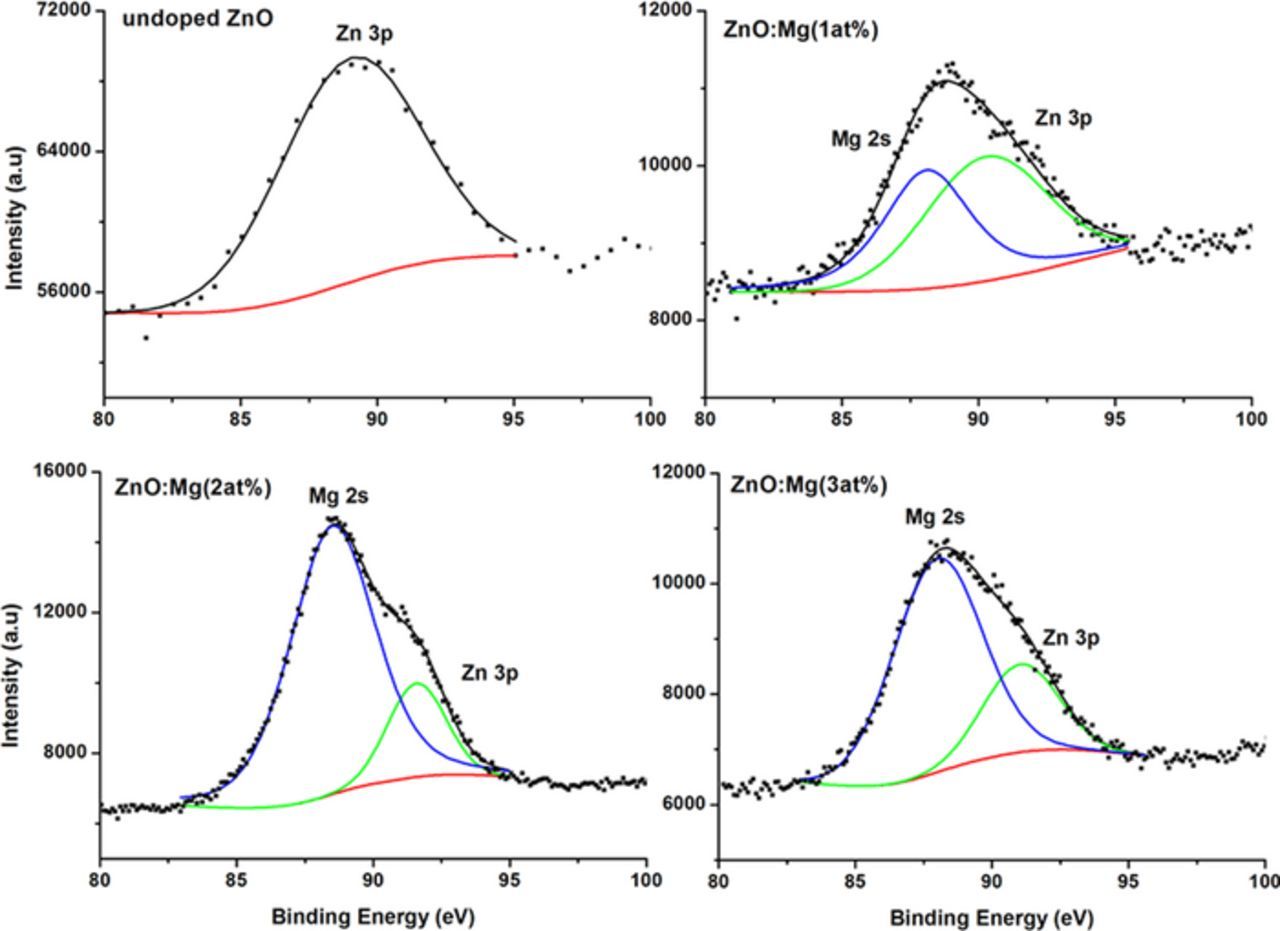
Figure 4. The deconvolution and fitting of the 80 to 100 eV binding energy region of Zn 3p and Mg 2s for the prepared undoped ZnO and Mg-doped ZnO.
The PL emission of the prepared undoped and doped (1 to 3 at% Mg) ZnO powder samples at room temperature is depicted in Fig. 5, which illustrates the enhancement of the UV emission of the prepared Mg-doped ZnO samples. The emission was fading again as the Mg concentration approached 3 at%. According to Fu et al.,43 materials with high defects surface area tends to capture more photo generated free carriers, which result in the quenching of the band-edge emissions. Passivating the surface will decrease the surface defect densities.
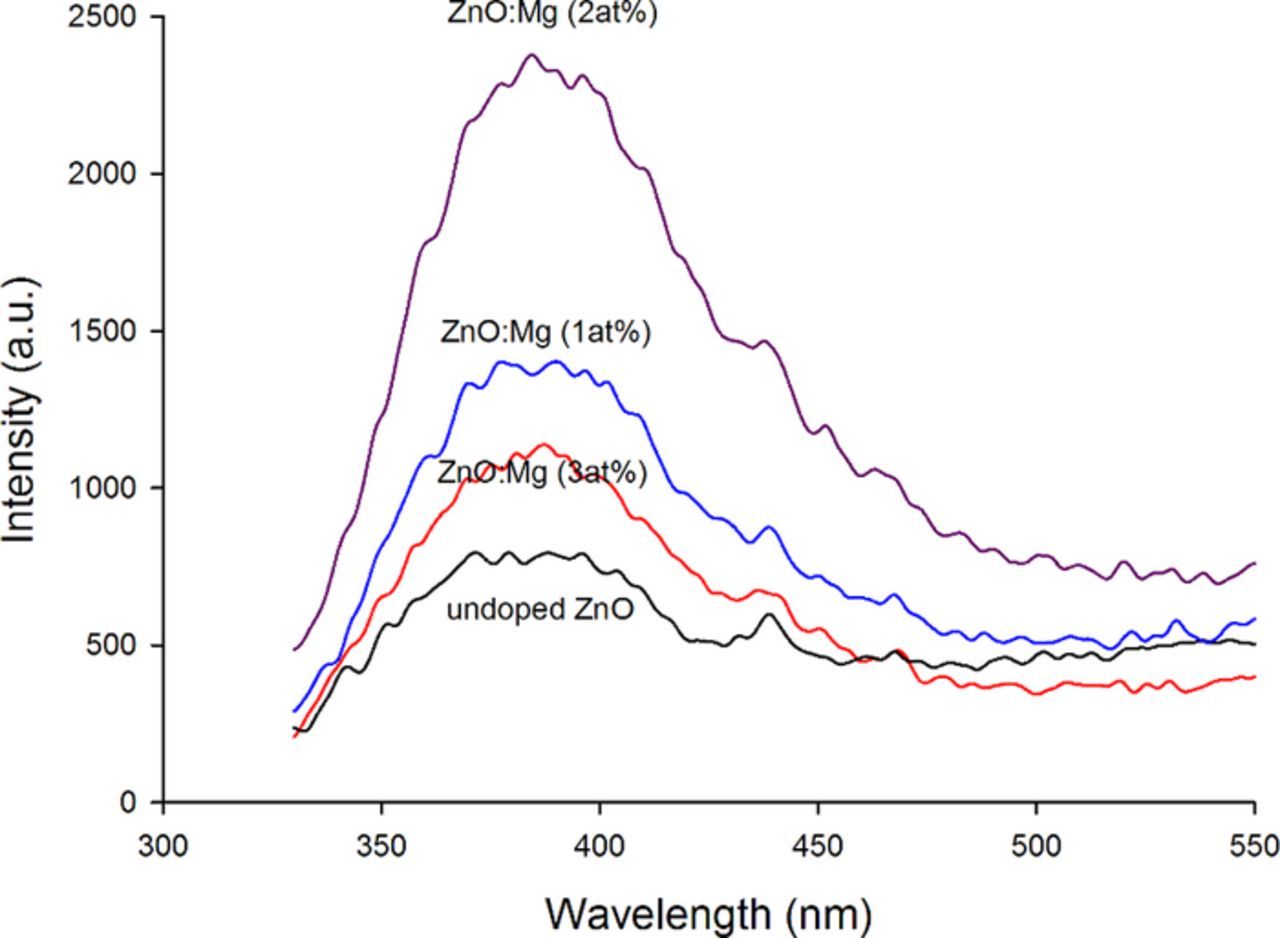
Figure 5. Room-temperature PL spectra of the undoped and doped (1 to 3 at% Mg) ZnO.
For the samples prepared in this study, MgO probably passivated the surface of ZnO grains and decreased the density of defects at the surface; consequently, the UV emission was enhanced. The enhancement in the UV band intensity was reported by several groups.24,37,52,53 On the other hand the reduction of the UV emission intensity height at Mg concentration 3 at.% might be due to the reduction of Zinc vacancies and oxygen interstitial concentrations by the Mg incorporation.33
The UV emission had a wavelength of approximately 384 nm (∼3.22 eV), which is near the energy bandgap of the undoped ZnO (Eg = 3.37 eV) and may belonged to exciton – exciton collision process.54 However, this emission probably consisted of several emissions around this area as the peak became wider with the doping of Mg ions.55 The other emission was at wavelength ∼ 440 nm (2.82 eV blue emission), according to several reports, this emission originates from the defect emission of interstitial zinc (Zni).43,56–58 The shift of these emission with the Mg doping concentration was insignificant, which suggested that this state might formed during the annealing process.56
Deeply examine the PL emission of the prepared samples reveal two main emissions at the UV region. Fig. 6 depicts the Gaussian fitting of the PL emission peaks at the UV region. For the undoped ZnO sample the UV emission is consisted of two emissions the 3.36 and 3.15 eV that is due to the near-band-edge (NBE) and from recombination of free exciton–exciton, respectively.
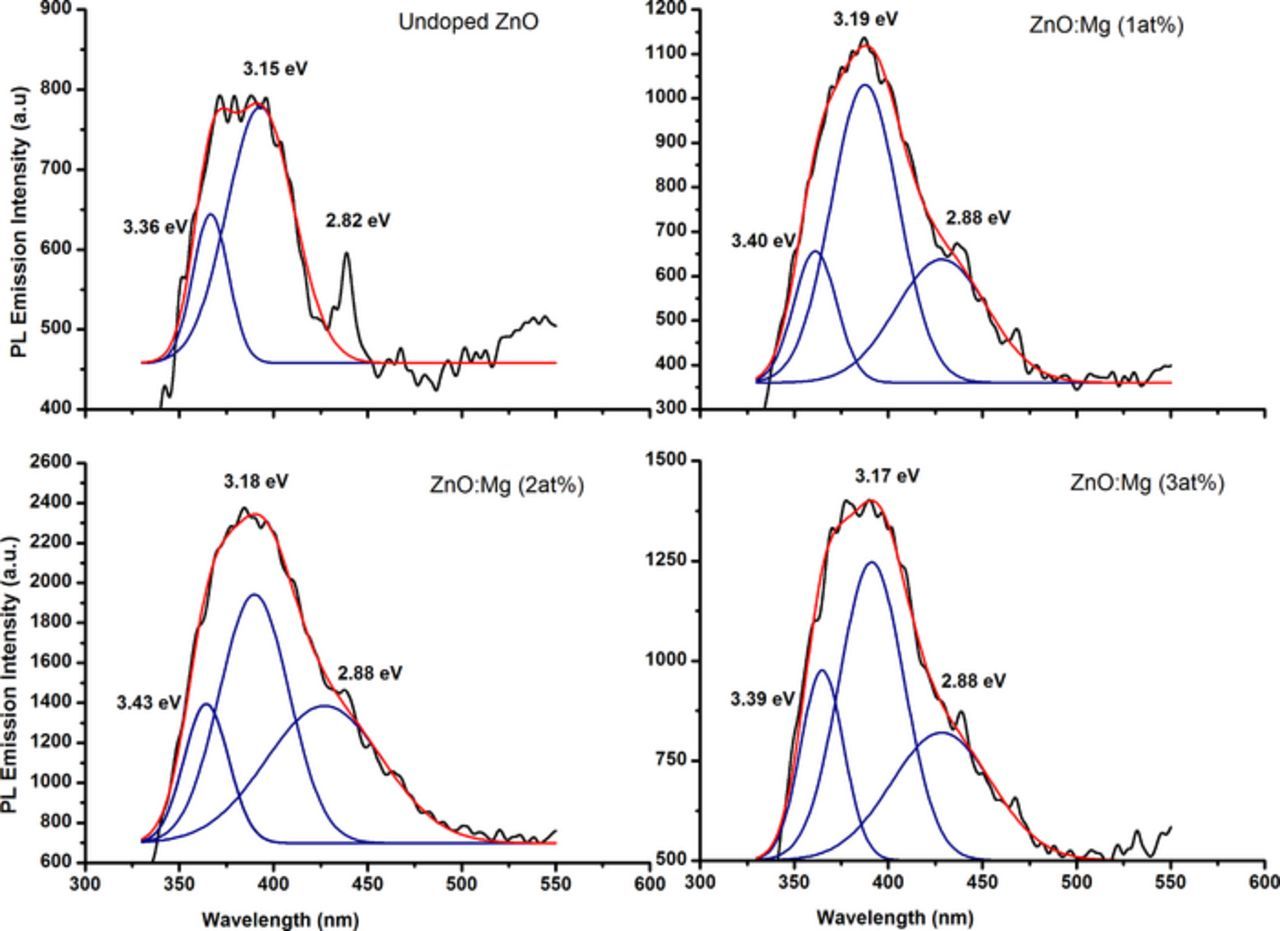
Figure 6. The deconvolution and the fitting of the PL emission spectrum for the prepared undoped ZnO and Mg-doped ZnO. The black line color represents the measured spectrum the blue line color represents the Gaussian fitting of the spectra and the red color line represents the peak sum of the fitting.
As the Mg ions are introduced in the ZnO lattice the Gaussian fitting reveals the peak at 3.36 eV was shifted to 3.40 eV which is due to the incorporation of the Mg ions (with 1 at%). Once the Mg ions are incorporation in the ZnO lattice, an expand in the energy bandgap of ZnO is emerged.55 The peak was further shifts with 2 at% Mg ions incorporation to the value of 3.43 eV. The shift in the UV energy can be as a result of two different factors, namely quantum size effect or the modifications in the bandgap. As the grain size in this study were higher than (<7 nm) for the quantum size effects which proves that the bandgap was modify as a result of the Mg doping.30,47 However, the peak was shifted to lower energy at 3.39 eV with Mg ions concentration approaches to 3 at%. This implies that Mg is less incorporated into the ZnO lattice.59 The difference in the exciton – exciton collision process peak positon might probably due to the variation in the native defects concentrations.54
Conclusions
ZnO doped with Mg (1–3) at% were synthesis through hydrothermal process. The result powder samples were in nearly hexagonal rods shape. The intensity ratio of the (101) to the (100) peak decreased significantly as the Mg increased. The PL emission was enhanced with the increased of the Mg concentration up to 2 at.%, after that the emission was faded, probably due to the reduction of the defect concentrations. The Gaussian fitting of the UV near-band-edge PL emission reveals a shift in the UV band transition from 3.36 eV to 3.43 eV with the Mg contents (0–2) at.%.
Acknowledgments
This work was supported by the Universiti Kebangsaan Malaysia (UKM) through short-term grant number DIP 2016–029 (UKM). The authors are also thankful to the Centre for Research and Instrumentation Management (CRIM) at UKM for providing the PL measurements and FESEM.