
Abstract
This work discusses the one-step potentiostatic growth of manganese oxide on stainless steel for pseudocapacitor electrodes. The electrode material was studied through in situ ellipsometry and electrochemical impedance spectroscopy, in order to correlate its microstructure with the capacitive response. Ellipsometry results show the formation of three layers during the potentiostatic synthesis of manganese oxide on stainless steel: the thickening of the native oxide of the substrate, and the growth of two distinct layers of manganese oxide. The inner layer is slightly more compact (>n) and more resistive (<k) than the outer one. The electrochemical characterization of modified electrodes showed that the increase in the growth potential (from 0.7 to 1.0 VSCE) leads to the formation of manganese oxide films with higher specific capacitance (from 64 to 330 F g−1 at 2 A g−1). This effect is due to an increase in the area of the active material and to a decrease in the thickness of the inner layer of the manganese oxide film. However, higher growth potentials also lead to an increase in film resistivity due to the increase in the density and thickness of the outer layer, which hinders the diffusion of ions through the film as evidenced by EIS.
Export citation and abstract BibTeX RIS

This is an open access article distributed under the terms of the Creative Commons Attribution 4.0 License (CC BY, http://creativecommons.org/licenses/by/4.0/), which permits unrestricted reuse of the work in any medium, provided the original work is properly cited.
To achieve an efficient energy transition to renewable sources it is fundamental to adopt a mix of sustainable energetic sources that for easier management require energy storage devices. Supercapacitors play an important role in this transition due to their high specific power and short time of response.
The most commonly used materials as electrodes for supercapacitors can be divided into three categories: carbon-based materials, 1,2 conducting polymers 3,4 and transition metal compounds. 5,6 In the case of metal compounds, manganese oxide appears as one of the most promising materials for this purpose due to its high theoretical specific capacitance, abundance, low cost and environmental safety. Its synthesis can be performed through different methods, such as thermal decomposition or chemical precipitation, 7–9 which leads to powdered materials, and electrochemical techniques for thin film deposition. 10 The synthesis method promotes the formation of different Mn oxide polymorphs that display distinct microstructures and oxidation states that affect the electrochemical response of these electrodes. Consequently, several authors have studied the effect of the synthesis parameters on the electrochemical performance of manganese oxide electrodes. Babakhani et al. studied the effect of several electrodeposition conditions (overpotential, manganese salt concentration, solution temperature, and pH) on the electrochemical behavior of galvanostatically synthesized manganese oxide electrodes from acetate-containing aqueous solutions on gold substrates. 11 The morphology of the electrodeposited manganese oxide films changes from thin sheets to rod-shaped deposits with increasing applied current density. The highest specific capacitance (230 F g−1) and capacitance retention rate (88%) were achieved for manganese oxide films with thin sheets structure, which presented instantaneous nucleation and single crystalline growth. 11 Heat treatments to the modified electrodes after their synthesis can also affect the electrochemical behavior of the active material due to different amounts of hydrates and oxidation states of manganese. 12
The electrodeposition of manganese oxide onto platinum under potentiostatic 13 or galvanostatic 14 control from an aqueous solution of MnSO4 in a H2SO4 electrolyte consists of several steps. Initially, Mn2+ ions are electrochemically oxidized to soluble Mn3+ until their concentration at the electrode reaches saturation. Then, it chemically precipitates onto the electrode starting the nucleation of MnOOH crystallites. Finally, the MnOOH deposit undergoes solid state oxidation to MnO2 with a preferential growth of the existing MnO2 crystallites. 13,14 However, in this study it was used a different electrolyte solution and substrate, which probably will lead to a different mechanism of nucleation.
This work aims at discussing the structural evolution of manganese oxide films grown potentiostatically on stainless steel at different applied potentials, through in situ ellipsometry and electrochemical impedance spectroscopy (EIS), and to determine its effect on the pseudo capacitive response of the modified electrodes in neutral electrolyte. The manganese oxide films were named as MnOx due to the possible presence of different manganese oxides in the modified electrodes.
Experimental
Electrochemical setup
The electrochemical apparatus consisted of a three-electrodes configuration in a one-compartment cell connected to a potentiostat Gamry 1010E. The counter electrode was a platinum sheet and the reference was a saturated calomel electrode (Hanna Instruments). The working electrode consisted of a 304L stainless steel sheet (Goodfellow, UK) connected to a copper wire through colloidal silver suspensions, and encased in epoxy resin (EpoKwickTM FC, Buehler, USA) forming a disk with an exposed geometric area of 1 cm2. The polishing of the working electrode was initiated using a metallographic polisher with sandpapers with a successively smaller grain size down to SiC grit 4000. Then, the electrode was polished manually on a polishing cloth using alumina suspensions with grain sizes 1, 0.3 and 0.05 μm until obtaining a mirror-like surface. Finally, the electrode was cleaned with abundant acetone and Millipore water to remove polishing impurities.
Electrochemical experiments were performed inside a Faraday cage at room temperature and without deaeration of solutions.
Electrodeposition of the MnOx electrodes
The electrodeposition of MnOx was carried out in an aqueous solution with a pH of 6.5 of 0.1 M LiClO4, as supporting electrolyte, and 0.3 M MnSO4.H2O. For the study of the applied potential effect, it was used a total charge density of 40 mC cm−2. In-situ ellipsometric experiments were performed during SS 304 oxidation and MnOx electrodeposition through a monochromatic ellipsometer with a rotating analyser (Sentech SE 400), which is equipped with a He-Ne laser (λ = 6328 Å), at an incident angle of 70°. The refractive index of the electrolytic solution (ne = 1.3405) was determined prior to the ellipsometric tests with an Abbe "60" refractometer.
Electrochemical characterization of the MnOx electrodes
The electrochemical characterization was performed in an aqueous solution of 1 M Na2SO4. EIS measurements were executed with a 10 mV rms potential perturbation around OCP, in the frequency range from 100 kHz to 10 mHz, and with 10 points per decade with a logarithmic distribution. The electrochemical response of the modified electrodes was determined by cyclic voltammetry and galvanostatic charge-discharge (GCD) tests and the materials stability was accessed by GCD for 5000 cycles.
Results and Discussion
Substrate characterization
In the case of using an active substrate, such as stainless steel, the possible formation of a resistive oxide layer on the electrode must be considered. Therefore, before starting the synthesis of manganese oxide films, the behavior of the stainless steel 304 electrode under a potentiostatic regime, without the presence of the manganese salt, was investigated through in situ ellipsometry. Ellipsometry is based on the variation of the polarization of a specularly reflected light beam after interacting with a given surface. In an ellipsometric test, the polarization change is determined by the phase difference — Δ — and the magnitude ratio — Ψ. Phase difference is a very sensitive parameter to the thickness variation. Figure 1a presents the evolution of phase shift with time, at different applied potentials — 0.8, 0.9 and 1.0 V vs SCE — in a 0.1 M LiClO4 solution. The small variation of Δ (3°–6°) after 10 min of anodic pulse suggests the formation of a very thin layer, which increases in thickness with increasing the applied potential. The current transient, with the simultaneously recorded Δ evolution at 0.8 V (vs SCE) for the first 10 s, is represented in Fig. 1b. The increase in the thickness of the native oxide occurs substantially in the first seconds of oxidation and then evolves very slowly due to the resistive nature of the passive layer.
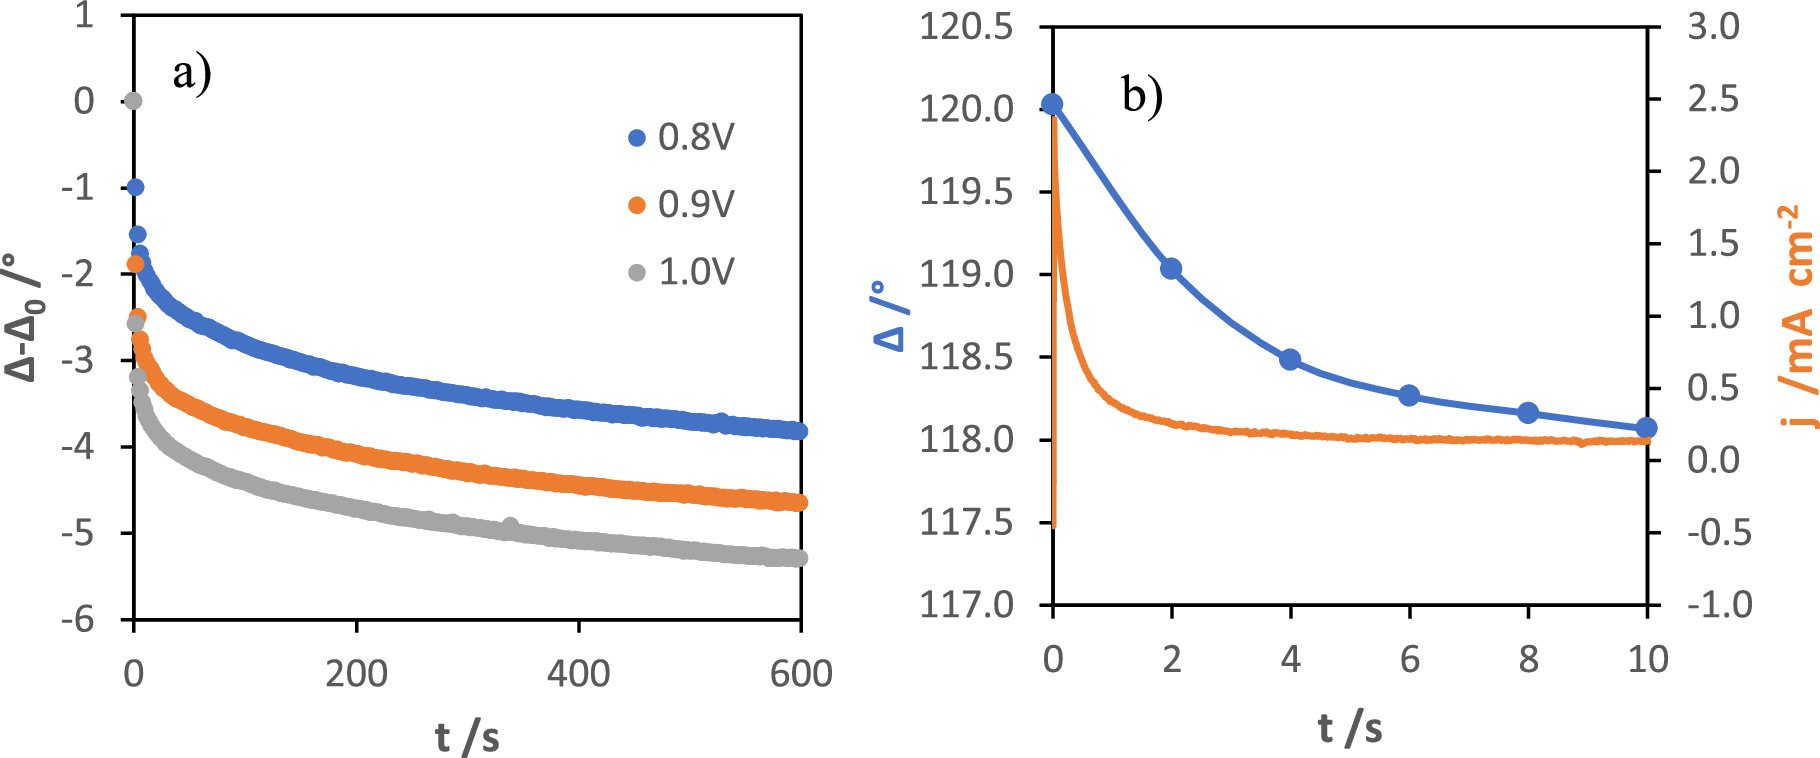
Figure 1. Evolution of normalized Δ during the electrooxidation of stainless steel at different potential pulses — 0.8, 0.9, and 1.0 V vs SCE — in a 0.1 M LiClO4 solution (a), and current-time transient with the simultaneous recorded phase shift evolution at 0.8 V during the first 10 s (b).
Download figure:
Standard image High-resolution imageA three-phase model (solution, film and substrate) was used to simulate the growth of a single homogeneous layer onto the substrate. This procedure consists in determining the complex refractive index of the film ( ) that allows obtaining the best adjustment between the theoretical and experimental ellipsometric curves — Δ vs Ψ — without losing the physical meaning of the system. The model used to calculate the optical parameters and thickness (d) of the film is based on the fundamental equation of ellipsometry, which relates the ellipsometric parameters — Δ and Ψ — with the Fresnel reflection coefficients —
  and
and 

In practice, the ellipsometric parameters are a function of the optical parameters of the 3 phases and the thickness of the film. The refractive index of the electrolyte solution is determined using a refractometer, while that of the substrate is determined before electrodeposition. As such, we get an equation with two variables (Ψ and Δ) and three unknowns (nf , kf and df ), which is not possible to solve analytically. Therefore, it is necessary to estimate one of the parameters, which is usually the film thickness.
The determination of the thickness of the oxide layer on stainless steel was performed assuming a constant refractive index — n — of 2.3, as reported by several authors. 15,16
The extinction coefficient — k — of the films decreases with increasing applied potential, evidencing the increase in resistivity. After about 5 s of pulse, the substrates subjected to 0.8, 0.9 and 1.0 V present an oxide layer with a thickness of 8, 12 and 15 Å, respectively. After this initial stage, the rate of growth becomes independent of the applied potential, presenting a value of approximately 0.18 nm s−1. Table S1 (see supplementary material) summarizes the optical parameters and thickness obtained for the different experimental conditions.
Potentiostatic electrodeposition
The current-time transients of the MnOx electrodeposition at different applied potentials, for a total charge density of 40 mC cm−2, are shown in Fig. 2.
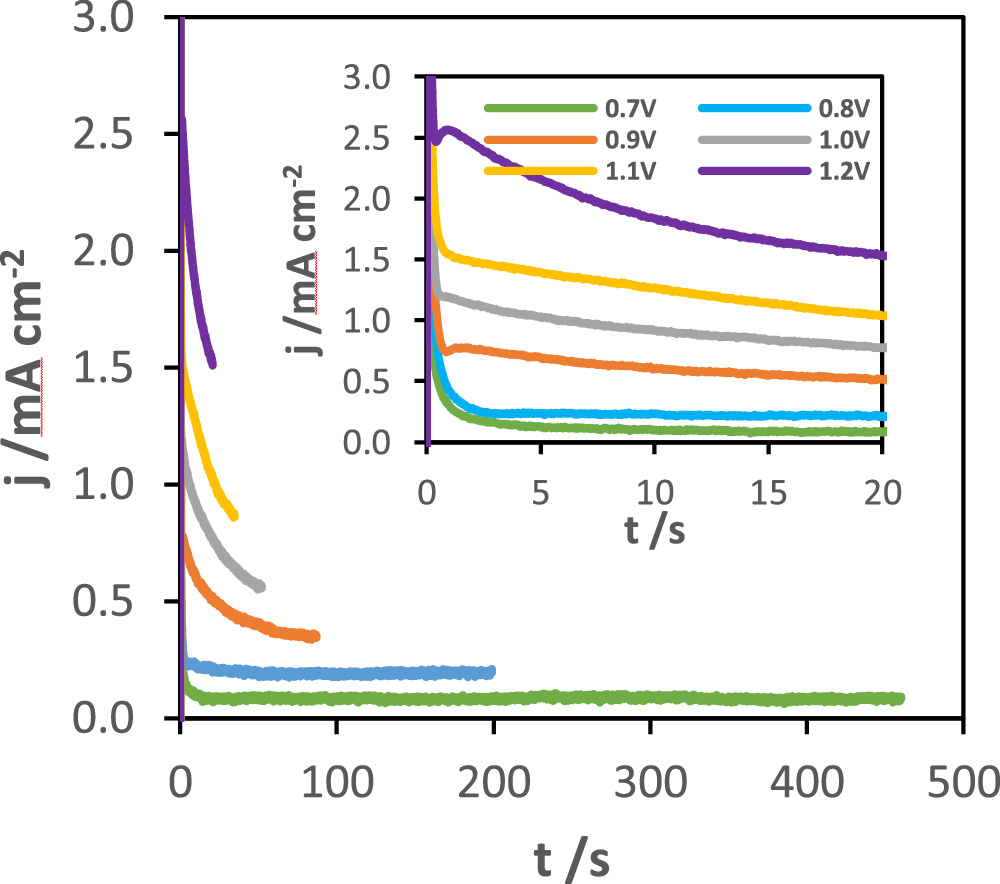
Figure 2. Current-time transients of MnOx synthesis onto stainless steel at different applied potentials (0.7, 0.8, 0.9, 1.0, 1.1 and 1.2 V vs SCE) for a total charge density of 40 mC cm−2 in an aqueous solution of 0.1 M LiClO4 and 0.3 M MnSO4.
Download figure:
Standard image High-resolution imageThe sharp decrease in current at the early stages is due to the formation of the double layer and oxidation of the electroactive species in the solution. After this initial stage, the current evolution evidences a slow decrease, reaching a non-zero limiting value, which is characteristic of a resistive film.
Ellipsometric study
The potentiostatic growth of MnOx was followed by in situ ellipsometry. The measurement started from the ellipsometric parameters — Δ and Ψ — characteristic of bare substrate, which depend on its nature and on the surface condition (polishing degree and presence of contaminants). After the pulse application, their evolution with time began immediately, as shown in Fig. 3, showing that the film formation is also immediate. The faster evolution with increasing the applied potential suggests an increase in the kinetics of the nucleation process. In the case of growths carried out at the lowest potentials — 0.70, 0.75 and 0.80 VSCE — it is possible to identify the formation of a passive layer on the substrate (inset of Fig. 3a), as predicted by the initial characterization of the substrate by ellipsometry, while at higher potentials the passive layer formation it is not observable, possibly due to the lower number of experimental points in the initial stage of synthesis.

Figure 3. Evolution of ellipsometric parameters — phase shift (a) and amplitude (b) — during potentiostatic growth of MnOx at different applied potentials (0.70, 0.75, 0.80, 0.85, 0.90 and 0.95 V vs SCE).
Download figure:
Standard image High-resolution imageAgain, the simulation of the growth of the MnOx films onto stainless steel was performed through the three-phase model (solution, film and substrate), previously described. However, for these films, it was necessary to consider the formation of different homogeneous layers to achieve a reasonable fitting of experimental data. The ellipsometric experimental values and the computationally simulated curves for the potentiostatic growths of MnOx obtained at 0.70, 0.80, 0.90 and 1.00 V vs SCE are shown in Fig. 4. Clearly, modified electrodes are multilayered materials consisting of an inner passive layer (connoted as Lox) and two subsequent layers of manganese oxide (Lin and Lout). Films grown at 0.70 and 0.75 V do not form the outer layer of MnOx.

Figure 4. Experimental values of Ψ and Δ recorded during the potentiostatic synthesis of MnOx at the different applied potentials of 0.7 (a), 0.8 (b), 0.9 (c) and 1.0 (d) V vs SCE and the respective simulated curve assuming the formation of a passive layer on the substrate — red solid line (Lox) — and two distinct homogeneous layers of MnOx — inner layer with green solid line (Lin), and outer with purple solid line (Lout).
Download figure:
Standard image High-resolution imageFigure 5 shows the experimental parameters — refractive index, extinction coefficient and rate of growth — of both MnOx layers, determined from the simulated Ψ vs Δ curves, as a function of the synthesis potential of MnOx films (See Table S2). The increase in the applied potential leads to an increase of the refractive index and rate of growth of both layers, which present a similar evolution of such parameters (Fig. 5a). This suggests a dependency of the structural evolution of the outer layer with the inner one. The increasing film density with increasing synthesis potential can be explained by the formation of a higher number of nuclei with smaller sizes. The inner layer is more compact (higher n) and clearly more resistive (lower k) than the outer one, and presents a decreasing thickness with increasing applied potential (Fig. 5d). The outer layer increases with increasing potential of synthesis. The differences between the two layers, namely the extinction coefficient, are in agreement with the formation of two different layers.
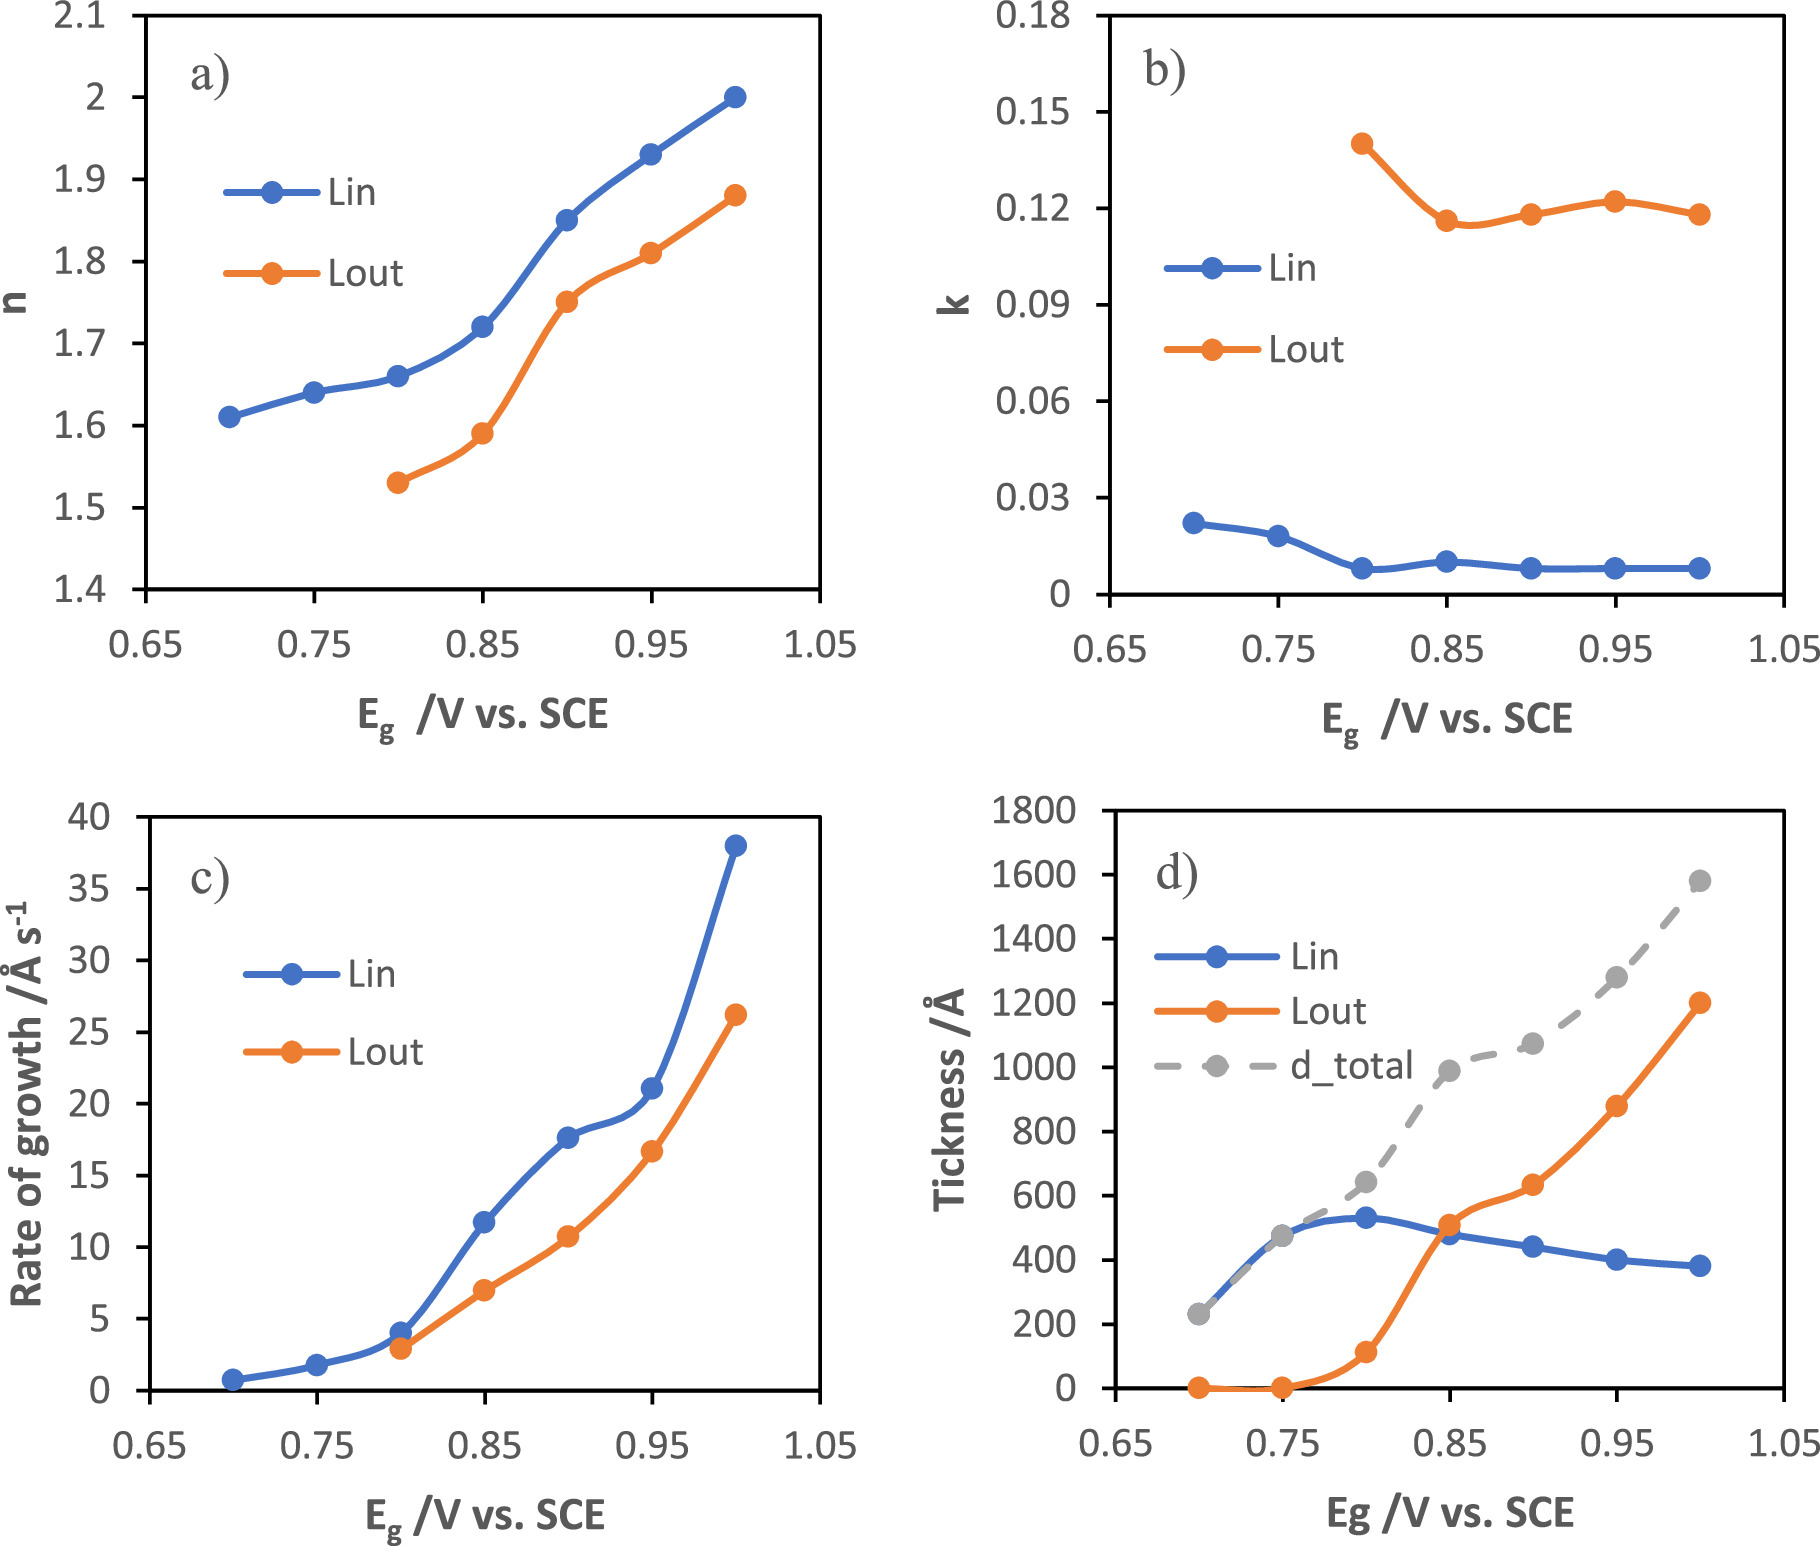
Figure 5. Refractive index (a), extinction coefficient (b,) rate of growth (c), and thickness (d) of both layers of potentiostatically grown MnOx films as a function of the synthesis potential.
Download figure:
Standard image High-resolution image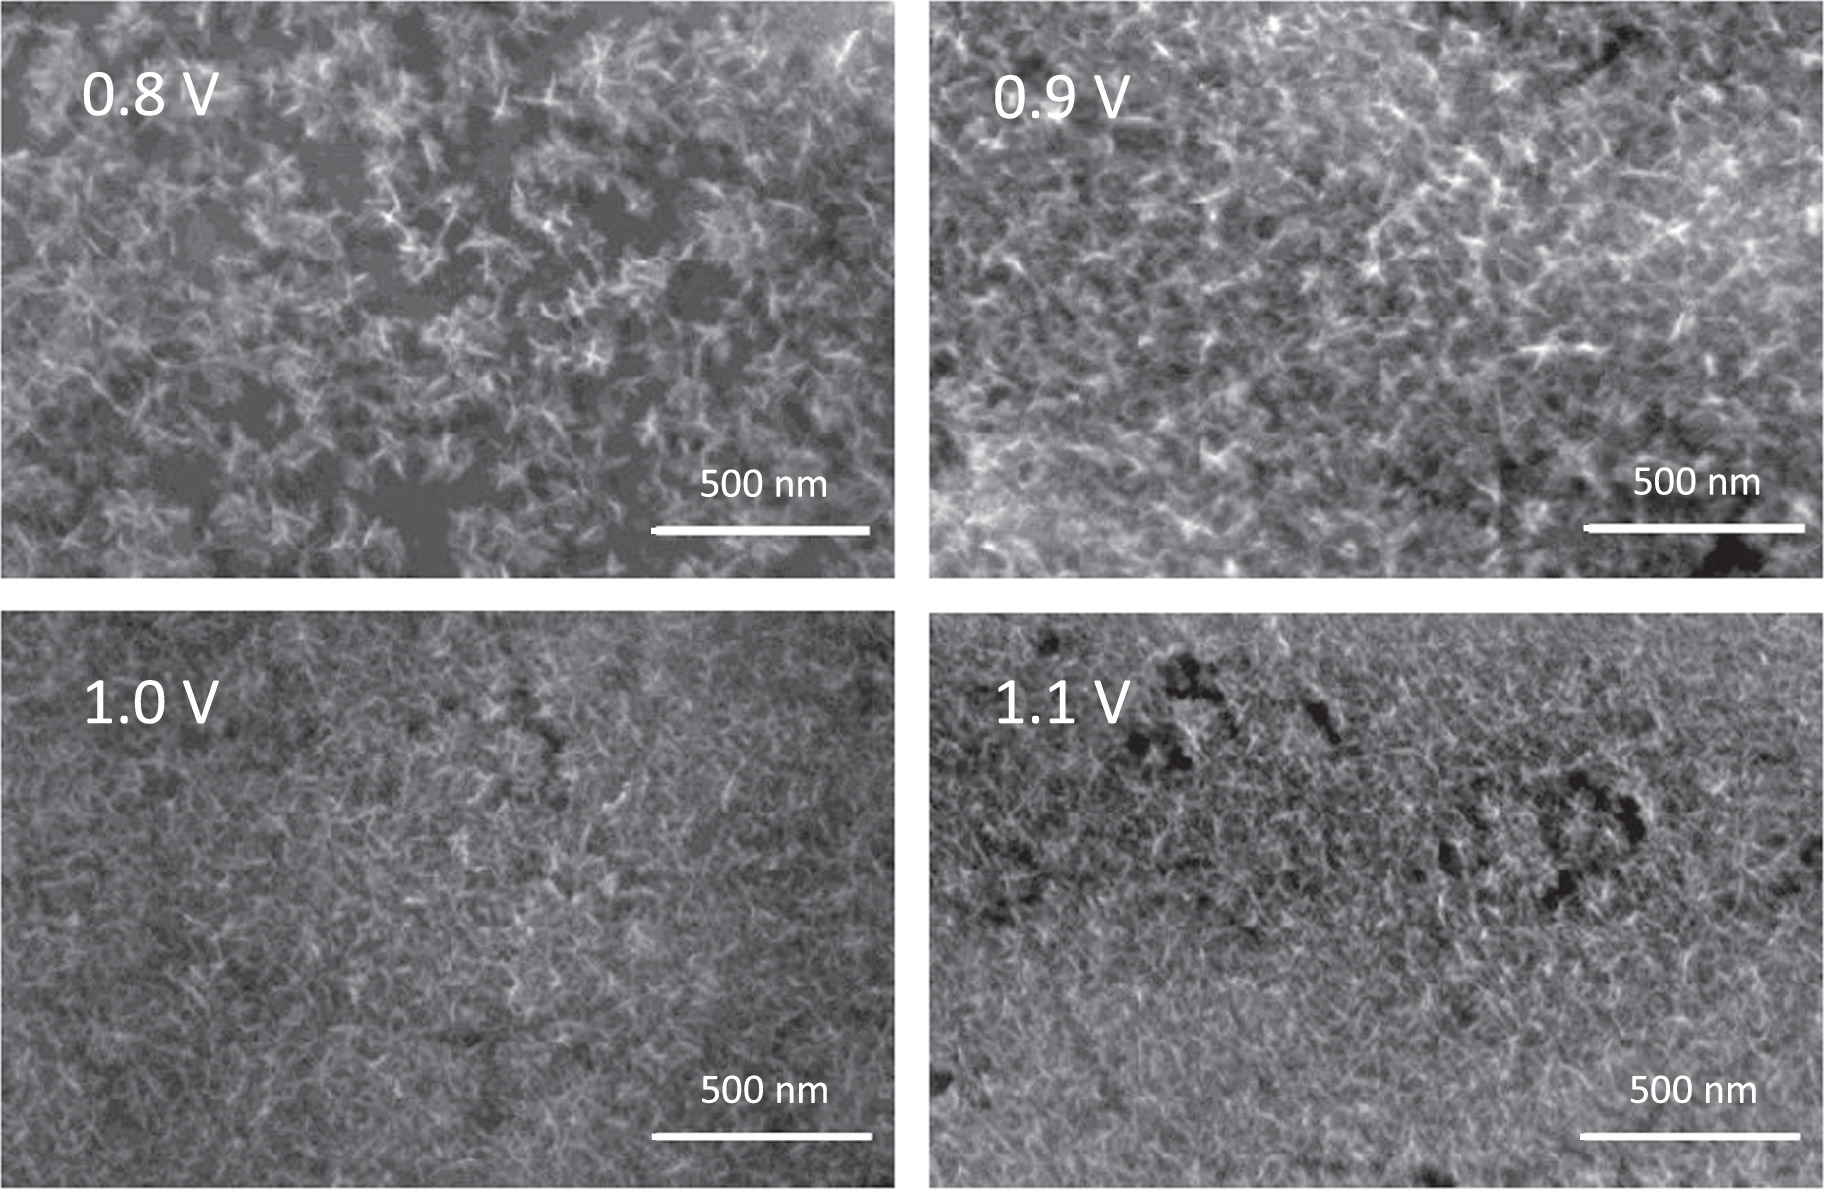
Figure 6. SEM images of the modified electrodes potentiostatically at 0.8, 0.9, 1.0 and 1.1 V vs SCE.
Download figure:
Standard image High-resolution imageSEM characterization
The morphology of the MnOx films grown potentiostatically at 0.8, 0.9, 1.0 and 1.1 V vs SCE was analyzed by scanning electron microscopy (Hitachi SU-70), as shown in Fig. 6. MnOx films present a petal-shaped morphology. This structure, which depends on the synthesis conditions, 11,17 presents reduced electrical resistance that can improve the double-layer capacitance and charge transfer processes, and has a porous architecture that can facilitate electrolyte diffusion into the film matrix. 17 The increase in the applied potential leads to a decrease in the size of nuclei and an increase in their number, which promotes the formation of films with an increasing available area of active material. An increase in the overpotential usually leads to an increase in nuclei density. 18
Electrochemical characterization of the MnOx electrodes
The electrochemical behavior of MnOx films was studied by galvanostatic charge-discharge curves and cyclic voltammetry in a 1 M Na2SO4 electrolyte in a working potential window between 0.0 and 1.0 V vs SCE. The areal capacitance, Ca, was calculated from the galvanostatic discharge curves according to the equation:

where i is the applied current, td is the measured discharge time, A is the geometric area of the film, and ΔE is the potential range during the discharge experiments. For comparative purposes, the specific capacitance was estimated using the Faraday equation, assuming that the electrodeposited films are exclusively constituted by MnO2 and that all electrons were consumed for the formation of the film. It should be noted that these assumptions will lead to an overestimated mass. Films grown for 5, 7, 10, 20, 40, 70 and 100 mC cm−2 will have 2.25, 3.16, 4,51, 9.02, 18.00, 22.5, 31.6 and 45.1 μg respectively.
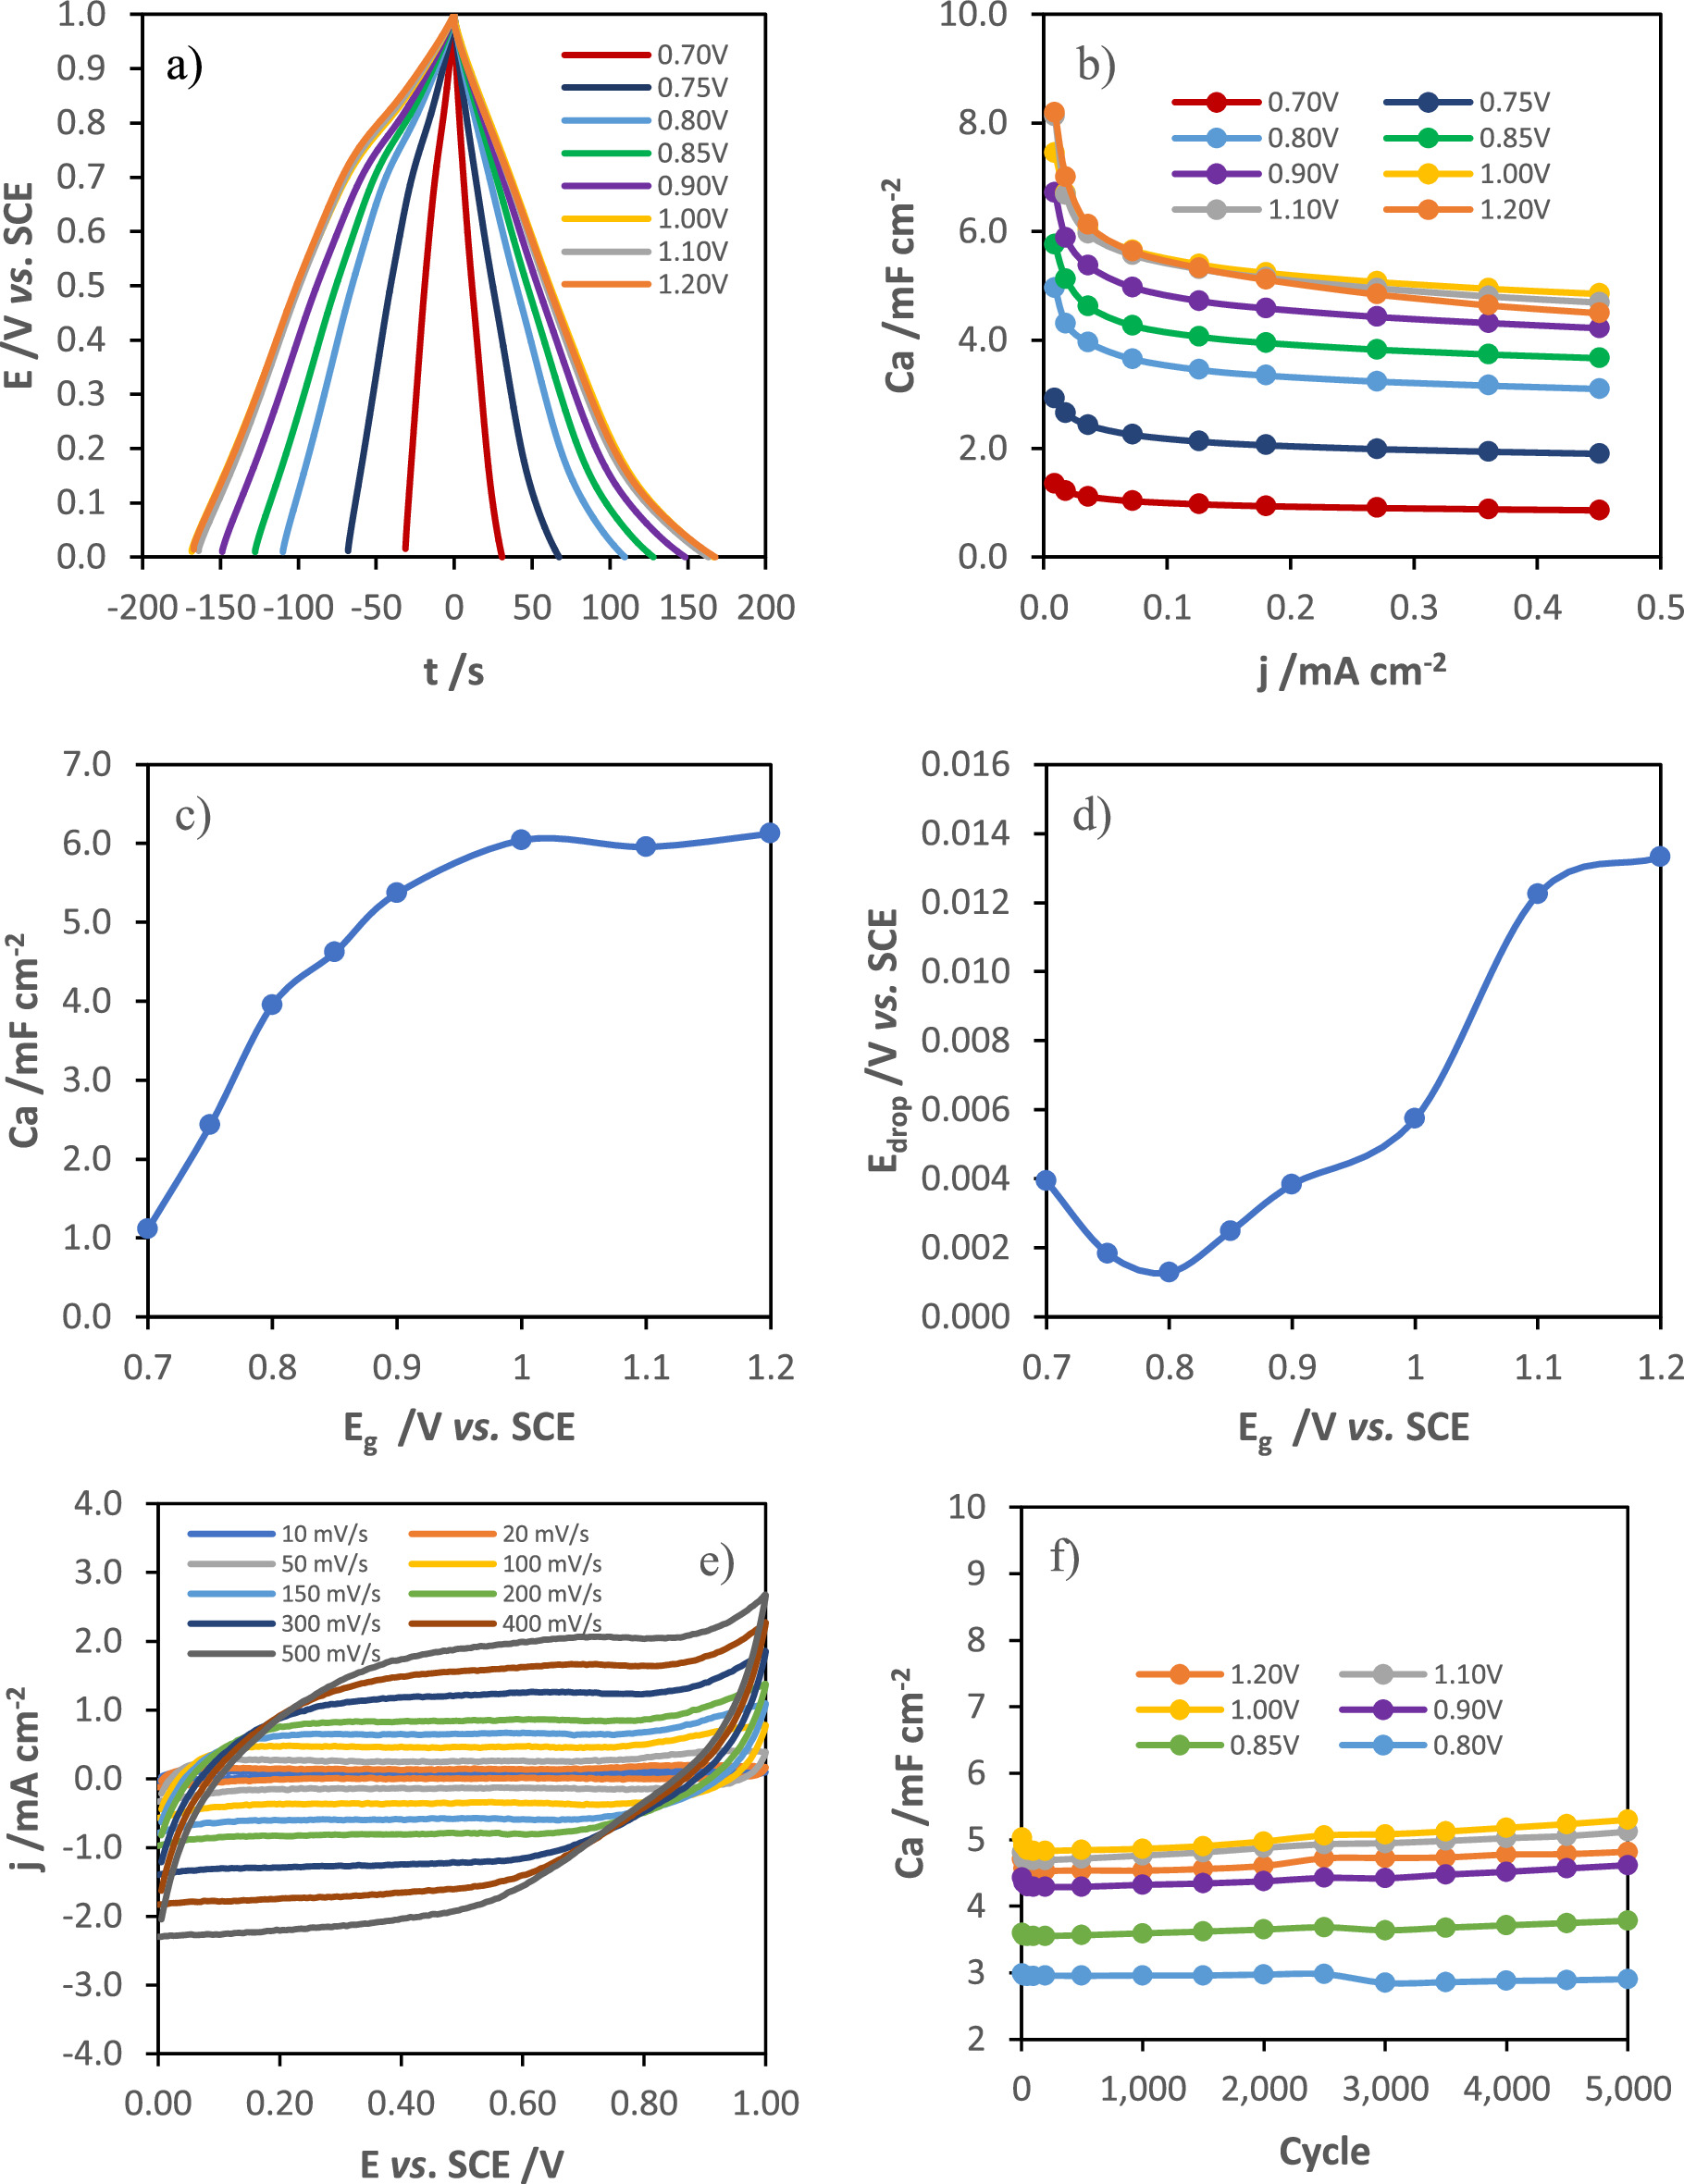
The GCD curves obtained at 36 μΑ cm−2 (2 A g−1) of MnOx films grown at different potential pulses, which are represented in Fig. 7a, show a nearly triangular shape with a low ohmic drop and present a Coulombic efficiency close to 100%. The evolution of the capacitance and ohmic drop with the synthesis potentials are represented in Figs. 7c and 7d, respectively. Increasing the synthesis potential from 0.7 to 1.0 VSCE leads to an increase in the specific capacitance. For potentials greater than 1.0 V the capacitance remains constant. This evolution of the capacitance with the growth potential can be explained by the decrease of the inner MnOx layer thickness and by the increase in the available area of the films grown at higher potential until the increase in the density starts to hinder the ionic diffusion through the film matrix. Electrodes modified at higher potentials (from 1.0 to 1.2 V) present good electrochemical performance, namely an areal capacitance of about 6 mF cm−2 at a current density of 36 μΑ cm−2 (about 330 F g−1 at a specific current of 2 A g−1). However, the increase in the potential pulse promotes the formation of more resistive films (Fig. 7d) with lower capacitance retention (Fig. 7b).
Download figure:
Standard image High-resolution image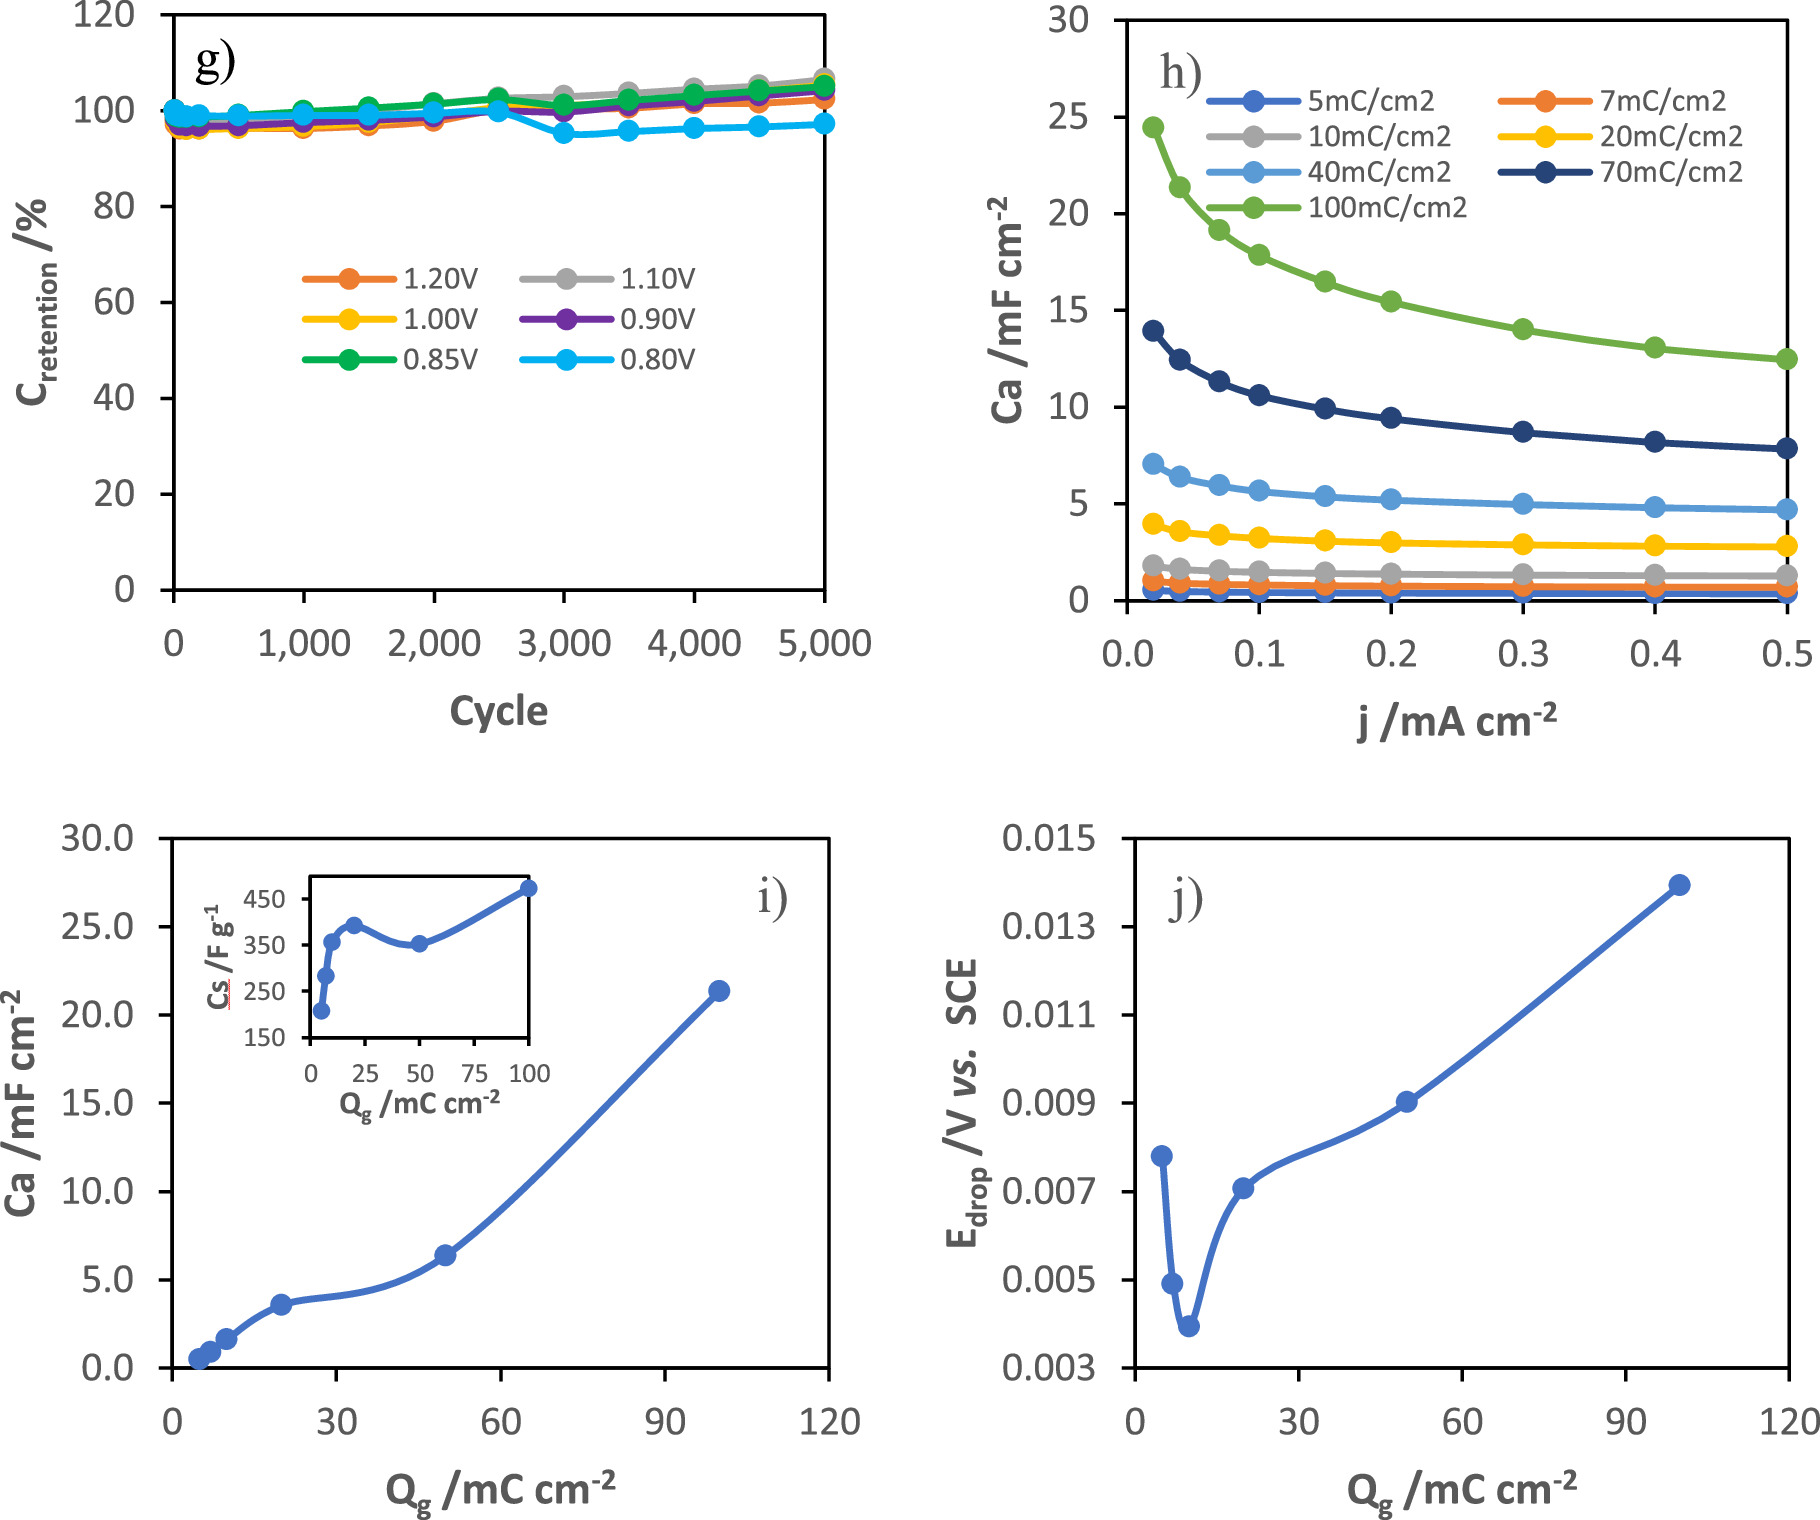
Figure 7. GCD curves at 36 μA cm−2 (2 A g−1) of MnOx electrodes grown at different applied potentials (a), areal capacitance as a function of current density (b), evolution of areal capacitance (c) and ohmic drop (d) with MnOx synthesis potentials, cyclic voltammograms of the modified electrode at 1.0 V vs SCE for different scan rates (from 10 to 500 mV s−1) (e), and evolution of capacitance (f) and capacitance retention (g) with 5000 GCD cycles at 360 μA cm−2 (20 A g−1), variation of areal capacitance (i), specific capacitance (inset of i) and ohmic drop (j), at a current density of 40 μA cm−2, with the charge of synthesis of films grown at 1.0 VSCE.
Download figure:
Standard image High-resolution imageThe cyclic voltammograms at different scan rates (from 10 to 500 mV s−1) of the MnOx film grown at 1.0 V vs SCE for 40 mC cm−2, shown in Fig. 7e, present an almost rectangular shape, even at high scan rates, indicating a very good pseudocapacitive behavior and high reversibility during charge and discharge.
In terms of rate capability, all the electrodes showed excellent performance, presenting a small increase in the areal capacitance after 5000 GCD cycles at an applied current of 360 μΑ cm−2 (20 A g−1), as shown in Fig. 7f. The capacitance retention of the MnOx films was not affected by the potential of growth.
Afterwards, the electrochemical response of MnOx films grown at 1.0 V for different charge of synthesis (5, 7, 10, 20, 50 and 100 mC cm−2) was studied. Figure 7h presents the areal capacitance as a function of the discharge current for the different modified electrodes. According to the results obtained by ellipsometry, the transition between the formation of the inner and the outer MnOx layer of the film grown at 1.0 VSCE occurs around 10 and 15 mC cm−2 of synthesis charge. The evolution of capacitance (Fig. 7i) and ohmic drop (Fig. 7j), at a current density of 40 μA cm−2, with the charge of synthesis presents two different regions with the transition between those at around 10 and 15 mC cm−2 of synthesis charge. Initially, the increase in capacitance is associated with the formation of MnOx crystallites, which being more conductive than the native oxide layer, lead to a decrease in the ohmic drop. From 20 mC cm−2, the ohmic drop starts to increase and the specific capacitance reaches a maximum (inset of Fig. 7i), which can be explained by the increase in the film density during the transition between the formation of the first and second layer, due to preferential lateral growth of crystallites. Then, the film evolves with a petal-shaped morphology, as shown in SEM images, leading to the formation of the outer layer.
EIS characterization
After electrodeposition, the modified electrodes were analyzed by electrochemical impedance spectroscopy in a 1 M Na2SO4 electrolyte.
The electrical equivalent model used to interpret the EIS data (shown in Fig. 8c) was based on the ellipsometric results assuming that MnOx films are composed of two distinct layers: a more compact and resistive inner layer, and a porous and more conductive outer layer. The stainless-steel passive layer is considered to be part of the inner MnOx layer as it is a very thin and compact film and is equally resistive. In this model, Rp,out and CPEdl,out are the electrolyte resistance inside the pores and the capacitive behavior of the MnOx outer layer, respectively, whereas Rct,in represents the charge transfer resistance of redox processes within the pores and CPEin is associated with the capacitive response of the inner layer. The Nyquist diagrams of the potentiostatically modified electrodes at different applied potentials (0.8, 0.9, 1.0, 1.1 and 1.2 VSCE), for 40 mC cm−2, and for different charges of synthesis (5, 7, 10, 20, 50 and 100 mC cm−2), at 1.0 V vs SCE, are represented in Figs. 8a and 8b, respectively.
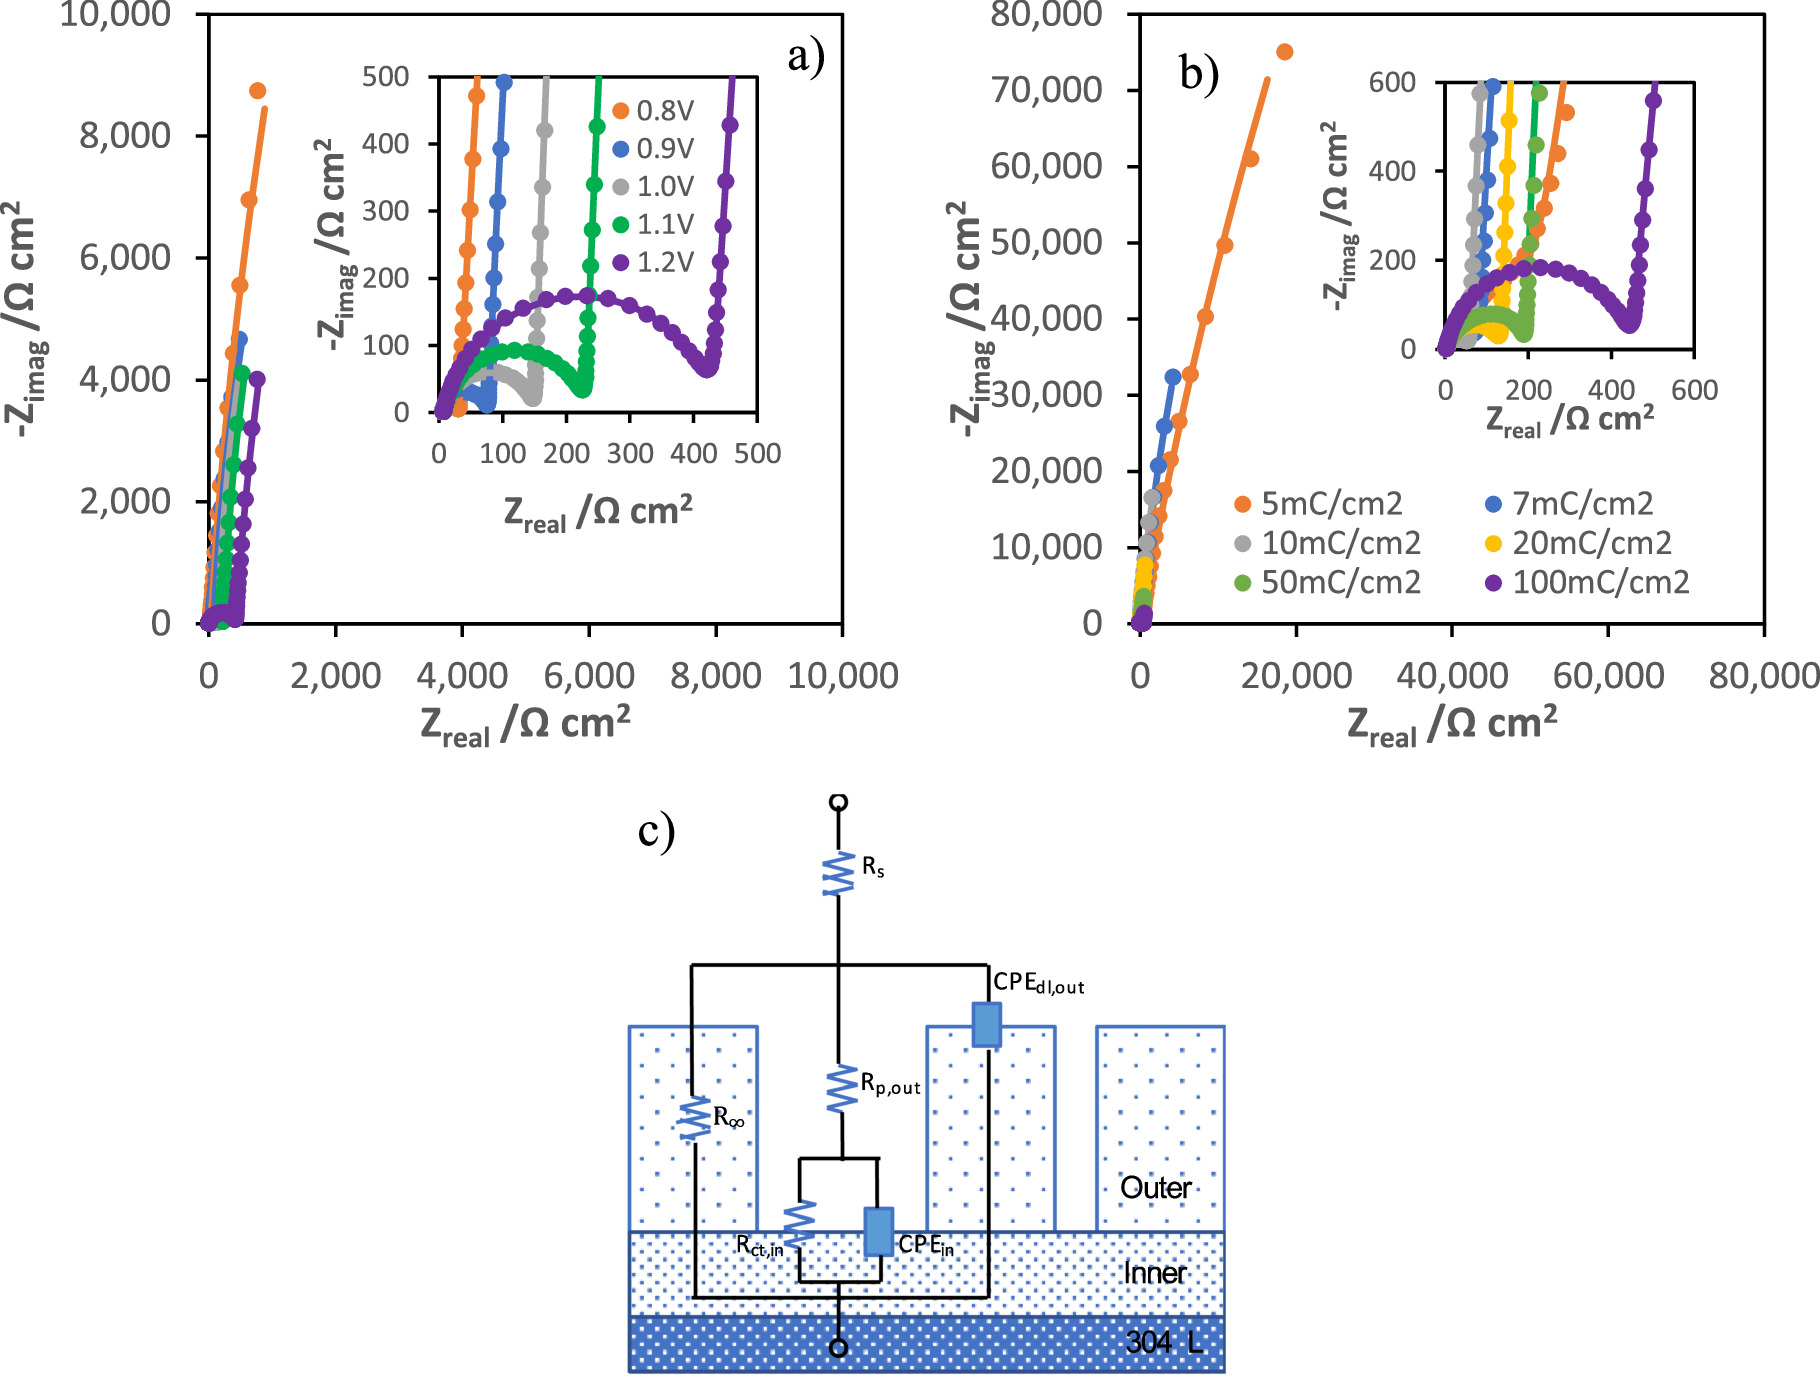
Figure 8. Nyquist diagrams of potentiostatically modified electrodes after their synthesis at 0.8, 0.9, 1.0, 1.1 and 1.2 V vs SCE (a) and for different charges of synthesis (5, 7, 10, 20, 50 and 100 mC cm−2) at 1.0 VSCE (b), and the electrical equivalent circuit used to fit the experimental data (c).
Download figure:
Standard image High-resolution imageThe impedance spectra present a depressed semi-circle at high frequencies that is followed by an almost vertical capacitive line at low frequencies. Tables I and II present the electrical parameters obtained by fitting of impedance spectra of different samples modified at different potentials and for different stages of growth, at 1.0 V vs SCE, respectively.
Table I. Summary of electrical parameters obtained by fitting of impedance spectra in Fig. 8a.
| Eg/VSCE | RS/Ω cm2 | Ydl,out/Ω−1 sn cm−2 | ndl,out | Rp,out/Ω cm2 | Yin/Ω−1 sn cm−2 | nin | Rct,in/Ω cm2 | χ2 |
|---|---|---|---|---|---|---|---|---|
| 0.70 | 6.01 | 4.07E-05 | 0.835 | 71.32 | 5.53E-04 | 0.935 | 229780 | 4.38E-05 |
| 0.75 | 6.17 | 3.66E-05 | 0.851 | 36.19 | 1.26E-03 | 0.954 | 175410 | 5.89E-05 |
| 0.80 | 6.67 | 3.19E-05 | 0.862 | 25.93 | 1.66E-03 | 0.967 | 193310 | 5.10E-05 |
| 0.85 | 6.43 | 2.98E-05 | 0.872 | 67.63 | 2.63E-03 | 0.971 | 130350 | 6.32E-05 |
| 0.90 | 6.44 | 3.12E-05 | 0.869 | 72.62 | 3.15E-03 | 0.973 | 89354 | 5.46E-05 |
| 1.00 | 7.08 | 2.98E-05 | 0.871 | 146.1 | 3.72E-03 | 0.982 | 82724 | 5.46E-05 |
| 1.10 | 8.01 | 3.18E-05 | 0.862 | 226 | 3.64E-03 | 0.977 | 93314 | 5.12E-05 |
| 1.20 | 7.87 | 2.80E-05 | 0.863 | 428.7 | 3.60E-03 | 0.963 | 130100 | 7.25E-05 |
Table II. Summary of electrical parameters obtained by fitting of impedance spectra in Fig. 8b.
| Qg/mC cm−2 | Rs/Ω cm2 | Ydl,out/Ω−1 sn cm−2 | ndl,out | Rp,out/Ω cm2 | Yin/Ω−1 sn cm−2 | nin | Rct,in/Ω cm2 | χ2 |
|---|---|---|---|---|---|---|---|---|
| 5 | 5.56 | 5.26E-05 | 0.826 | 367.6 | 1.08E-04 | 0.931 | 1.48E+06 | 4.71E-04 |
| 7 | 6.94 | 6.46E-05 | 0.811 | 89.81 | 3.78E-04 | 0.979 | 8.02E+05 | 1.94E-04 |
| 10 | 5.98 | 6.13E-05 | 0.818 | 59.75 | 8.26E-04 | 0.979 | 4.69E+05 | 4.46E-05 |
| 20 | 6.66 | 3.94E-05 | 0.867 | 134.8 | 1.91E-03 | 0.978 | 2.04E+05 | 3.45E-05 |
| 50 | 7.98 | 3.83E-05 | 0.872 | 192.7 | 3.37E-03 | 0.976 | 1.20E+05 | 3.08E-05 |
| 100 | 6.52 | 4.05E-05 | 0.872 | 449.3 | 1.02E-02 | 0.945 | 6.90E+04 | 4.99E-05 |
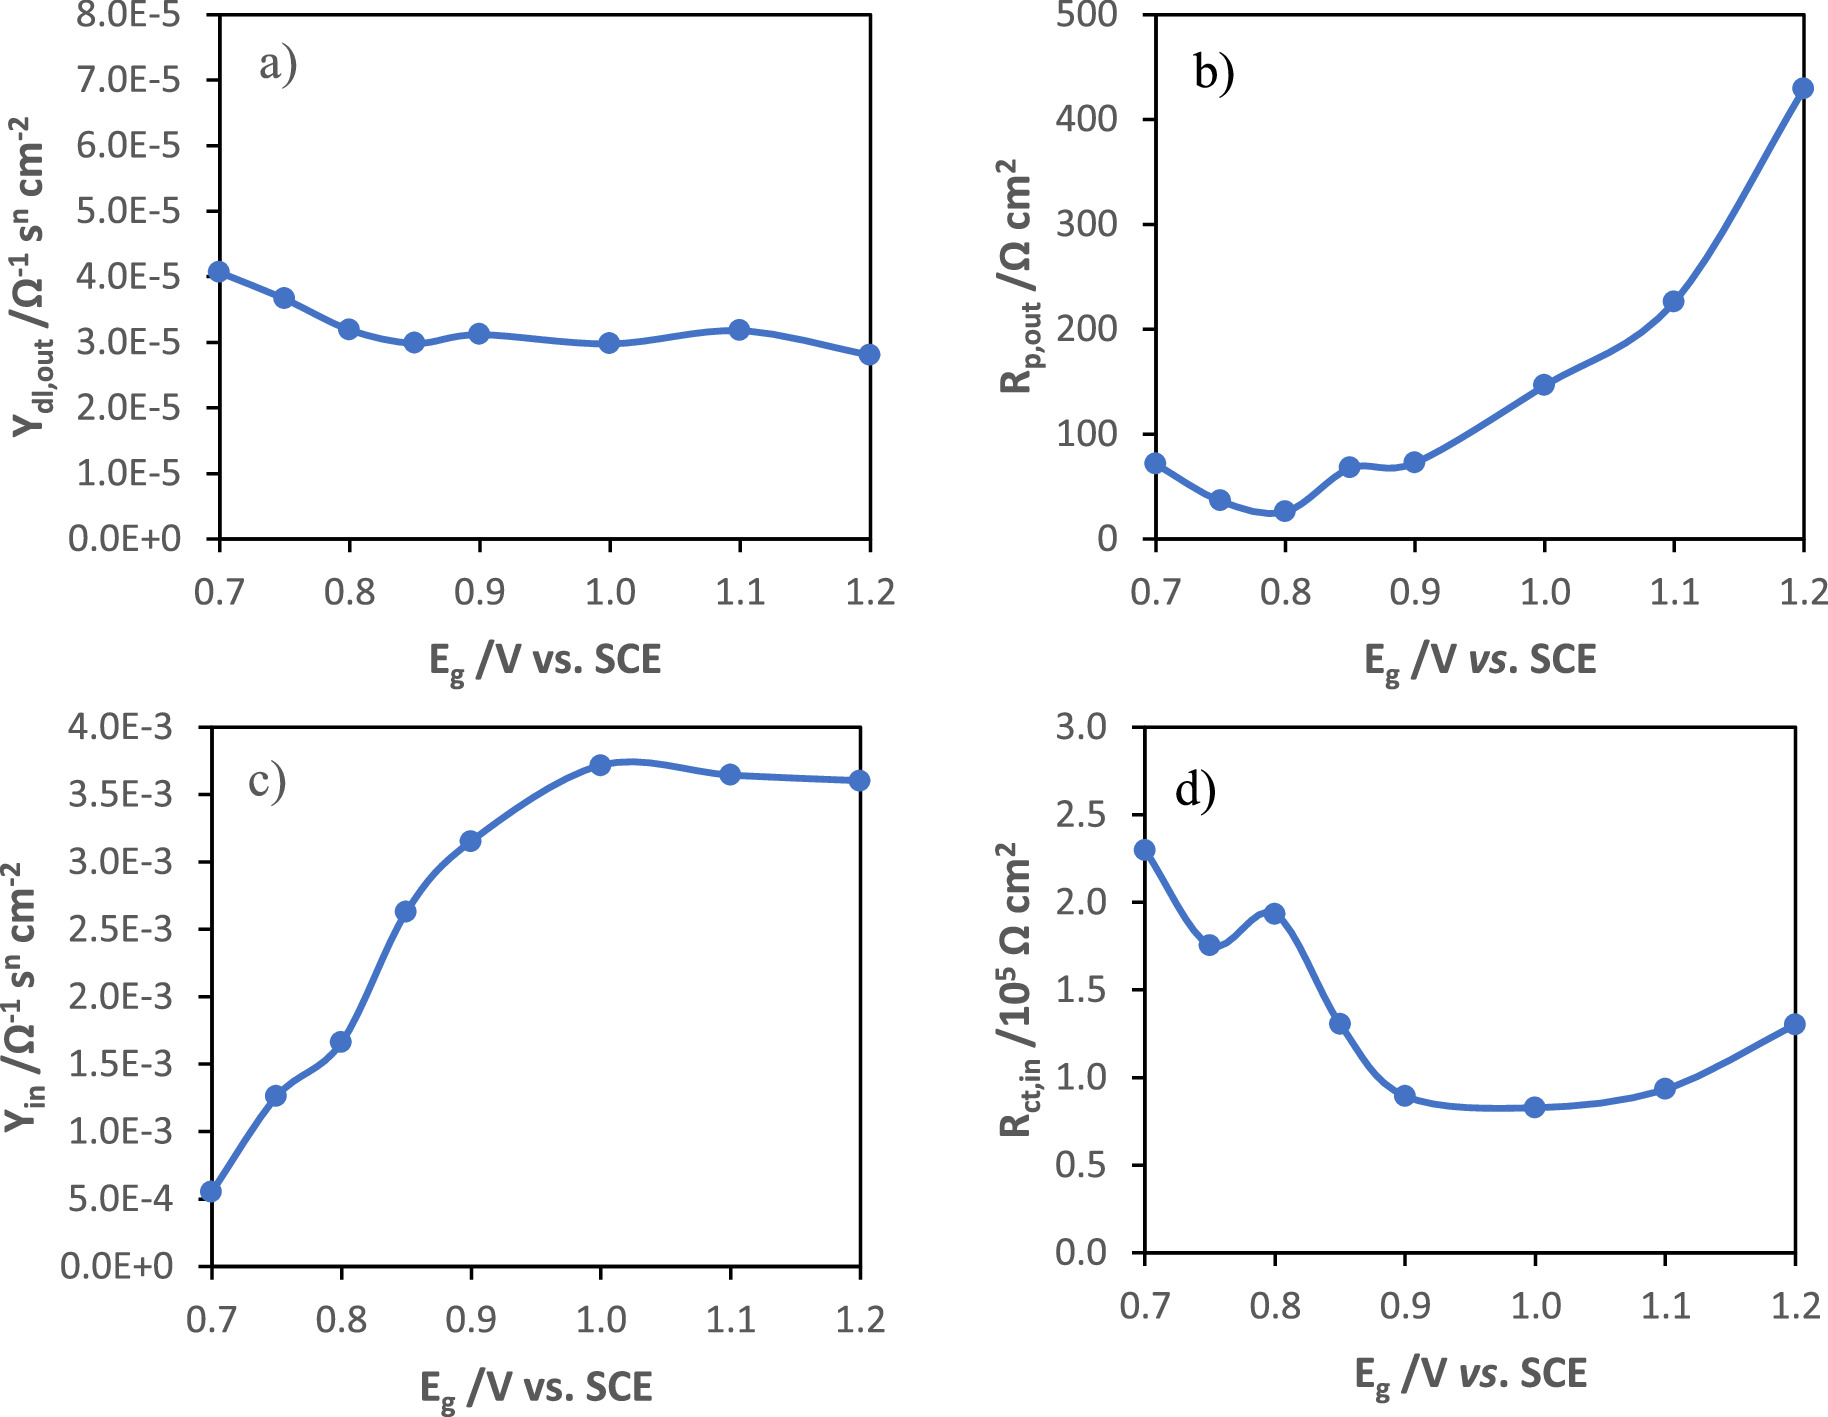
Figure 9 presents the fitting parameters of impedance data from manganese oxide films as a function of the growth potential, and as a function of the charge of synthesis. In the case of growth potential study, the increase in Rp,out (Fig. 9b) with the increase in the potential presents a similar trend with the variation of the ohmic drop (Fig. 7d) suggesting the formation of thicker and less porous films, which difficult the diffusion of electrolyte into the film bulk. The capacitance is directly proportional to the admittance determined for the constant phase element, according to the Brug equation. 19
Download figure:
Standard image High-resolution image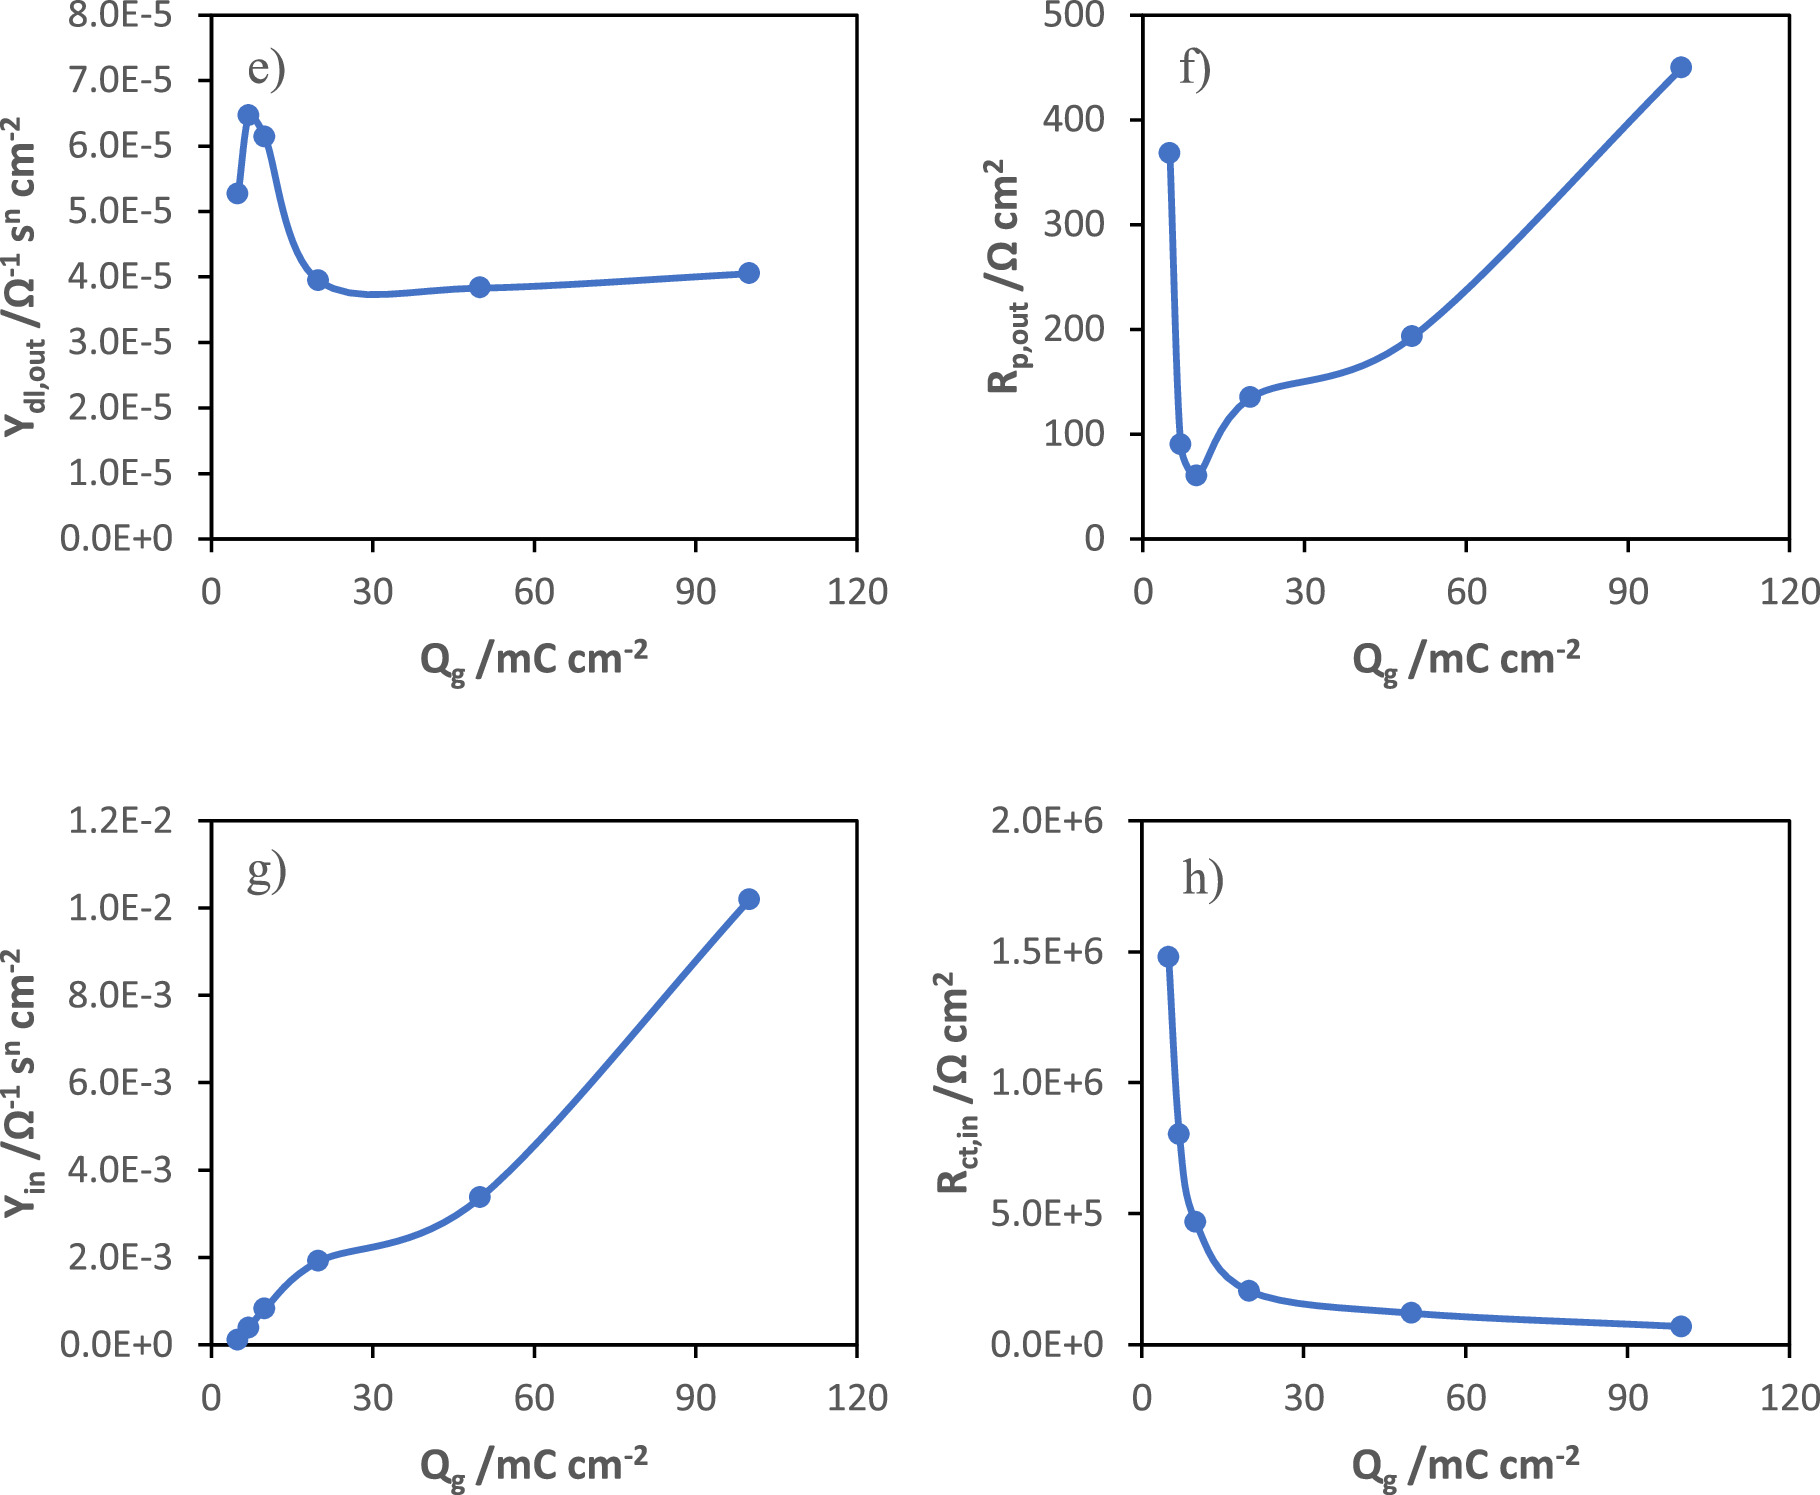
Figure 9. Fitting parameters of impedance data from manganese oxide films as a function of synthesis potential and as a function of the charge of synthesis.
Download figure:
Standard image High-resolution image
The capacitance of the double layer practically does not vary with the increase in the synthesis potential (Fig. 9a) because although the surface area increases, the pore resistance also increases.
As can be seen by the variation of Yin, shown in Fig. 9c, which has a strong correlation with the evolution of capacitance obtained by the GCD tests (Fig. 7c), and taking into account that the capacity is inversely proportional to the layer thickness (C = εε0 /l), the capacitive behavior of these materials is determined by the inner layer, which decreased in thickness with the increase in the growth potential, as observed in the in situ ellipsometry results, as well as a decrease in its resistivity, which is shown in Fig. 9d.
In the case of the growth study at 1.0 V vs SCE for different charges of synthesis, the double layer capacitance decreases at the beginning of the outer layer formation and after 20 mC cm−2 becomes constant. The pore resistance decreases during the formation of the first nuclei, up to about 10 mC cm−2, and then starts to increase as the outer layer thickness increases (Fig. 9f). Once again, the pore resistance variation showed a great similarity with the ohmic drop evolution with the charge of synthesis, obtained in GCD tests (Fig. 7j). The capacitance of the inner layer increases as the film evolves (Fig. 9g) and presents two regions. The resistance of the inner layer decreases sharply at the beginning until it converges to a minimum value, as seen in Fig. 9h, which may be due to the initial formation of a more conductive film than the oxide layer on the substrate and to the possible continuous conversion of the more resistive MnOOH into MnO2. The capacitance evolution with the charge of synthesis also presents a trend similar to that of the capacitance determined from the discharge curves (Fig. 7i).
These results are in agreement with those obtained through the characterization by in situ ellipsometry and GCD analysis. The capacitance variation as a function of the synthesis potential follows the same trend as the capacitance calculated from the impedance data. The increase in capacitance may be due to an increase in the number of nuclei with smaller size and a decrease in the thickness of the inner layer of manganese oxide. The ohmic drop is related to the resistance in the pores of the outer layer of MnOx. Its increase is explained by the increase in the density and thickness of the outer layer, which hinders the diffusion of ions through the film matrix.
Conclusions
This work combines an original in situ ellipsometry study with a detailed electrochemical characterization to investigate how the growth potential and the stage of growth affects the structural changes and pseudocapacitive response of manganese oxide films electrodeposited on stainless steel 304. In-situ ellipsometry evidences that the electrodes are formed by 3 layers: a layer of stainless steel native oxide, and two layers of MnOx. The inner layer of MnOx is slightly denser (higher n) and more resistive (lower k) than the outer one. The rate of growth and density of both layers increases with the increase in the growth potential and present the same trend, showing the dependence of the outer layer on the inner one.
The increase in the growth potential leads to the formation of manganese oxide films with higher specific capacitance and higher resistivity. The increase in capacitance is due to the increase in the available area of active material and a decrease in the thickness of the inner layer. The increase in resistivity is related to the increase in density and thickness of the outer layer, which hinders the diffusion of ions through the film. The highest specific capacitance obtained for these electrodes was approximately 6 mF cm−2 at a current density of 36 μΑ cm−2 (about 330 F g−1 at a specific current of 2 A g−1). All electrodes revealed a very stable electrochemical performance under a 5000 cycles charge-discharge test and evidenced a retention of capacitance above 100%.
Acknowledgments
The authors acknowledge Centro de Química Estrutural Research Unit funding by Fundação para a Ciência e Tecnologia (FCT): projects UIDB/00100/2020 and UIDP/00100/2020, LA/P/0056/2020, PTDC/QUI-ELT/2075/2020. The authors also acknowledge the financial support from Baterias 2030 project, with the reference LISBOA-01–0247-FEDER-046109, co-funded by Operational Program for Competitiveness and Internationalization (COMPETE 2020), under the Portugal 2020 Partnership Agreement, through the European Regional Development Fund (ERDF). RS thanks the LLESA Project with the reference 1018 P.05439.1.01. Dr. Jorge P. Correia from the Department of Chemistry and Biochemistry, Faculty of Sciences of the University of Lisbon, is gratefully acknowledged for graciously allowing the use of the monochromatic ellipsometer and its electrochemical cell.
Supplementary data (0.2 MB PDF)