

Abstract
The sensitivity and selectivity of potentiometric sensors towards their targets in various matrices have been challenging for analysts since their development. Modifications of the sensor composition provide the sensitivity and selectivity of potentiometric sensors towards their targets in various matrices have been challenging for analysts since their development. Modifications of the sensor composition provide a way to achieve the utmost sensitivity and selectivity. Molecular imprinting, together with conducting polymers and graphite derivatives, represents a robust composite that attains better sensor performance. Besides, the miniaturization of potentiometric sensors is advantageous to the sensitivity and greenness of the developed sensors due to their smaller portable size, lower sample volume, and lower waste. These advantages provide these sensors with a fast track toward developing wearable versions of ion-selective sensors, which are valuable in point-of-care services in different clinical settings. Here, we report on the first recyclable on-chip miniaturized potentiometric sensors integrated by a printed Ag/AgCl quasi-reference electrode for the quantitation of milnacipran hydrochloride (MLN) in its dosage form and human plasma in the presence of its impurities. The sensing module of the sensor is modified by a molecularly imprinted conducting polymer (polyaniline), which is computationally optimized to achieve maximum selectivity towards MLN in the presence of its impurities. Moreover, the designated sensor composition is optimized by a self-validated ensemble modeling experimental design seeking the composition leading to optimal sensor performance. The proposed on-chip sensor successfully achieved a LOD value of (7.94 × 10⁻⁷ M) and a linear range of (1 × 10⁻⁶ − 1 × 10⁻² M) with a green analytical profile as redeemed from the Agree assessment score.
Export citation and abstract BibTeX RIS
Miniaturization in analytical chemistry systems is the reduction of the instrumentation required for chemical and/or biological analysis. The step of miniaturization comes with a wide array of advantages. First, the fabrication of these systems consumes fewer materials and solvents, which has a lower environmental impact and a sustainable analytical profile. 1 Moreover, these systems enable the analysis of small-volume samples, which is economically wise and offers higher throughput in analysis. Miniaturization makes it possible to develop advanced portable and wearable analytical devices. 2 These devices can be applied in different fields, such as environmental monitoring, drug plasma level monitoring in various clinical settings, and other biotechnological and medical applications. 3
All solid-state electrodes replace the internal solution with a wide range of transducing materials, such as graphite (G) and its various derivatives as graphene oxide (GO) or functionalized graphite. 4 These transducers made designing more compact and portable sensors possible as a foremost step through their miniaturization and automation. Expanded graphite (EXG) is an engaging carbon-based transducer holding many astonishing technical characteristics alongside its easier and greener synthetic pathways making this transducer a more environment-friendly and cost-effective replacement to other transducers that are commercially available at a higher cost or require harsh conditions during their synthesis. 5,6 EXG has tremendous advantages as; being more hydrophilic in comparison to graphite due to its additional superficial oxygen groups, having a higher specific surface area (90 m2/gm) than graphite (12.1 m2 gm−1), 7 having a porous structure which enhances its diffusivity for the target ions and being a super transducer due to its superior conductivity and capacitance. 8
Besides, the incorporation of conducting polymers in the composition of the solid-state transducer composition aids in enhancing sensor sensitivity. 9 Polyaniline (PANI) is an example of a conjugated conducting polymer that converts the target ions' chemical concentration into electrical signals, enhancing sensor sensitivity. 10 PANI, like any organic polymer, has limited electrical conductivity, but upon doping PANI with metals, further enhancement in the conductivity is noticed. Ag-PANI Nano-metals are of high conductance when compared to the un-doped PANI, and their conductance is proportional to the ratio of the doping metal. 11
Molecular imprinting (MIP) is also another interesting technique to enhance electrochemical sensors' selectivity. The polymers designated for MIP are specially tailored to fit the geometry of a specific target in a way mimicking the enzymes in selecting their substrates. 12 Optimization of the synthesis conditions for the MIP particles by computational methods proved cost-effective and eco-friendly. 13 A combination of molecular dynamics (MD), docking, and quantum mechanical calculations (QM) are co-operated to tell the best conditions for MIP synthesis to guarantee a final selective product. Moreover, integrating MIP technology in synthesizing conducting polymers hits more than one goal at a time. 14 Designing a MIP based on Ag-PANI particles has the advantages of being both conductive and selective towards the target ion.
Self-validated ensemble modeling (SVEM) provides an experimental design methodology that performs process optimizations resulting in models capable of out-of-sample data predictions due to its reliance on machine learning algorithms when compared with the conventional design of experiment (DOE) techniques. 13,15
Milnacipran hydrochloride (MLN) is a group member of the selective serotonin and norepinephrine reuptake inhibitors used to manage depression and fibromyalgia, which is a widespread painful condition affecting muscles, digestive system, cognitive effects, and sleep. MLN can be used alone or in combination with mirtazapine (MTZ) to synergies the extracellular serotonergic and norepinephrine levels elevation. 16 Phthalimide (PTD) and benzyl cyanide (BCN) are identified as impurities B and E for MLN in the European pharmacopeia, Their existence in dosage form should be monitored as specified by the pharmacopeia. 17,18 MLN quantitative determination in its dosage form was reported utilizing different analytical and stability-indicating techniques such as UV spectroscopic and fluorimetric methods, 19,20 LC/MS, 21 HPTLC, 22 and electrochemical methods. 23,24 None of these reported methods presented an efficiently miniaturized green analytical methodology for quantifying MLN in various matrices.
Here, we report on novel miniaturized printed sensors integrated by printed quasi-reference electrodes for the quantitation of MLN in both dosage form and human plasma in the presence of its impurities (PTD and BCN). The Agree assessment protocol assessed the proposed sensor greenness and was statistically compared against the reported method revealing no statistically significant difference.
Experimental
Materials and reagents
Silver nitrate (AgNO3) and o-nitrophenyl octyl ether (NOPE) were obtained from Alfa Aesar (Germany). Ethylene glycol (EG) was purchased from Advent Chembio Private Limited (India). Polyvinylpyrrolidone (PVP, K30), ammonium persulfate ((NH4)2S2O8) (98%) for synthesis, and Tetrahydrofuran were purchased from Loba Chemie (India). Ethanol and methanol (HPLC grade) were obtained from Thermo scientific chemicals (Germany). Sodium hypochlorite (NaOCl, 5%) was obtained from Dixie Chemical (USA). Phosphoric acid, sulphuric (H2SO4, assay 98% and 0.001% Cl−), boric acid, and acetic acid were purchased from El-Nasr pharmaceutical chemicals Co. (Egypt). Acetone of analytical grade was obtained from Labor (India). Carbon tetrachloride was purchased from El Salam Chemicals (Egypt). Diethyl ether was purchased from Fine-chem Limited (India). Aniline for synthesis was obtained from Adwic (Egypt). Water LC/MS grade was purchased from Sigma Aldrich (LiChrosolv®, USA). Carbon paste powder (150 mesh) was purchased from El-Goumhouria Co. (Cairo, Egypt). Milnacipran hydrochloride (MLN) was granted by Mash Premier (Badr City, Egypt). Phthalimide (PTD), benzyl cyanide (BCN), Sodium tetraphenylborate (Na-TPB), and polyvinyl chloride (PVC) were purchased from alpha chemical (India).
Apparatus
An Elma sonicator (Germany), VWR vortex mixer, and TOPTION overhead stirrer (China) were utilized to assist in solubilizing active solutes and preparing the proposed sensors' ink. UV spectrophotometer Jasco (Japan) was used through all spectral scanning activities. Centurion scientific cooling centrifuge was involved in separating and preparing synthesized particles. All pH adjustments were performed by an Adwa pH meter (Romania). A microwave oven generating 2.5 MHz irradiation was utilized in the microwave-assisted synthesis of EXG. Jenway potentiometer was used to collect reads of pH and sensor responses. An oven (Simpson, USA) was used to dry the synthesized particles. Hanna commercial Ag/AgCl double-junction reference electrode was utilized in some potentiometric measurements.
Software
The molecular operating environment 2015 (MOE) was utilized to perform molecular docking and dynamic simulations. ORCA 5.0.4 was utilized to conduct structural optimizations and binding energy calculations. Avogadro 1.2.0 and GauessView 6.0 were used to visualize DFT calculation output files. Microsoft Excel 2010 was employed in MD data analysis. Origin pro-2018 was engaged in the graphical presentation of raw data. Minitab 19 was utilized to perform statistical manipulations of the experimentally obtained data. JMP Pro 16 was employed in building experimental designs to optimize the proposed sensor's performance through its composition based on a self-validated ensemble modeling approach.
Stock solutions & ion associate preparations
MLN stock solution was prepared by accurately weighing and quantitatively transferring 282.281 mg of standard MLN to a 100 ml volumetric flask containing 70 ml of deionized water buffered by Britton Robinson (BR) buffer (pH = 5). The solution was shaken for 5 min under vortex and sonicated for an additional 15 min till the complete dissolution of the solute. Finally, the flask was completed to 100 ml using the same diluent. The (MLN-TPB) ion associate was prepared by admixing similar amounts of equimolar solutions (1 × 10⁻² M) of both MLN and Na-TPB. The formed precipitate was collected by centrifugation at 10000 rpm for 15 min The supernatant was decanted and replaced by double distilled water; then, the vortex re-dispersed the precipitate. The previous procedure was repeated several cycles till complete clearance of the supernatant from free MLN as depicted by the flattening of its UV spectral band.
Procedures
Microwave-assisted synthesis of EXG
The expanded graphite (EXG) was synthesized after modifications on the following reported scheme. 25 Briefly, 6 ml of concentrated H2SO4 (98%) was mixed with 10 gm of (NH4)2S2O8 in a sealed 50 ml beaker and was subjected to low power sonication for 5 min till a homogenous slurry was formed. A 2 gm of G was added to the slurry and mixed gently under an overhead agitator for 5 min at room temperature till reaching the desired consistency and the formation of intercalation graphite (IG). The resulting IG compound was partially decomposed by exposure to 2.5 MHz microwave irradiation for 60 s till the worm-like flakes appeared, and the EXG was formed. The EXG product was then left to cool down for an additional 60 s and was stored in a rubber-sealed glass vial.
Computer-assisted design and preparation of PANI imprinted polymer
The PANI particles were synthesized utilizing the interfacial polymerization technique after optimizing the synthesis conditions based on previous computational simulations.
Computational design of PANI imprinted polymer
First, Aniline and MLN molecules were modeled in MOE using universal smiles codes from the PubChem database. 26 Structure preparations, protonation, partial charges calculation, and energy minimizations were also performed based on the EHT: Amber 10 force field. Molecule files in.sdf format were saved in a combined file for the next step in DFT calculations.
DFT geometry optimizations and binding energy calculations under different solvents were conducted using the ORCA 5.0.4 software. 27 Geometry optimizations were performed utilizing the Bp86 functional besides the split valence polarization function (def2-SVP), Grimme's dispersion correction method (D3BJ), and the integral equation formalism variant (IEFPCM) solvation mode to simulate the effect of each different solvents (CCl4, CHCl3, ether, dichloromethane) on the binding between MLN and aniline. By the end of the convergence, HOMO-LUMO energies, binding energies, solvation energies, and gap energies were calculated for the MLN-aniline complex under each solvent.
PANI molecules were modeled on MOE by the polymer building tool, then the PANI structure was prepared for protonation and error corrections using the structure preparation tool and finally was stored as a PDB file. A 0.7 ns molecular dynamic simulation (MD) in water as solvent at pH = 5 was performed for both MLN and PANI using Nose-Poincare Andersen equations of motion, 0.5 ps sampling window, 0.002 ps time step. The simulation time was segregated as follows; 0.03 ns heating from 0 to 300 K followed by an equilibration phase of 0.1 ns, then a production period of 0.54 ns followed by a cooling period of 0.03 ns. By the end of the simulation, the trajectory files were collected and sent for analysis by origin pro software.
Synthesis of non-imprinted and imprinted Ag-PANI polymer
Ag-PANI particles were prepared by interfacial polymerization utilizing two immiscible phases. To the first aqueous phase (20 ml deionized LC/MS grade water), we added 0.25 gm of AgNO3 and sonicated for 5 min till complete dissolution and formation of solution A. Solution A was stirred on a magnetic stirrer, and 1.07 ml of H2SO4 was added to it. Afterward, we added 0.28 gm of standard MLN to 40 ml of diethyl ether/CCl4 (50:50% v/v) under continuous stirring for 5 min, then 0.75 ml of aniline was added to the mixture to prepare solution B. Finally, into a 100 ml beaker, solution B was added to solution A; the beaker was sealed and continued stirring for 24 h till the completeness of polymerization as indicated by the formation of deep green color of the Ag-PANI (Emraldin). The resulting particles were washed several times using methanol: acetic acid (90:10% v/v) till complete clearance of the MLN from the particles. Finally, the particles were washed with deionized water several times to remove residual washing solvent and dried overnight at room temperature. As shown above, the non-imprinted Ag-PANI polymer was prepared without adding the MLN into the organic phase.
Preparation of Nano-silver printable ink
The Nano-Ag ink was prepared following the procedure reported by 28 after slight modifications in the technique. Briefly, 1.02 gm of AgNO3 was dissolved into 60 ml of EG by sonication for 10 min and left on a magnetic stirrer for 10 min; then, the resulting solution was held into a burette (solution A) for the next step. Another solution of 10 gm of PVP dissolved into 60 ml of EG and heated on a hot plate at 100 °C for 5 min until the solution turned yellow (solution B). At continuous heating at 100 °C, add solution A from the burette at a slow rate (0.05 ml s−1) to the hot solution B with constant stirring at 700 rpm using an overhead agitator. After the complete addition of solution A, the whole mixture was kept stirred at 100 °C for 3 h to permit the capping of the reduced Ag particles with PVP. Excess PVP was removed from the mixture using 100 ml of ethanol added to it under sonication for 3 h. Eventually, the particles were collected by cool centrifugation at 4 °C and 10000 rpm for 15 min After that, the supernatant was decanted and replaced by ethanol/acetone (50:50%v/v) solution, sonicated for 5 min, to wash the particles for several cycles with the aid of centrifugation at 10000 rpm and 15 min for each cycle. Finally, when the resulting supernatant was clear, the particles were collected into a 5 cm petri dish and were flash dried in a microwave oven for 90 s to evaporate residual ethanol/acetone and prevent excessive oxidation of Ag particles. The dried particles were dispersed into 10 ml of methanol and stored in a tightly closed glass vial under refrigeration at 4 °C till needed.
Electrode assembly
A diagrammatic illustration summing up the assembly process of the proposed chip sensor was supplied in Fig. 1a.
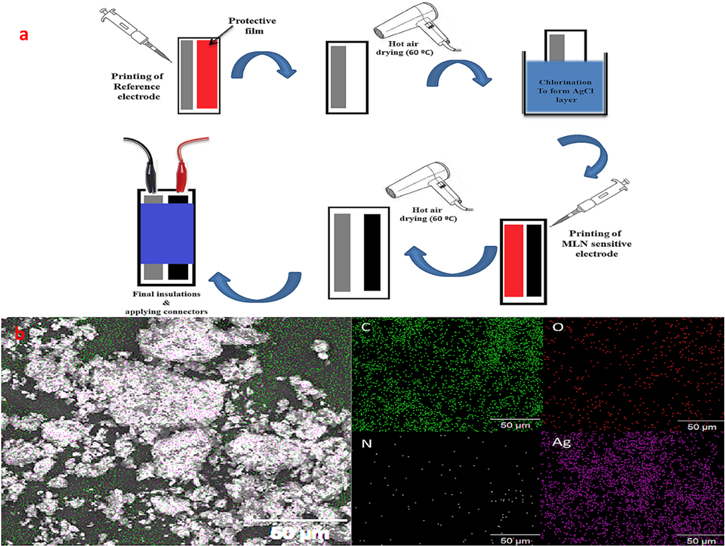
Figure 1. (a) a schematic illustration for the integrated sensor fabrication process. (b) EDX mapping for a specimen of the Ag-PANI imprinted polymer specifying the density and distribution of the constituting elements.
Download figure:
Standard image High-resolution imagePreparation of the quasi-reference (Ag/AgCl) electrode
A PVC cocktail was prepared by weighing 190 mg of PVC powder and transfer into a 50 ml sealed vial containing 5 ml of THF and stirred by magnetic stirrer for 2 min, then 0.34 ml of NOPE was added with continuous stirring for an additional 5 min till the complete dissolution of all components and formation of a homogenous cocktail solution. A 300 μL of the above cocktail was transferred to a 2 ml Eppendorf containing 6 mg of EXG, 3 mg of the non-imprinted Ag-PANI fine powder, and 20 μL of the Nano-Ag ink, and then the Eppendorf was tightly sealed and subjected to vortex followed by a 30 min sonication into an ice bath. A 50 μL of the above mixture was printed to the unprotected half (the position designated for reference electrode) of a polyethylene tetra phthalate (PET) chip. The printed layer was dried with a hot air gun (60 °C) for 15 min; then, the protective film was carefully removed. Finally, the electrode was immersed into a (40 mg ml−1) NaOCl solution for 30 s to form the AgCl layer, then washed with deionized water and dried in a hot air gun (60 °C) for 5 min.
Preparation of the MLN-sensitive electrode
A similar PVC cocktail was prepared as described above but with the addition of 8 mg of the ion associate (MLN-TPB) and 0.34 ml of NOPE. A 300 μL of the above cocktail was transferred to a 2 ml Eppendorf containing 3.9 mg of the imprinted Ag-PANI fine powder and 6 mg of EXG, and the Eppendorf was tightly sealed and subjected to vortex followed by 30 min sonication into an ice bath. A 50 μL of the above mixture was printed to the un-protected half (the position designated for the sensor electrode) of the same PET chip to construct sensor III (D1). The printed layer was dried by a hot air gun (60 °C) for 15 min. Then, the protective film was carefully removed. Finally, the crocodile connectors were applied, and the electrodes were insulated by paraffin film. The sensor I comprised 0.35 ml of NOPE and 10 mg of the MLN-TPB without Ag-PANI particles. While sensor II was of a similar composition to sensor I with the addition of 5 mg of Ag-PANI particles, and both sensors were fabricated in a similar fashion to sensor III.
Another design of the proposed sensors (D2), implying that each electrode was printed on a separate PET chip, was executed according to the above procedures without the need for protective films during their printing.
Calibration of the proposed sensors
Each sensor was calibrated by immersing the non-insulated part into a 5 ml measuring cell containing varying concentrations of MLN standard solution in the range of (1 × 10⁻⁷ − 1 × 10⁻² M). The obtained potential due to each concentration vs each concentration was plotted, and the slope of each sensor was recorded.
Stability of the quasi-reference electrode
The stability of the reference electrode, either integrated with the MLN sensitive electrode on the same chip or printed on a separate PET chip, was tested by investigating the resulting potential from Cl− solution (KCl) of various concentrations in the range of (1 × 10⁻⁵ − 1 × 10⁻¹ M) against a commercial double junction Ag/AgCl electrode. Finally, the relation between the - Log of the solution's molar concentration vs the resulting potential (mV) was plotted, and the slope of the reference electrode was computed accordingly.
Dosage form analysis
Commercially available dosage form averomilan®, each tablet was claimed to contain 50 mg of MLN, was analyzed utilizing sensor III (D1). Ten tablets from each product were pulverized in a clean, dry mortar into a fine powder, then a suitable aliquot representing the average weight of one tablet was quantitatively transferred to a 100 ml volumetric flask containing 70 ml BR buffer (pH 5). The flask was subjected to vortex for 10 min, then sonicated for 30 min, and the volume was completed to the mark with the same solvent. Finally, a suitable amount was transferred into a 15 ml falcon tube for cool centrifugation at 10000 rpm for 10 min. An appropriate aliquot (10 ml) was withdrawn from the clear supernatant and transferred quantitatively into another 100 ml volumetric flask. The volume was completed using the same solvent to achieve a final concentration of 1.77 × 10⁻⁴ M. A suitable volume was transferred to the 5 ml measurement cell, and the resulting potential was recorded by sensor III (D1) accordingly.
Application to spiked human plasma
The human plasma was devoid of drugs and was procured from the tumor marker research unit situated at the Faculty of Pharmacy, Al-Azhar University, Cairo, Egypt, before the commencement of the actual investigations. Various aliquots ranging from 0.88 to 1.3 ml were precisely withdrawn from standard solutions of MLN with a concentration of 1 × 10⁻⁵ M and transferred into 100 ml volumetric flasks. Subsequently, 1 ml of human plasma was introduced and eventually diluted to the designated level with BR solution, which had been adjusted to a pH of 5, resulting in a final concentration range of 0.88 × 10⁻⁶ to 1.3 × 10⁻⁶ M. Prior to potentiometric measurement using the suggested sensors, the solution was subjected to sonication for the duration of 1 min. This concentration range was selected to correspond to the highest concentration of MLN that has been seen after a single dose (MLN's Cmax is 250 ng ml−1). Following that, the suggested method's protocols were used to analyze MLN directly in plasma. The corresponding regression equation was used to get the recovery percentage and standard addition once the DVN concentration was measured.
Results and Discussion
An MD and QM computational simulations were implemented to optimize the Ag-PANI MIP synthesis conditions to achieve selectivity-by-design of these particles and validate the experimental selectivity towards MLN ions before they are incorporated into the sensor transducers. The proposed sensors represent a miniaturized form of an all-solid-state sensor. Its performance regarding sensitivity and selectivity was enhanced by incorporating the computationally designed Ag-PANI MIP particles in the MLN sensing electrode composition. Also, the sensor's composition was further optimized by the SVEM approach to reach the optimal performance for detecting and quantifying MLN in its dosage forms and human plasma.
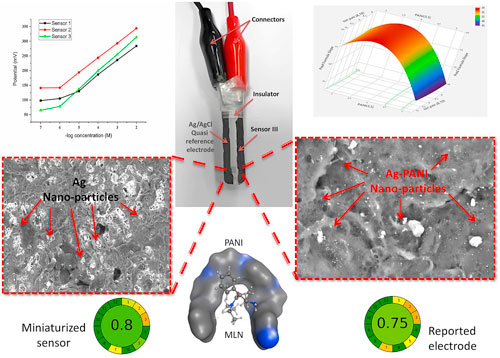
Besides, the proposed sensor was of two designs; the first (D1) was the integrated design with the advantage of simplicity and portability, as seen in Fig. S1a. The second design (D2) was the separate design in which each electrode was printed on a separate PET chip, then connected to constitute the measuring cell (Fig. S1b). Both designs were compared with each other and with the reported MLN electrode regarding their performance.
Physical characterization of the proposed sensor
The synthesized Ag-PANI MIP and non-imprinted polymer (NIP) particles were scanned by scanning electron microscopy (SEM) to investigate the surface properties of both types of particles. The MIP particles showed a rough shape with in-depth details on their surface compared to the NIP particles, implying the imprinting process's success, as shown in Figs S2a and S2b), respectively.
Besides, the MLN sensitive electrode (sensor III) and the integrated quasi-reference electrode were scanned in SEM and Energy-dispersive X-ray spectroscopy (EDX) modes validating their surface properties and material composition. The SEM scanning for the MLN-sensitive electrode revealed the porous surface of the electrode, which supported the diffusion of the MLN ions into the deepest areas of the electrode. Moreover, the extra magnification (5000 mg) revealed the dispersion of the Ag-PANI Nanoparticles across the field, which supported its successful incorporation into the MLN electrode, as illustrated in Fig. S2c. Also, the SEM scanning of the fabricated quasi-reference electrode revealed the surface porosity beside the dispersion of bright areas across the field, indicating the presence of metallic components on its surface, confirmed by extra magnification (2000 mg) and illustrated in Fig. S2d. On the same line, the chemical composition of the quasi-reference electrode was further investigated by EDX scanning. The collected EDX spectrum showed multiple significant peaks of Ag, confirming the presence of elemental (Ag) and ionic silver (Ag+) with a considerable peak for Cl− ions, also ensuring the formation of the AgCl layer and validating the composition of the Ag/AgCl system of the investigated electrode (Fig. S2e). Also, an EDX mapping was charted for a cross-sectional area, revealing the distribution of various elements constituting the quasi-reference electrode further to validate its composition (Fig. 1b).
SVEM optimization of the sensor's composition
The novel bootstrapped experimental design approach (SVEM) optimized the MLN-sensitive electrode composition. The experimental design was constructed by involving three independent variables, which were; the amount of ion associate (MLN-TPB), the amount of the MIP Ag-PANI particles, and the amount of the added plasticizer (NOPE) with the observation of a single response (slope). Two levels, 17 runs design based initially on an independent quadratic design was constructed, the resulting sensor compositions were prepared and assembled, and the slope of each sensor was determined and recorded accordingly (Table I). The design was uploaded to the SVEM tool into the JMP pro software to proceed to the next step. The model selection algorithm was selected as forward selection (FWD) with a boot value of (not = 50). The resulting prediction model formula was extracted and applied to the dataset, and the target response was set to (slope = 59). Maximizing the desirability function resulted in the following solution: (8 mg of ion associate, 0.34 ml NOPE, and 3.8 mg of Ag-PANI particles) which was applied experimentally to fabricate and assemble sensor III as in Fig. 2a. the proposed model was diagnosed by plotting the actual slope values vs predicted values and by plotting the slope residuals vs predicted values revealing minimal deviations and robustness of the suggested model (Fig. 2b). Eventually, the proposed predicting model was represented in a 3D surface plot describing its predictive space, as seen in Fig. 2c, and the model formula was presented in Table II.
Table I. SVEM two-level and three-factorial basic experimental design.
| Run | Ag-PANI MIP (mg) | NPOE (ml) | MLN-TPB (mg) | Slope (mV/decade) |
|---|---|---|---|---|
| 1 | 0.000 | −1.000 | 1.000 | 56.5 |
| 2 | 1.000 | −1.000 | 0.000 | 46.8 |
| 3 | −1.000 | 0.000 | 1.000 | 56.7 |
| 4 | 0.000 | 0.000 | 0.000 | 57.3 |
| 5 | 0.000 | 0.000 | 0.000 | 57.2 |
| 6 | 0.000 | 1.000 | 1.000 | 57.9 |
| 7 | −1.000 | 0.000 | −1.000 | 56.4 |
| 8 | 0.000 | −1.000 | −1.000 | 54.2 |
| 9 | −1.000 | −1.000 | 0.000 | 53.8 |
| 10 | 1.000 | 0.000 | 1.000 | 49.3 |
| 11 | −1.000 | 1.000 | 0.000 | 57.4 |
| 12 | 0.000 | 0.000 | 0.000 | 57.2 |
| 13 | 0.000 | 1.000 | −1.000 | 58.8 |
| 14 | 0.000 | 0.000 | 0.000 | 57.2 |
| 15 | 0.000 | 0.000 | 0.000 | 57.3 |
| 16 | 1.000 | 1.000 | 0.000 | 49.3 |
| 17 | 1.000 | 0.000 | −1.000 | 48.7 |
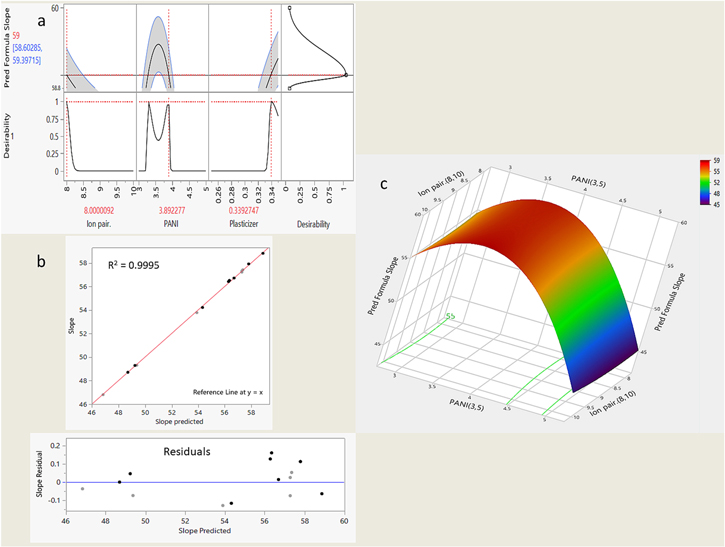
Figure 2. (a) Shows the numerical optimization of the sensor composition based on the proposed SVEM model, its desirability function and the obtained solution leading to the targeted slope value 59 mV/decade. (b) Diagnostics of the proposed SVEM model showing no significant deviations between the actual and predicted slope values by the model. (c) 3D surface plot of the proposed SVEM showing the predictability space of the proposed model.
Download figure:
Standard image High-resolution imageTable II. The resulting predictive formula representing the SVEM proposed model.
| Predictive model | Predictive model formula |
|---|---|
| SVEM model | (−68.056) + 1.041 * Ion associate + 35.420 * Ag-PANI + 345.043 * NPOE + 0.207 * Ion associate ^ 2 – 4.758 * Ag-PANI ^ 2 – 261.913 * NPOE ^ 2 + 0.03 * Ion associate * Ag-PANI −15.499 * Ion associate * NPOE − 4.607 * Ag-PANI * NPOE |
Optimization of the sensor's operable conditions
Stability of the quasi-reference electrode
The stability of the integrated quasi-reference electrode was essential to be tested for overall stable sensor response. The reference electrode was investigated regarding its stability and was tested three consecutive times (n = 3) on three different newly fabricated sensors. The quasi-reference electrode was responsive and sensitive to changes in concentrations of various Cl− solutions in the range of (1 × 10⁻⁴ − 1 × 10⁻¹ M) with an average slope value of (56.3 ± 0.625 mV decade−1). Pertaining to the Nernestian slope values obtained from the reference electrodes, the proposed Ag/AgCl electrode was qualified to act as a pseudo reference in the proposed sensor.
Investigating the impact of pH on sensors' response
This study aimed to analyze the impact of pH levels using BR buffer, which ranges from 2 to 12, on the electrode potential response. The experiment utilized 1 × 10⁻⁴ and 1 × 10⁻³ M solutions of MLN. The data was presented as a graph showing a relation between recorded potential values for each mentioned concentration obtained at different pH levels against pH levels (Figs. 3a–3c). It was noticed that the potential stability of all sensors (II and III) was achieved in a pH range of (4–8) while sensor I was stable in the range of (5–8). Below pH 4, a significant increase in the potential was noticed, most probably due to the interference of the elevated proton concentration with the measurements. Above pH 8, there was a noticeable decrease in the potential, most probably due to the deprotonation of the MLN ions in the high pH medium or the interference from the elevated hydroxyl concentration in the medium. From these data, we concluded that preserving the pH value at 5 was critical for the stable response of the proposed sensors. Although sensor III had a wide pH range (4–8), the commitment to pH 5 was reasoned by the requirement of the PANI particles for sufficient concentration of protons in the surrounding media to perform its ultimate conductivity function enhancing the overall sensor sensitivity. 29 The Prepared Ag-PANI nanoparticles were in the salt form (-NH2-) and still if the surrounding medium was acidic enough. Since the conductivity of PANI is dependent on the allocation of the imine protons onto its polymeric chain of the salt form so, if the medium pH was above 5 a gradual decrease in the PANI conductivity is noticed due to the deprotonation of the PANI salt into the base (-NH-) form. 30
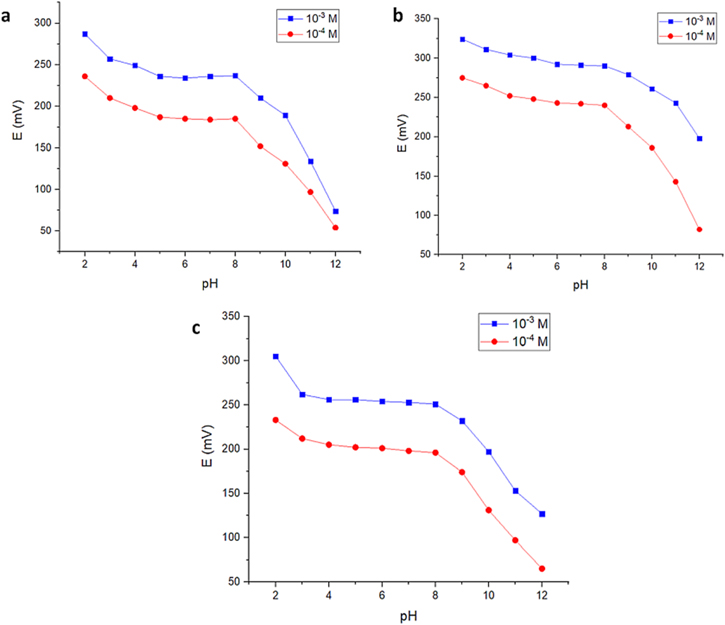
Figure 3. (a) Effect of the pH in the range (2–12) on the sensor I response stability. (b) Effect of the pH in the range (2–12) on the sensor II response stability. (c) Effect of the pH in the range (2–12) on the sensor III response stability.
Download figure:
Standard image High-resolution imageSelectivity coefficients
The suggested sensors' selectivity in the existence of interfering ions was assessed using the separate solutions approach. For this work, six different inorganic ions in the form of chloride salts were chosen. The suggested sensor responded to the inorganic ions in a non-Nernstian pattern, as seen in Fig. S3a. Additionally, the method's selectivity was checked by applying matched potential method (MPM). This method was evaluated using different organic components, related impurities (PTD and BCN), and other co-formulated drugs (mirtazapine) with MLN. The results were illustrated in Fig. S3b, proving the selectivity of the fabricated sensor towards MLN ions.
Dynamic response time
The dynamic response time is a crucial factor in the analytical utilization of ion-selective sensors. This study indicated that the modified sensor (sensor 3) had a faster response time than the other two fabricated sensors (sensor I and II) within the concentration range of 10–7 to 10–2 M, which took five seconds to achieve a stable potential.
Life span estimation and sensor storage
The proposed sensor's electrochemical performance was evaluated per the IUPAC guidelines data. The calibration curves section was followed to test the sensors and the PVC membrane electrodes; the detection limit, linear range, and slope were monitored at specific time periods. After conducting several weeks of evaluation, it was determined that the PVC polymeric membrane is capable of withstanding the soaking effect for a duration of up to 7 weeks.
Computational simulations
Molecular mechanical and quantum computational simulations were conducted to aid in the design and synthesis of the MIP Ag-PANI particles and test their selectivity towards the MLN ion in the presence of its impurities (BCN and PTD).
MD
The MD simulations aimed to scan the effect of each organic solvent on the non-bonding interactions between MLN (target) and the aniline (monomer) in the Ag-PANI synthesized particles. The trajectory files from the 0.7 ns simulations of the MLN-aniline complex in four different solvents (CCl4, CH3Cl, CH2Cl2, and ether) were analyzed regarding the radius of gyration (Rg), root mean square error (RMSD), hydrogen bonding energies (HB) and the non-bonded interactions energies (NB). The involvement criterion for solvents was limited by the solubility of both the monomer and MLN facilitating the optimal interaction between them.
The initial HB energies analysis of the four simulations revealed a relative abundance of the hydrogen bonding in MLN-aniline complex in ether according to the following order ether > CHCl3 > CCl4 > CH2Cl2 as seen in Fig. S4a, which implied the choice of ether as the progenic solvent for polymerization that support HB between MLN and aniline. The NB interaction energies analysis results aligned with those from HB energies, as seen in Fig. S4b. Due to the closeness of the HB and NB energies' values for the MLN—aniline complex in both CHCl3 and CCl4 making the comparison between them impractical, we chose to compare the Rg values of the investigated complex in these two solvents as shown in Fig. S4c. The complex of lower Rg values reflected the compactness of its structure and its superior stability which was achieved under CCl4 rather than CH3Cl clarifying the ambiguity in the HB and NB obtained results.
By examining the RMSD data of the MLN-aniline complex in all four solvents, both ether and CHCl3 showed a significant un-stability due to its elevated and fluctuating RMSD profile (Fig. S4d). Again we needed to decide the second most suitable solvent, which achieves abundant HB interaction between MLN and aniline in their complex and shows acceptable stability. This criterion made us conclude that CCl4 was the second most suitable choice regarding its relatively stable RMSD profile.
Finally, the PANI polymer was designed utilizing the MOE polymer building tool then the whole polymer was equilibrated with MLN ion in CCl4 for 0.7 ns under the same above MD simulation criteria. The obtained equilibrium MLN-PANI complex structure was saved in the.pdb format after constraining the PANI molecule at the obtained equilibrium conformation to simulate the induced imprinting effect by the presence of MLN ion, as seen in Fig. 4a. Also, the selectivity of the proposed PANI equilibrium conformation towards MLN ion in the presence of its related impurities PTD and BCN was tested in an aqueous medium (pH 5). The RMSD analysis of this simulation (0.63 ns) revealed that the MLN-PANI complex had the highest stability among other complexes indicating the selectivity of the proposed PANI equilibrium structure towards MLN ions Fig. 4b.

Figure 4. (a) The 3D and molecular surface of the proposed equilibrium structure of the Ag-PANI imprinted polymer in the vicinity of MLN ion. (b) RMSD profile for MLN, BCN and PTD in complex with the Ag-PANI imprinted polymer with their 3D accompanying structures.
Download figure:
Standard image High-resolution image
DFT calculations
The BP86 function was selected here for some specific characters, making it the best option for screening purposes, as the situation implies here. These characters can be summarized as; being pure DFT functional. It is computationally cheaper and faster than hybrid functional making it more useful for small systems that require higher accuracy and efficiency. Also, BP86 can give reliable results about the geometries and bond energies in smaller systems. On the other hand, unlike the hybrid functional, the BP86 functional has many drawbacks while encountering hydrogen bonding systems. This work compensated for these pitfalls by involving both the def2-SVP basis set and the D3BJ method.
The def2-SVP basis set was utilized because it can be extended to optimizations of the hydrogen bonding systems' energy and structure. 31 This method compensated for the shortness of the BP86 in dealing with hydrogen bonding as it effectively accounts for the anisotropy and electronic distortions around the hydrogen atoms.
Also, the involvement of the D3BJ method was essential to correct the BP86 calculations for the dispersion effect, compensating for the shorthand abilities of the BP86 in simulating hydrogen bonding and enhancing the accuracy of the utilized method. The net result was a faster, computationally cheaper, and more accurate method capable of simulating and optimizing the geometry of a small hydrogen bonding system with greater reliability.
The DFT output files resulting from each solvent were analyzed regarding the energies of the optimized molecules in single and complex form, and the binding energy of the MLN-aniline was calculated according to the following equation:

By comparing the resulting binding energies in the investigated solvents, 32 CCl4 and ether both showed the highest binding energies, as shown in Fig. S5a. Also, after calculating the dipole moment (μ) of the MLN-aniline complex in each solvent, it was noticed that there was a linear increase in the complex dipole moment with the rise in the dielectric constant (ε) of each different solvent which implies the charge transfer establishment in the complex stabilized by the increment in the dielectric constant of the surrounding solvent molecules (Fig. S5b). Besides, the molden files were generated in Orca software to investigate the HUMO-LUMO orbitals and calculate the MLN-aniline complex's gap energies (ΔEH-L) in different solvents. After plotting the data of gap energy vs the dipole moment of the MLN-aniline complexes in other solvents, it was noticed that CCl4 and ether provided the lowest gap energies for the complex, as in Fig. S5c. The lower gap energy of the MLN-aniline complex is related to the enhancement in its electroconductive properties as the lower ΔEH-L facilitates the electron transfer between HUMO and LUMO orbitals and the current flow through the complex or through the transducers the complex is composing. 33 Also, the lower ΔEH-L suggests that MLN would be tightly bound to the aniline upon approaching its polymeric network of the Ag-PANI particles.
From the above data and the data pertained from MD simulations, we concluded that CCl4 was the most suitable choice as a non-aqueous layer during the interfacial polymerization and imprinting of Ag-PANI particles. Due to the low solubility of the MLN in CCl4, we decided to use a co-solvent system composed of (1:1 v/v) CCL4: ether to aid the MLN solubility into the organic layer without affecting the established interaction between MLN and aniline during polymerization.
Molecular docking (selectivity)
Molecular docking was performed to test the selectivity of the imprinted polymer towards MLN ions in the presence of its related impurities BCN and PTD. A semi-flexible docking protocol was followed utilizing the triangle matcher placement method with a rigid receptor, London ΔG scoring function, and the generalized Born/solvent accessible surface area (GBVI/WSA ΔG) rescoring function. A database composed of the conformational search results for all potential ligands (MLN, BCN, and PTD) was utilized to perform docking against the equilibrium structure of PANI as a receptor. The resulting docking poses were obtained, as shown in Fig. S6a, revealing that MLN had the highest score indicating the selectivity of the proposed PANI MIP towards the MLN ions. The highest score and lowest RMSD poses were selected and isolated for the MD 0.63 ns simulation in a buffered aqueous medium, as previously detailed under the MD simulation section.
Performance comparison with the reported electrode
As mentioned before, we decided to fabricate two designs of the sensor III namely (D1 and D2) to ensure that the miniaturization of the electrode sensing parts would not interfere with the sensor performance. Then, both designs were compared with the reported sensor. 24 Upon comparing the D1 and D2 versions of sensor III, there was no significant difference regarding slope, linear range, and LOD. On the other hand, the proposed sensor showed superior performance characteristics to the reported electrode, as shown in Table III. Also, the portability and simplicity of the proposed sensor (D1) made it more attractive than the conventional electrode setups.
Table III. A performance comparison between the reported electrode and the proposed sensor III different designs.
| Sensor/design | Slope (mV/decade) | LOD (M) | Linear range (M) | Correlation coefficient | Pre-soaking (min) | |
|---|---|---|---|---|---|---|
| Sensor III | D1 | 59 | 7.94 × 10⁻⁷ | 1 × 10⁻⁶–1 × 10⁻² | 0.9998 | — |
| D2 | 59 | 8.00 × 10⁻⁷ | 1 × 10⁻⁶–1 × 10⁻² | 0.9995 | — | |
| Reported | 58 | 5.30 × 10⁻⁶ | 1 × 10⁻⁵–1 × 10⁻² | 0.9998 | 10 | |
Printed sensor greenness assessment
The concepts of green analytical chemistry are widely recognized in chemical labs. Specialized evaluation methods are required to analyze the environmental impact of chemical operations accurately. Because of the significance of environmental preservation, there is a growing need to replace traditional pharmaceutical analytical procedures that rely on the use of dangerous chemicals with more eco-friendly green ones that do not compromise performance. AGREE, one of these green assessment tools is offered to check and evaluate the greenness of the suggested approaches. 34 The newest green assessment tool, AGREE metrics, encompasses all 12 green analytical concepts. The total outcome, expressed as 1, was based on the individual principles score acquired from the particular principles. A number near one implies that the technique is greener. After entering the technical information into the software, the total result revealed that the suggested approach was more sustainable and environmentally friendly for a longer period than the published method (Figs. S6b and S6c).
Potentiometric method validation
To confirm that the proposed technique was suitable for the intended purpose, the method's linearity, precision, accuracy, and limit of detection were further evaluated in accordance with the IUPAC criteria after adjusting the conditions of MLN potentiometric sensors.
Linearity
Five different MLN concentrations were examined in triplicate to determine linearity. The observed potential responses and their associated concentrations had an established linear relationship, as tabulated in Table IV.
Table IV. The electrochemical response characteristics of the three fabricated MLN sensors.
| Parameter | Sensor I | Sensor II | Sensor III |
|---|---|---|---|
| Concentration range (M) | 10–5–10–2 | 10–6–10–2 | 10–7–10–2 |
| Slope (mV/decade) | 51.1 | 56 | 59 |
| Intercept (mV) | 388.1 | 469 | 432.8 |
| Correlation Coefficient (r) | 0.9991 | 0.9993 | 0.9998 |
| Accuracy (Recovary% ± S.D.) a) | 98.23 ± 0.689 | 99.18 ± 0.621 | 99.31 ± 0.517 |
| LOD (M) | 6.31 × 10⁻⁶ | 1.00 × 10⁻⁶ | 7.94 × 10⁻⁷ |
| Response time (s) | 3 | 3 | 3 |
| Working pH range | 5–8 | 5–8 | 5–8 |
| Stability (weeks) | 6 | 7 | 7 |
| Precision (%RSD) Intra-day b) | 0.621 | 0.523 | 0.404 |
| Inter-day c) | 1.025 | 0.954 | 0.897 |
| Robustness (Mean ± %RSD) d) | 101.24 ± 0.988 | 99.52 ± 0.912 | 99.07 ± 0.855 |
a)Mean of three determinations. b)Mean of three various concentrations ( 10−5, 10–4, 10–3 M) recurred three times within the day. c)Mean of three various concentrations ( 10−5, 10−4, 10−3 M) recurred three times on three consecutive days. d)Differences in method parameters such as pH of the sample.
Precision
Both repeatability and intermediate precision of the proposed methods were evaluated, where the repeatability was done by determining the average of three concentrations repeated three times within a single day. Additionally, the intermediate precision was assessed by calculating the average of three concentrations repeated three times over three consecutive days. The results of both types of precision were interpreted in the form of percent relative standard deviation (% RSD), as summarized in Table IV.
Accuracy
The accuracy of an analytical methodology is determined by the degree of conformity between the measured value and the actual value. It shows the % recovery of three MLN measurements, as presented in Table IV.
Limit of detection (LOD)
The LOD is the minimal concentration that the technique can detect, albeit it is not always quantified as an exact and precise amount. LOD was calculated by extending the highest Nernstian concentration and the lowest non-responsive concentration lines and subsequently determining the main ion concentration where these lines intersect. The LOD results of the proposed methods are shown in Table IV.
Robustness
Modifications were made to the experimental variables, specifically the pH with a tolerance of ±0.2, to evaluate their impact on the robustness of the methods. The results indicate that the minor adjustments made during the experimental procedure did not significantly affect the measured potential, as shown in Table IV.
Applications in analysis
Pharmaceutical dosage form and statistical analysis
The built-in sensors were used for MLN analysis in pharmaceutical formulation (Averomilan tablet). Based on the percentage of recoveries and standard deviation (SD) obtained, it was shown that the proposed sensors could detect the specified drug. As shown in Table V, the percentage recovery and SD were reliable and exact, confirming the sensor's applicability. Furthermore, a standard addition method was used to guarantee that tablet excipients didn't interfere, as shown in Table V.
Table V. Application of standard addition techniques for the analysis of MLN in Averomilan® tablets.
| Pure added (-Log (M)) | Tablet taken (-Log (M)) | Pure found (-Log (M)) | % Found a) |
|---|---|---|---|
| 3 | 3.014 | 100.45 | |
| 2.699 | 2.675 | 99.09 | |
| 2.523 | 2.752 | 2.505 | 99.29 |
| Mean % | 99.61 | ||
| S.D. | 0.732 | ||
Additionally, the validity of the proposed sensor was then studied by comparing the results to those of the published approach, but no statistically significant difference was found where the estimated t and F values were less than the tabulated ones (Table VI).
Table VI. Statistical comparison of the results acquired from the developed potentiometric methods and the previously reported method.
| Item | Reported method | Proposed method |
|---|---|---|
| Mean | 100.04 | 98.48 |
| S.D. | 0.336 | 0.589 |
| n | 6 | 5 |
| Variance | 0.113 | 0.347 |
| Student's t test a) | — | 1.89(2.26) |
| F-test a) | — | 3.07(5.19) |
a)The values in parenthesis are the corresponding theoretical values for t and F at P = 0.05.
Application to human plasma
The results obtained from utilizing the recommended sensor for measuring DVN in human plasma are presented in Table VII. The outcomes obtained from individual sensors demonstrated the assay's accuracy and precision.
Table VII. Results of MLN quantitation in spiked human plasma.
| Pure added -Log (M) | Pure found -Log (M) | % Found* |
|---|---|---|
| 5.886 | 5.895 | 100.15 |
| 6.054 | 6.166 | 101.86 |
| 6.00 | 6.014 | 100.23 |
| Mean % | 100.75 | |
| S.D. | 0.965 | |
Conclusions
The proposed miniaturized sensor based on EXG as a transducer and decorated by Ag-PANI MIP particles could quantify MLN selectively in the presence of PTD and BCN impurities in both dosage form and human plasma. The proposed computational approach in designing the MIP particles successfully provided a greener optimization pathway. The comparison held between the proposed and the reported sensors revealed that the proposed MLN sensor had the upper hand regarding some performance characteristics besides the greenness assessment, which also revealed a greener outcome for the proposed sensor regarding portability, liability for automation, lowered sample volume and waste. The MLN sensor's fabrication simplicity, portability, flexibility, and thermal resistivity made it suitable for future upgrading to a wearable sensor version for real-time drug plasma level monitoring.
Supplementary data (9.5 MB DOCX)