
Abstract
Single particle electrochemical oxidation of polyvinylpyrrolidone-capped silver nanoparticles at a microdisk electrode is investigated as a function of particle shape (spheres, cubes, and plates) in potassium nitrate and potassium hydroxide solutions. In potassium nitrate, extreme anodic potentials (≥1500 mV vs Ag/AgCl (3 M KCl)) are necessary to achieve oxidation, while lower anodic potentials are required in potassium hydroxide (≥900 mV vs Ag/AgCl (saturated KCl)). Upon oxidation, silver oxide is formed, readily catalyzing water oxidation, producing a spike-step current response. The spike duration for each particle is used to probe effects of particle shape on the oxidation mechanism, and is substantially shorter in nitrate solution at the large overpotentials than in hydroxide solution. The integration of current spikes indicates oxidation to a mixed-valence complex. In both electrolytes, the rate of silver oxidation strongly depends on silver content of the nanoparticles, rather than the shape-dependent variable–surface area. The step height, which reflects rate of water oxidation, also tracks the silver content more so than shape. The reactivity of less-protected citrate-capped particles toward silver oxidation is also compared with that of the polymer-capped particles under these anodic conditions in the nitrate and hydroxide solutions.
Export citation and abstract BibTeX RIS
Interest in nanoparticles (NPs) has increased due to the enhanced properties of nanosized materials, thus they are incorporated into thousands of commercial products worldwide. 1 Although NPs are becoming increasingly common in utilization, the actual properties of nanomaterials are still poorly understood, as they exhibit vastly different properties than the same material in the bulk counterpart. 2,3 Commercial applications of nanomaterials include medicinal, agricultural, cosmetic, and more. 1 Nanomaterials also make ideal catalysts for numerous reactions, especially within the scope of alternative energy. 4–6 Silver nanomaterials are of particular interest, and are present in more commercially-available products for public purchase than any other nanomaterial, 1 as they are especially popular for their antimicrobial effects. 7–9 Silver nanomaterials also have a presence in research and industrial applications. Understanding the characteristics and behaviors of nanoparticles is complicated because their properties change as their morphologies (size and shape) change, 3,6,10–13 as well as with changes in the capping ligand. 14–18
Electrochemical oxidation of individual silver nanoparticles (AgNPs) moving freely in suspension has been previously used to characterize and quantify them, providing a deeper understanding of their properties and behaviors compared to ensemble measurement without individual particle resolution. 19–23 However, most of that work has focused on silver nanospheres (AgNSs) capped with citrate, due to the relative ease of oxidation, as well as their wide availability. Analysis of individual AgNPs having different shapes remains of great interest. Silver nanocubes (AgNCs), 12,24 for example, are reported to exhibit enhanced electrocatalytic activity for hydrogen evolution and oxygen reduction when compared to spheres under certain conditions. 24,25 The AgNCs can also display less environmental toxicity 12 and have resulted in higher antimicrobial activity for Escherichia coli and Staphylococcus aureus. 26 Compared to spheres, cubes, and rods, silver nanoplates (AgNPls) have been observed to have an increased toxicity for bacterial cells, and no effect of shape was observed for the toxicity for human cells. 27 Furthermore, nanoplates have been reported to have superior catalytic activity for hydrogen evolution. 28 In addition, because strategic selection of ligands is paramount for the synthesis of different shapes, 29,30 it is desirable to be able to electrochemically characterize AgNPs having capping ligands that are more complex than citrate. This interest in electrochemical analysis extends beyond capping ligands. For example, elaborate modification of nanoparticles plays an important role in tailoring properties for different applications 31–33 and for chemical analysis involving chemical recognition and reporter molecules. 34–36 There is a limited number of reports that have investigated the effect of ligand on electrochemical oxidative impacts. 16,37–40 It has also been shown that increasing the size of the capping ligand can render the particles electroinactive. 38
Here, electrochemical oxidation of single AgNPs having different geometric shapes, specifically, AgNCs and AgNPls in suspension are investigated and compared to that of AgNSs. The synthesis of these AgNCs and AgNPls requires the presence of polyvinylpyrrolidone (PVP), which serves as the capping ligand. 29,30,41 Thus, we analyze PVP-capped nanoparticles here, which can be particularly challenging. 16 This ligand has been shown to significantly hinder electrochemical oxidation, although limited reaction in a solution of sodium nitrate (NaNO3) has been reported. 16 Successful anodic responses from individual PVP-capped, 29 nm AgNSs have been demonstrated in solutions of potassium nitrate (KNO3), potassium chloride (KCl), potassium bromide (KBr), 18 and their mixtures for high concentrations of particles (4000 pM). 42
One approach we use here for overcoming the barrier to oxidation is to apply high overpotentials, i.e. potentials of 1650 mV vs Ag/AgCl (saturated KCl) in a 50 mM KNO3 solution. Investigations of single nanoparticle oxidation have been performed previously at potentials up to 1100 mV vs a Ag/AgCl quasi reference electrode in aqueous solutions (KNO3) and only with citrate-capped AgNSs. 43,44 A characteristic spike-step response (i.e. oxidation upon collision with a long current "tail") was observed under these conditions and discussed. Such studies have not examined other AgNP shapes or ligands. These large overpotentials can promote several poorly-controlled additional reactions. Firstly, the oxidation of water can occur resulting in high background currents. 45 Secondly, insoluble silver oxide species (AgOx) are likely formed upon oxidation of the particles, which can catalyze water oxidation. 46,47 Large overpotentials can also promote the formation of higher ordered silver complexes, which can increase the difficulty in interpreting the anodic signals, particularly if mixed-valence oxysilver nitrates are formed. 48,49 Furthermore, access to extreme positive potentials can be limited by the voltage range of the potentiostat (in low current, high bandwidth mode) and the electrode material, providing additional motivation to find conditions that make analysis of PVP-capped particles at lower potentials possible.
Electrochemistry in an electrolyte that stabilizes the oxidized silver product will shift the thermodynamics of silver oxidation to less positive potentials and ideally exclude the contributions of water oxidation to the current. This has been demonstrated mostly for citrate-capped AgNSs in halide solutions that form the halide salt of the oxidized silver. 16,18,22,50 A few studies show electrooxidative impacts in KCl solution with polyethylene glycol (PEG)-capped 40 and PVP-capped, 29 nm AgNSs, 42 and in HCl solution for PVP-capped, 14 nm bimetallic AgAu alloys. 21
It is also known that it becomes more thermodynamically feasible to oxidize silver in basic solutions. This is because of the stabilizing effect of silver oxide formation. 51 Zhang and coworkers, 43 using electrochemical oxidation of single particles, and Willets' and coworkers, 52,53 using in situ dark-field scattering under electrochemical control, have proposed reaction mechanisms that explain the increase in the presence and stability of silver oxide formation for citrate-capped AgNSs with increasing pH. Hafez et al. has used collision events between oxidizing and reducing pulses to further evaluate the behavior of citrate-capped AgNSs under alkaline conditions (pH 11.4). 54 However, water oxidation contributes toward the current at these lower potentials and high pH, as well. Although water oxidation complicates analysis of the anodic current profile of the nanoparticle, it can also be used to attain information about the nanoparticle itself. For example, a longer "tail" from catalysis of water oxidation by the silver oxide is correlated with a larger AgNS size. 43
Recently, a model of the behavior of PVP-capping ligands around 40 nm AgNCs in colloidal suspensions of different solvents has been proposed based on Raman measurements. 55 PVP binds to the particles through the oxygens on pyrrolidone units spaced multiple units apart so that loops of polymer between the anchoring points extend away from the particle into the surrounding medium. Solvents like water that strongly hydrogen bond to the free carbonyl groups in the loops of the PVP cause them to collapse into a compact structure around the particle. A greater separation between the free carbonyl groups and the silver surface is possible in solvents that undergo less hydrogen bonding, such as ethylene glycol, which allows the loops to extend outward, opening up the polymer environment. Thus, it stands to reason that additives that disrupt the hydrogen bonding in an aqueous solution should allow better permeation of ions into and out of the layer, which could diminish the overpotential needed to oxidize the silver. A large increase in pH might provide sufficient disruption of the hydrogen bonding to allow this to occur. The alkaline solution could also serve to neutralize a local decrease in pH during water oxidation, which would otherwise enhance hydrogen bonding and collapse the PVP layer.
Here, we evaluate single particle electrochemical oxidation of PVP-capped AgNCs, AgNPls, and AgNSs in a solution of 50 mM KOH and compare the results to those obtained at the extreme anodic potentials in 50 mM KNO3. We separate the spike-step anodic current response into the different contributions from silver and water oxidation and analyze the duration, integrated charge, and step height of the spike-step for each particle shape. The time required to oxidize a particle was used to probe the effect of particle shape on the oxidation mechanism. Results are further compared to those obtained from less-protected, citrate-capped particles to determine the contribution of the capping ligand to the kinetic barrier of oxidation. In addition, integration of the current spikes indicates the valence to which the silver is oxidized, and this is compared to findings in the literature.
Experimental
Chemicals and materials
Triangular ∼53 nm side length × ∼10 nm thick PVP-capped nanoplates (AgTNPls, lot number ALJ0009, 650 nm peak absorption), 30 (29 ± 3) nm PVP-capped AgNSs, and 30 (29 ± 3), 50 (51 ± 6), and 70 (73 ± 8) nm citrate-capped AgNSs (used in the KNO3 studies) were purchased from nanoComposix (Prague, CZ). The 40 nm PVP-capped AgNSs (39 ± 4 nm) and 40 nm citrate-capped AgNSs (39 ± 5 nm) (used in the KOH studies) were purchased from nanoComposix (San Diego, CA). PVP for all AgNPs obtained from nanoComposix is reported to be Mw = 40,000 g mol−1. PVP-capped (Mw = 55,000 g mol−1) AgNCs (used in the KNO3 and KOH studies) and PVP-capped (Mw = 8,000 g mol−1) round nanoplates (AgRNPls) (used in the KOH studies) were synthesized in-house (see details below). Agar powder and potassium nitrate (99.99%) were purchased from Sigma Aldrich (Germany) and Sigma Aldrich (St. Louis, MO). MasterMet2 0.02 μm colloidal silica suspension for polishing and the MasterTex Polishing pad were acquired from Buehler (Lake Bluff, IL). Ultrapure water with resistivity measuring 18.2 MΩ cm was used for the sample preparation. For synthesis of AgNCs and AgRNPls, ethylene glycol (EG) was acquired from J. T. Baker; sodium hydrogen sulfide (NaHS), hydrochloric acid (HCl), silver trifluoroacetate (AgTFA), sodium borohydride (NaBH4), silver nitrate (AgNO3) and 30 wt% hydrogen peroxide (H2O2) were obtained from Alfa Aesar; and sodium citrate and PVP of Mw = 55,000 g mol−1 and Mw = 8,000 g mol−1 were purchased from Sigma Aldrich. The 10 μm platinum (Pt) disk working electrode was obtained from BASi (West Lafayette, IN).
Synthesis and characterization of silver nanocubes
AgNCs were synthesized by the polyol method in which silver precursor was reduced by EG using PVP as the capping agent. 56 In short, 50 ml EG was added to a 250 ml round-bottom flask equipped with a stirring bar and placed in an oil bath at 150 °C. After the temperature equilibrated (30 - 45 min), EG solutions of 0.6 ml of 3 mM NaHS, 5 ml of 3 mM HCl, 12.5 ml of 0.25 g PVP and 4 ml of 282 mM AgTFA were sequentially added to the reaction flask. Once the peak due to light scattering plasmon resonance (LSPR) in the UV–vis spectrum (Agilent Cary 50) reached ∼430 nm (∼35 min after addition of AgTFA), the reaction was quenched in an ice bath. Upon cooling, the product was collected by adding acetone to the reaction solution at a ratio of 5:1 and centrifuging at 6,000 rcf for 10 min. The resulting pellet was purified twice with H2O and collected by centrifugation at 20,000 rcf for 10 min and resuspended in 10 ml of H2O for future use.
Figure 1A depicts a transmission electron microscopy (TEM, JEOL JEM-1011, with an accelerating voltage of 100 kV) image of the resulting nanoparticles, with mostly a cubic shape. The size distribution Fig. 1B was obtained by analyzing the TEM image and is indicative of relatively uniform size of 33.8 ± 2.9 nm. The hydrodynamic diameter of these nanoparticles measured by dynamic light scattering (DLS, Brookhaven ZetaPALS) in aqueous solution was on average of 89.0 nm with the polydispersity index (PDI) of 0.198. The DLS measurements reflect the size of these nanoparticles in aqueous solution and relatively small PDI value suggests that the sample was quite uniform which agrees with the TEM results. The concentration of AgNCs in the aqueous stock solution was measured by flame atomic absorption spectroscopy (AAS, GBC 932) to be 1.5 ppm.
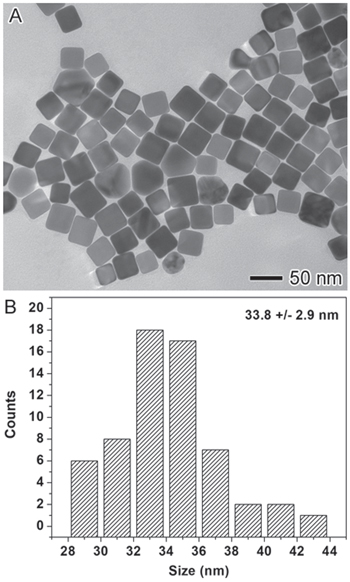
Figure 1. (A) TEM image and (B) size distribution of in-house synthesized PVP-capped AgNCs.
Download figure:
Standard image High-resolution imageSynthesis and characterization of round silver nanoplates
The AgRNPls were synthesized using a modified method previously reported. 57 Briefly, 24.14 ml of ultrapure water, aqueous solutions of silver nitrate (0.05 M, 50 μl), sodium citrate (75 mM, 0.5 ml), PVP (Mw = 8,000 g mol−1, 17.5 mM, 0.1 ml) and H2O2 (30 wt%, 30 μl) were subsequently added in a 50 ml round-bottom flask and vigorously stirred at room temperature in air. Sodium borohydride (NaBH4, 100 mM, 50 μl) was then injected immediately into the reaction mixture. The solution turned to a deep-yellow color at 5 min due to the formation of small silver nanoparticles. The color of the solution changed from yellow to deep purple at 30 min indicating the formation of AgRNPls. The reaction was allowed to proceed for 2 h. The product was collected by centrifuging at 20,000 rcf for 10 min, purified with ultrapure water twice by centrifugation, and redispersed in ultrapure water for further use.
Figure 2 shows the TEM image and UV–vis spectrum of the as-synthesized AgRNPls. The average lateral size of AgRNPls was measured to be 24.1 ± 2.4 nm with the thickness of 3.6 ± 1.5 nm. The UV–vis spectrum of the sample exhibits an extinction peak at 555 nm which agrees well with the LSPR of AgRNPls.
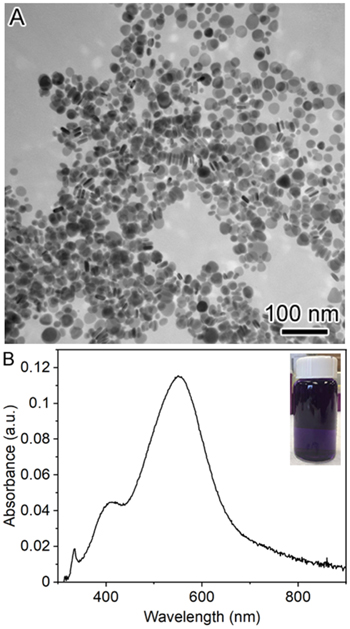
Figure 2. (A) TEM image and (B) UV-Vis spectrum of in-house synthesized PVP-capped AgRNPls. The inset in (B) is a photograph of a vial containing the sample of AgRNPls dispersed in aqueous solution (deep purple color).
Download figure:
Standard image High-resolution imageExperimental setups for electrochemical studies
Single nanoparticle oxidation experiments were performed in either 50 mM KOH or 50 mM KNO3 electrolyte, using a 10 μm diameter Pt disk working electrode (WE) and a Pt wire counter electrode (CE). (These solutions were not degassed.) A Pt WE was used mainly out of convenience and the ability to achieve reproducible electrochemical responses. However, as is evident in the raw data herein, a Pt microelectrode produces a relatively high background current presumably due to water oxidation. This would not be expected for another material like a carbon fiber or gold that has poorer catalytic properties. Nonetheless, the electrochemical responses from the AgNPs impacts on Pt—both the silver oxidation spikes and the current steps that trails them—are clearly distinguishable over this background and easily analyzed.
Homemade silver/silver chloride (Ag/AgCl) reference electrodes (RE) containing 3 M KCl for studies in KNO3 solutions and saturated KCl for studies in KOH solutions were equipped with a conductive agar junction to prevent contamination of nanoparticle solutions with chloride. To prepare the agar junction, agar powder was added to 50 mM KNO3 in an oil bath heated to ∼90 °C and stirred until the consistency began to thicken. The agar/KNO3 was then drawn into a trimmed glass pasture pipette and left to set at room temperature. Only junctions that resulted in a firm, uniform gel were used.
Prior to all electrochemical experiments, the working electrode was polished using MasterMet2 polish for 2 min, then with only water on a MasterTex polishing pad for 2 min to remove residual polish from the electrode surface. The platinum CE wire was scrubbed with a damp Kimwipe. A total of 200 μl of suspension of approximately 30 pM AgNPs in the electrolyte was prepared in a shortened 1.5 ml Eppendorf microcentrifuge tube, which served as the electrochemical cell and was immediately used.
Prior to each set of nanoparticle experiments with a freshly cleaned microdisk electrode, ten chronoamperometry (CA) experiments in a blank solution of either 50 mM KNO3 or 50 mM KOH (without nanoparticles) were performed to confirm that no anodic current spikes could be observed from possible contamination of AgNPs that may have carried over from previous experiments. If current spikes were observed, the cleaning procedure and evaluation in blank electrolyte were repeated. Studies with AgNPs were only performed when all CA responses in the blank showed no evidence of particle contamination. Only then could we be certain that anodic current spikes in solutions containing AgNPs were solely from the AgNPs being investigated. Agar junctions and the electrochemical cell were not reused for new experiments to avoid contamination of AgNPs from prior experiments.
CA in suspensions of AgNPs in electrolyte at a microelectrode was performed to obtain the anodic current responses of the individual particles. These experiments were performed using an npi VA-10X voltammetric amplifier (npi electronic GmbH, Germany) paired with an analog-to-digital converter, which used a low-pass 8-pole Bessel filter with a cutoff frequency of 5 kHz, as it has been previously shown to largely preserve the signal shape of a very brief current spike. 58 The response of the potentiostat was tested via the procedure previously described by Kanokkanchana et al. 58 Briefly, a function generator was connected to a 1 pF capacitor, which was connected to the potentiostat and the voltage was ramped for 0.5, 1, or 2 ms. The recorded signal width and height were measured and compared with the expected values. Sampling rate of 30,000 and 50,000 Hz for the single particle experiments were used in KNO3 and KOH solutions, respectively.
The instrument was held at 110 mV between all CA experiments. In KNO3 solution for each group of AgNPs, a CA experiment was stepped from 110 mV (where 1 s of data was collected) to 1500 mV or 1650 mV and held for 10 s. In KOH solution, CA were performed by stepping from 110 mV to 900 mV or 1000 mV and held for 10 s.
All experiments were completed within 15 min of introducing the electrolyte into the nanoparticle suspension to minimize the likelihood of particle agglomeration and aggregation. After data collection, the anodic current responses were analyzed using SignalCounter 8, a software kindly provided by Dario Omanovic, Ruder Boskovice Institute, Zagreb, Croatia.
Cyclic voltammetry of drop-cast particles was performed using a PalmSens4 potentiostat (PS4, Houten, The Netherlands), a 2 mm Pt disk working electrode (CH Instruments Inc., Austin, TX), Pt flag counter electrode, and Ag/AgCl (saturated KCl) reference electrode equipped with a conductive agar junction. A volume of 2 μl of stock particles was drop-cast onto the electrode and dried under a gentle nitrogen flow. Once the electrode was visibly dry, it was immersed into 50 mM of electrolyte (KOH or KCl) and cyclic voltammetry was performed at 25 mV·s−1. To minimize the likelihood of any cathodic activity resulting from the silver particles, the starting potential was set to 0 mV when using the KOH solution and 100 mV when using the KCl solution. (These solutions were not degassed).
Results and Discussion
Analysis of the anodic current responses and coulometry of the AgNPs in 50 mM KNO3
CA was performed at both 1500 mV and 1650 mV for suspensions of different AgNPs in 50 mM KNO3, as oxidation peaks were most consistently obtained for the particles at potentials of 1500 mV and above. Representative single particle anodic current responses obtained for each particle type at 1650 mV are depicted in Fig. 3. There is a sharp current spike upon contact of the particle with the electrode, followed by a step in the baseline of the current that tails off relatively slowly with time. This spike-step response is different than responses observed at smaller overpotentials during oxidation of citrate- and PEG-capped AgNSs, where a step is not observed. 16,19,20,22 Rather, only a single sharp peak or sometimes multiple sharp peaks for the same particle occur and one electron is transferred per silver atom (n = 1). Assuming a certain value of n for the faradaic process and that no substantial charging occurs, the area under the current spike, which is the charge transferred during the oxidative impact, can be used to directly calculate the number of silver atoms that were oxidized. Furthermore, by assuming a specific particle geometry (e.g. sphere, cube, triangular or round plate), this coulometric measurement can lead to an estimation of the size of that particle. 19 The presence of the step in the current response complicates this analysis. The spike-step behavior has been observed previously by the group of Zhang and attributed by the group of Willets to the oxidation of Ag to AgOx nanoclusters, and subsequent water oxidation catalyzed by the newly formed AgOx nanoclusters. 43,52 However, a quantitative analysis of the different contributions from silver and water oxidation to the current response has not yet been investigated.

Figure 3. CA responses in 50 mM KNO3 at 1650 mV vs Ag/AgCl (3 M KCl) with an agar junction. (A) Citrate-capped 29 nm (red), 51 nm (black), and 73 nm (blue) AgNSs; (B) PVP-capped 34 nm AgNCs (blue-green), ∼53 nm × ∼10 nm AgTNPls (yellow), and 29 nm AgNSs (gray). The three insets in each of (A) and (B) are representative anodic current responses for a single nanoparticle of each type. Particles with a greater silver content produced a larger step above the baseline current after the spike. Experiments were performed using a 10 μm Pt microdisk electrode.
Download figure:
Standard image High-resolution imageHere, the immediate spike in current was analyzed separately from the increase in the baseline (or step height). The area under the current spike was attributed to the direct particle oxidation and integrated to determine the charge passed (Table I).
Table I. Comparison of measurements (average ± one standard deviation) obtained from anodic current responses of single nanoparticle electrochemistry of different particle types at 1650 mV vs Ag/AgCl (3 M KCl) with agar junction in 50 mM KNO3.
| Particle Type a) | Surface area/volume (nm−1) | Peak Height (nA) b) | Peak Duration (ms) b) | Charge (pC) b) | Peak height/charge (s−1) b) |
|---|---|---|---|---|---|
| 29 nm c) Citrate-AgNS | 0.21 | 1.18 ± 0.62 | 1.0 ± 0.4 | 0.37 ± 0.31 | 4110 ± 1340 |
| 51 nm c) Citrate-AgNS | 0.12 | 2.12 ± 1.33 | 2.6 ± 1.3 | 1.04 ± 0.63 | 2380 ± 1250 |
| 73 nm c) Citrate-AgNS | 0.082 | 5.03 ± 2.53 | 3.9 ± 3.4 | 3.08 ± 1.69 | 1750 ± 710 |
| 29 nm PVP-AgNS | 0.21 | 0.79 ± 0.37 | 0.9 ± 0.5 | 0.24 ± 0.24 | 3730 ± 1330 |
| 34 nm PVP-AgNC | 0.18 | 1.39 ± 0.79 | 1.3 ± 0.8 | 0.46 ± 0.26 | 3160 ± 1320 |
| ∼53 nm × ∼10 nm PVP-AgTNPl | 0.33 | 0.33 ± 0.15 | 0.6 ± 0.3 | 0.06 ± 0.03 | 6850 ± 4220 |
a)Characteristic length based on TEM analysis: average diameter for a sphere and average side for a cube; average side for an equilateral triangular plate and thickness. b)Averages and standard deviations were obtained from N number of particles, where N = 30–126. c)These TEM data are reported by the manufacturer nanoComposix.
The step height associated with each electrochemical response was attributed to the catalyzed water oxidation on the newly-formed AgOx nanoclusters. The enhanced water oxidation made possible by these single particle events over the underlying oxidative background of the Pt microelectrode is intriguing. It was observed that larger AgNPs produced bigger average step heights. This trend is consistent with observations made by Zhang et al. 43 who reported a similar trend of particle size with step height and duration of the tail, but using citrate-capped AgNSs on a gold microelectrode in a KNO3/citrate buffer solution at different pHs. The distributions of step heights that we obtained for citrate- and PVP-capped AgNSs as well as for the PVP-capped AgNCs in 50 mM KNO3 at the Pt microelectrode are shown in Fig. 4A. The most frequent step height for the citrate-capped 51 nm AgNS and the PVP-capped 34 nm AgNCs was ∼200 pA, which is similar to the average step height (243 pA) at 1100 mV for the 40 nm AgNSs of Zhang et al. Dividing the step height (in Amperes) by the total charge passed within the spike (in Coulombs) produces a ratio (in s−1) that can quantify this water-catalysis/NP-size relationship. The resulting distributions are shown in Fig. 4B. The distribution of step-height for the 73 nm citrate-capped AgNSs narrowed substantially when normalized to the charge passed under the spike. In contrast, the initial narrow distributions of step-height for the 29 nm citrate and PVP-capped AgNSs broadened when normalized. This may be a consequence of the difficulty in reproducibly measuring the smaller step heights for the smaller particles. The PVP-capped AgNCs and AgNSs yielded normalized step-height distributions with a slightly higher step-height-to-spike-area ratio than the citrate-capped AgNPs. More studies would be desirable to substantiate this observation. The oxidation of the AgTNPls did not result in a measurable step above the baseline (likely becuase they contain far less silver than the other AgNPs), and thus, they were not included in this discussion.

Figure 4. Distributions of (A) step height and (B) step height normalized to spike area from individual anodic responses for citrate-capped 29, 51, and 73 nm AgNSs and PVP-capped 29 nm AgNSs and 34 nm AgNCs. Experiments were performed in 50 mM KNO3 at 1650 mV vs Ag/AgCl (3 M KCl) with an agar junction.
Download figure:
Standard image High-resolution imageIt is likely that the current spikes occurring at large overpotentials represent a combination of the formation of Ag (I), higher ordered silver oxide complexes (AgOx), 48,49,59,60 and oxygen (from water oxidation). 43,52 To perform the quantitative analysis in a consistent way, a line was drawn from the start of the spike where it rose from the current baseline to the spike's other side where it intersected with step. Figure 5 illustrates this line that defines the base of a spike. The area under the spike and above this line is used in discussions here concerning the charge passed to oxidize the silver in the nanoparticle. We name the difference in time where the line intersects the sides of the spike the "peak width" and relate it to the rate at which the charge is transferred during the oxidation.

Figure 5. Examples of anodic spike-step responses produced during CA. The oxidations occurred at a 10 μm Pt microdisk electrode in a solution containing citrate-capped, 73 nm AgNSs in 50 mM KNO3 at 1650 mV vs Ag/AgCl (3 M KCl) with an agar junction. The bottom panel (B) is an expanded view of the second peak in the top panel (A) showing where a line is drawn at the base of the spike, above which current is integrated for coulometric determination of the number of atoms in the particle and from which size is obtained. The difference of the times (final x - initial x) at which this line intersects the beginning and end of the spike is considered the "duration time." It is assumed that the spike is due to silver oxidation and the step is due to water oxidation, which tails off, decreasing with the diminishing presence of the silver oxide.
Download figure:
Standard image High-resolution imageThe integration of the area under the current spike was used to investigate if the oxidation of silver is the primary reaction occurring during that event. Thus, the charge passed during the current spike is useful for estimating the size of the AgNPs. Equations 1 and 2 were used to estimate the radius (rns ) of the AgNSs and the edge length (lnc ) of the AgNCs, respectively.


where Q is the charge passed under the current spike, F is the Faraday constant, n is the number of electrons transferred per Ag atom, NA is Avogadro's number, and ρ2 is the number density of silver, 5.86 × 1028 m−3. Because several different oxidation states of silver may be generated in KNO3 solution, the nanoparticle size was calculated with an n value of 1, 10/7, 49 10/6, 59 and 2; the results of which are summarized in Table II, along with the sizing results from TEM measurements. Results for the AgTNPl sample, which has a very large distribution of nanoparticle sizes and shapes, are excluded from Table II).
Table II. Comparison of sizes (average ± one standard deviation) determined from TEM analysis and from coulometry of anodic current responses from single nanoparticle electrochemistry of different particle types at 1500 mV and 1650 mV vs Ag/AgCl (3 M KCl) with agar junction in 50 mM KNO3 (n = number of moles of electrons per mole of silver atoms used to calculate size).
| Particle Size in Dimensions of Characteristic Length (nm) a) | ||||||
|---|---|---|---|---|---|---|
| Particle Type | TEM | 1500 mV (n = 1) b) | 1650 mV (n = 1) b) | 1650 mV (n = 10/7) b) | 1650 mV (n = 11/7) b) | 1650 mV (n = 2) b) |
| Citrate-AgNS | 29 ± 3 c) | — | 39 ± 10 | 35 ± 8 | 33 ± 8 | 31 ± 8 |
| Citrate-AgNS | 51 ± 6 c) | — | 57 ± 11 | 51 ± 10 | 49 ± 9 | 45 ± 9 |
| Citrate-AgNS | 73 ± 8 c) | 27 ± 3 | 83 ± 15 | 74 ± 13 | 71 ± 13 | 66 ± 12 |
| PVP-AgNS | 29 ± 3 | 25 ± 7 | 35 ± 7 | 31 ± 6 | 30 ± 6 | 28 ± 6 |
| PVP-AgNC | 34 ± 3 | 27 ± 5 | 36 ± 6 | 32 ± 5 | 31 ± 5 | 28 ± 5 |
a)Characteristic length: diameter for a sphere; side for a cube. b)Averages and standard deviations were obtained from N number of particles, where N = 30–126. c)These TEM data are reported by the manufacturer nanoComposix.
Integration under the current spikes obtained at 1500 mV revealed that most oxidations were incomplete, where only a few particles completely oxidized during the current spike with n = 1. In contrast, the spikes at 1650 mV contained significantly more charge and suggest total oxidation, as well as additional chemistry occurring within the current spike. The populations of each particle type contained a slightly larger charge than anticipated for the formation of Ag(I), indicating the possibility of catalysis of water oxidation 43,47,52,53 or higher ordered AgOx 61,62 contributing to the measured charge.
The TEM-measured length of PVP-AgNCs (34 ± 3 nm) can be compared to the electrochemically-determined lengths obtained for different values of n at 1650 mV: of 36 ± 6 nm, (n = 1) 32 ± 5 nm (n = 10/7), 31 ± 5 nm (n = 11/7), and 28 ± 5 nm (n = 2). An average oxidation state of silver cannot be conclusively determined from making this comparison. When n = 1, a size greater than that obtained by TEM is determined and when n = 2, the size is smaller. Thus, a mixed-valence state complex that includes both Ag(I) and Ag(II) or silver oxynitrate is possible.
Interestingly, the step current is larger for the citrate-capped AgNSs compared to the PVP-capped AgNSs. Because PVP preferentially binds to the (100) facet of silver, 29 it is reasonable to assume that cubes contain a more uniform coating of PVP than the spheres, resulting in an even greater slowing of water oxidation for the cubes. This suggests that the presence of PVP on the particle surface decreases the contribution of water oxidation to the transferred charge, allowing the current spike to be more representative of the nanoparticle size for PVP capped AgNPs than citrate-capped AgNPs and for PVP-capped AgNCs than for PVP-capped AgNSs. Note that oxidation of agglomerated or aggregated nanoparticles could also explain the larger spike charge, yet sizing of the nanoparticles by DLS in the used electrolyte did not indicate that this had occurred under the experimental condition within the duration of the measurement sets. To further rule out aggregation that might take place in electrolyte, which diminishes electrostatic repulsions between particles, Fig. S1 (available online at stacks.iop.org/JES/169/056508/mmedia) of the Supporting Information contains TEM images and normalized UV-Vis spectra of suspensions of PVP-capped AgNCs in water and 50 mM KCl (both before and after electrochemical analysis). The AgNCs are well separated on the TEM images, indicating that their corresponding suspensions ought to be well-dispersed and the peak positions at 417 nm and full widths at half maximum are essentially unchanged.
Analysis of the anodic current response and coulometry of the AgNPs in 50 mM KOH
Electrochemical characterization of PVP-capped AgNSs drop-cast onto an electrode was performed to obtain a preliminary evaluation of electrochemical oxidation of these particles in solutions of KCl and KOH. Figure 6 compares the anodic stripping voltammetry for equal amounts of drop-cast silver nanoparticles in these two electrolytes. In the presence of KCl, there is no evidence of particle oxidation. The cathodic peak near −0.1 V is likely due to the reduction of oxygen. In contrast, there are two anodic stripping peaks for the drop-cast particles in the presence of KOH. Firstly, these conditions appear to provide an environment that allows electrochemical access through the PVP-capping ligand to the underlying AgNPs. Secondly, the CV results suggest multiple forms of oxidized silver for the nanoparticles may form under these conditions depending on the applied potential. Droog and Hjuisman observe two distinctive anodic peaks in a CV response at a polished silver electrode in 1 M NaOH due to the formation of Ag2O and AgO, respectively. 46 They also describe that oxidation of the electrode at 900 mV (vs Ag/AgCl (3 M KCl)) to Ag (II) via chronoamperometry occurs in a multi-step process. We attribute the peaks in Fig. 6 at 380 mV and 700 mV for the drop-cast PVP-capped AgNSs in 50 mM KOH to the formation of Ag2O and AgO, respectively. In a 50 mM KOH suspension of the PVP-capped AgNPs, however, we observed single particle oxidations at 900 mV. Lower potentials yielded few peaks. Potentials higher than 1000 mV exhibited an oxidative step, similar to the peaks observed in the KNO3 solution at 1650 mV.
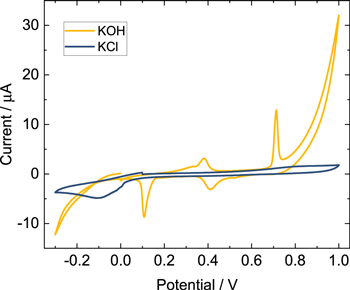
Figure 6. CV of drop-cast depositions of PVP-capped AgNSs on a 2 mm Pt disk electrode in 50 mM KOH (yellow) and 50 mM KCl (blue) at a scan rate of 25 mV·s−1. The CV scans began at 0 mV for the KOH solution and at 100 mV for the KCl solution, then anodically swept to 1000 mV, cathodically swept to −300 mV and then swept back to the starting potential (vs Ag/AgCl (saturated KCl) with an agar junction). (These solutions were not degassed).
Download figure:
Standard image High-resolution imageFigure 7 shows typical anodic current responses for oxidation of individual PVP-capped AgNSs, AgRNPls, and AgNCs in 50 mM KOH at 900 mV. Unlike in 50 mM KNO3 solution, oxidative spikes for these kinds of particles are readily observable at this potential. Also, there is very little evidence of a step from water oxidation. Consistent with this is the much lower background current at the Pt microelectrode (≤2 nA) than was observed at the large overpotentials in the KNO3 solution in Fig. 3 (≤20+ nA). Therefore, data analysis of spikes involving PVP-capped AgNPs at 900 mV in 50 mM KOH should be more reproducible in comparison to that from the KNO3 studies. (Note that a limited number of studies were performed at 1000 mV in 50 mM KOH, but because of the underlying current step, the main focus was on 900 mV).
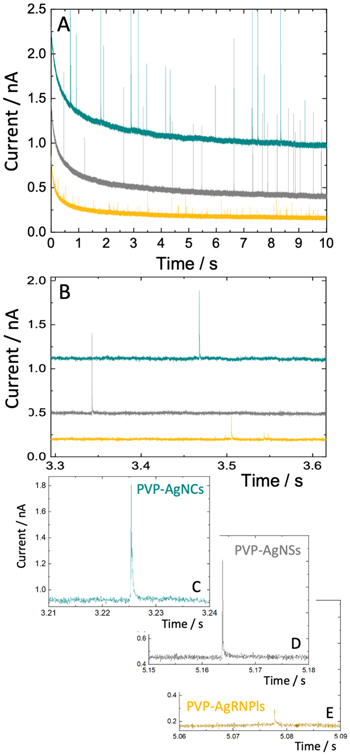
Figure 7. CA of PVP-capped AgNCs (blue-green), AgNSs (gray) and AgRNPls (yellow) in 50 mM KOH using a 10 μm Pt working electrode held at 900 mV vs Ag/AgCl (saturated KCl) with an agar junction. (A) The full 10 s CA response. (B) An expanded view over a 0.3 s interval from 3.3 to 3.6 s. (C, D, and E) Representative examples of a peak for a single nanoparticle of each type of geometry. The scale for each plot is the same, where the range for the ordinate is 1 nA and that for the abscissa is 0.03 s. Note that these peaks exhibit little to no step above the baseline current following the anodic spikes.
Download figure:
Standard image High-resolution imageThe average integrated charge for current spikes in the 50 mM KOH solution at 900 mV was 0.17 ± 0.08 pC for 39 nm PVP-capped AgNSs and 0.24 ± 0.15 pC for 39 nm citrate-capped AgNSs. These values are expected when full oxidation of the Ag atoms in the nanoparticle form Ag(I). Table III summarizes the particle sizes that were calculated using Eqs. 1 and 2 for the radii of AgNSs and side lengths of AgNCs, respectively, and Eq. 3 for the radii of AgRNPls, rrnpl , where the height, h, was determined from TEM. For all of these calculations, n = 1 was used.

Table III. Comparison of sizes (average ± one standard deviation) determined from TEM analysis and from coulometry of anodic current responses from single nanoparticle electrochemistry of different particle types at 900 mV and 1000 mV vs Ag/AgCl (saturated KCl) with agar junction in 50 mM KOH (n = number of moles of electrons per mole of silver atoms used to calculate size).
| Particle Size in Dimensions of Characteristic Length (nm) a) | |||
|---|---|---|---|
| Particle Type | TEM | 900 mV (n = 1) b) | 1000 mV (n = 1) b) |
| Citrate-AgNS | 39 ± 5 c) | 35 ± 6 | — |
| PVP-AgNS | 39 ± 4 | 32 ± 5 | 31 ± 4 |
| PVP-AgNC | 34 ± 3 | 33 ± 11 | 33 ± 10 |
| PVP-AgRNPl | 24 ± 2 | 28 ± 8 | — |
a)Characteristic length: average diameter for a sphere; average side for a cube; average diameter for a round plate having a thickness of 3.6 ± 1.5 nm b)Averages and standard deviations were obtained from N number of particles, where N = 112–170. c)These TEM data are reported by the manufacturer nanoComposix.
Equation 4 depicts the chemical reaction that is most likely to occur during the current spike based on the observed results.

These results contrast with previous results reported by Hafez et al. 54 in which integration of single oxidative impacts of 40 nm AgNSs in alkaline solution resulted in an average 0.34 ± 0.03 pC charge, indicating a 2 e− transfer per Ag atom. Furthermore, CV of AgNSs dropcasted on a gold electrode suggests a transition to Ag(II) at approximately 0.35 V vs a Ag/AgCl wire reference electrode, almost immediately following the initial oxidation to Ag(I) at approximately 0.2 V. The system used by Hafez et al. involved a phosphate buffer, which might explain the differences between their observations and ours. 63 Because the CV response in Fig. 6 for dropcast PVP-AgNPs in KOH exhibits two distinct oxidation peaks, a one-electron transfer during single silver nanoparticle oxidation in 50 mM KOH is plausible.
Compared to the average TEM diameter reported by the manufacturer of 39 ± 4 nm, the electrochemical sizing of the PVP-AgNSs in 50 mM KOH at 900 mV revealed a smaller size of 32 ± 5 nm. Considering that sizing via TEM assumes a perfect sphere, these results are unsurprising. Previous groups have reported that silver nanospheres are generally more icosahedral in shape, and only approximately 60% of the expected charge, assuming a perfect sphere, is actually present in the imperfectly spherical particles. 64 Analysis of PVP-AgNCs further indicated that complete oxidation was occurring in 50 mM KOH at 900 mV, as the electrochemically-determined size of 33 ± 11 nm is comparable to the TEM-determined size of 34 ± 3 nm. Because nanocubes possess a more well-defined volume, TEM may provide a better estimation of their metal content than for spheres. Electrochemical analysis of PVP-AgRNPls was also performed in 50 mM KOH. The thickness of the plates based on the TEM images (3.6 ± 1.5 nm) was used in the calculation of their diameters from the electrochemical data. The resulting average diameter obtained from the electrochemical method is within a standard deviation of that from TEM.
Relationship of coulometry (charge) to the duration of anodic peak response of AgNPs
The influence of the shape of AgNPs on the individual oxidative response at an electrode will most likely be present in a measurement that reflects its kinetic behavior, where the influence of surface area to volume ratio could play a role. A large difference in this ratio exists for plates when compared to spheres, for example. Several groups have shown that observing the total duration (peak width), tmax , or maximum peak height of single spikes is a powerful tool for analyzing the kinetics of single particle oxidation as long as the peak shape is properly preserved. 40,42,65 Additionally, the peak duration can also be affected by multi-step oxidation, wherein the particle partially or completely loses and restores contact with the electrode at a very rapid pace, often more rapidly than the sampling interval. 20,66,67 The instrumentation used to apply the voltage step and acquire the current response was carefully evaluated here (see Experimental section) to avoid missing these events.
Peak widths inherently depend on kinetics and particle size. Kätelhön et al. 40 developed a model for the dependence of peak duration for the electrodissolution of nanospheres under kinetically (electron transfer)-limiting and solubility-limiting conditions. Under the "kinetically-limiting" model, the rate is directly proportional to the surface area of the particle, and the rate constant, k, is a function of the applied electrode potential. An expression for tmax was derived to be

For the other case, such as at large overpotentials where the release of species from the nanosphere is limited by their solubility and mass-transport away from the particle, the following expression was obtained,

where D is the diffusion coefficient, and Cmax is the maximum solubility-allowed concentration.
Because the radius of the particle can be calculated from the integrated area under the current spike 19 (i.e. the charge, Q, passed during oxidation of the nanoparticle), as in Eq. 1, tmax must also depend on Q. Replacing rns in Eqs. 5 and 6 with the expression for rns in Eq. 1, yields mathematical relationships where tmax is proportional to Q1/3 and Q2/3 , respectively. Below, we show that there is a strong correlation between tmax and Q2/3 , and thus the latter model, not the "kinetically-limiting" one, is supported by our data. The full equation resulting from this substitution in Eq. 6 is

Generalizing the relationship for other geometries, where a represents a generic shape-dependent factor, yields Eq. 8,

These equations do not account for shapes that are different than nanospheres, however. How non-spherical particles contact the electrode may further affect the anatomy of the electrochemical response. Their orientation will be determined by random rotation as well as alignment within the strong electric fields in the double layer at the electrode surface. If we consider only random rotation, the cubes and triangular plates most likely approach the electrode with a corner at the forefront. For a perfect cube, there are three basic surface types: a face, an edge, and a corner. The cube has only six orientations in space for the face to be perfectly parallel to a flat electroactive region of the electrode and be the contacting surface. Any rotation will place an edge or a corner into contact with the electrode. For an edge to be in contact, there are only 12 possible orientations and any minute rotation will put the face or corner into electrode contact. However, if the cube is diffusing toward the electrode and a corner is exactly perpendicular to the electrode surface, the corner will remain the primary contacting surface until the cube rotates 35.3° and 54.7° for an edge or a face to contact the electrode, respectively. Similar logic can be applied to the triangular nanoplates. The primary contact for the round nanoplates is expected to begin at the "rim" of the plate. The roughness of the electrode's surface will also play a role in encounters with nanoparticles having different shapes. If the roughness of the electrode surface is on a similar length scale as the nanoparticle, reverse arguments can be made. A cube's face is then more likely than the cube's corner to encounter protruding features at the electrode surface. As discussed further below, we did not observe a measurable effect for our experimental conditions of nanoparticle shape on spike widths for oxidative impacts.
Duration of anodic peak response of AgNPs in 50 mM KNO3
The widths of the anodic spikes obtained at 1650 mV in 50 mM KNO3 were measured as an indicator of duration of the silver oxidation event for citrate-capped 29 nm, 51 nm, and 73 nm AgNSs, and PVP-capped 29 nm AgNSs, 34 nm AgNCs, and ∼53 nm × ∼10 nm AgTNPls. Table I summarizes the averages of duration for the different particle populations. Plots of average peak width vs the average Q2/3 and vs the average Q for each particle data set are shown in Fig. 8. The linear correlation (R2 ) for the plot for all nanoparticles vs Q2/3 is 0.9636, a slight improvement compared to the plot vs Q at 0.9188. This supports the hypothesis that the total time required for oxidation is more likely related to Q2/3 , with no obvious correlation to the particle shape. Figure 8A provides this representation for all PVP-capped AgNPs (red dashed line) in comparison to all citrate-capped AgNSs (gray dashed line).

Figure 8. Evaluation of the relationship of the average anodic spike width (duration), which is also defined as the duration of the oxidation, and the average of the total integrated current (the charge passed during oxidation, in coulombs) under the spikes for the entire population for each of the six types of particles: three different sizes of citrate-capped AgNSs (black and gray circles) and the three different shapes of PVP-capped nanoparticles (AgNS (white circle), AgTNPl (yellow triangle) and AgNCs (blue square)). In (A), the charge is raised to the power of 2/3. The least squares best fit line for all of the points is (line not shown): y = 1.78(±0.17) × 108 (ms/C2/3)x + 0.30(±0.18) (ms), R2 = 0.9636; for only the PVP-capped AgNPs is (red dashed line): y = 1.61(±0.08) × 108 (ms/C2/3)x + 0.35(±0.03) (ms), R2 = 0.9975; for only the citrate-capped AgNSs is (gray dashed line): y = 1.72(±0.45) × 108 (ms/C2/3)x + 0.43(±0.63) (ms), R2 = 0.9347. In (B) the charge is to the power of 1. Single particle oxidation was performed in 50 mM KNO3 at 1650 mV vs Ag/AgCl (3 M KCl) with an agar junction.
Download figure:
Standard image High-resolution imageA linear model fits peak width vs Q2/3 for the three different shapes of PVP-capped particles alone and exhibits an even higher degree of correlation (0.9975). This more firmly demonstrates that at 1650 mV, the spike duration is dependent on the total charge passed during oxidation, independent of the particle shape. This means that shape and surface area are less important in the mechanism of AgNP oxidation than the total number of atoms. The linearity also further supports the hypothesis that water oxidation is less likely to occur within the spike of a PVP-capped particle than a citrate-capped particle, resulting in a more reproducible reaction at the electrode surface for those particles. It is proposed that the rapid formation of AgOx particles and subsequent water oxidation occurring during the ∼1 ms current spike contributes to the deviation from linearity exhibited by the citrate capped AgNPs, as other investigators have suggested, i.e. the pattern of new AgOx nanocluster formation is poorly controlled 52 which means the current produced from water oxidation within the spike would not be consistent from one oxidative impact to another. Because each sample of a given type of particle consists of a distribution of sizes, it is informative to plot the distribution of the peak width for each particle as a function of its own Q. This is done in Fig. 9 for citrate-capped and PVP-capped AgNSs of similar sizes. The capping ligand does not appear to have a significant effect on the overall rate of oxidation, i.e. a charge of x requires a y amount of time to transform all the atoms in the nanoparticle.
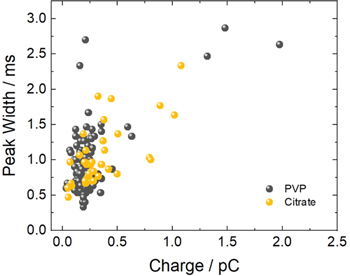
Figure 9. Evaluation of the relationship of the anodic peak width (duration) to the total charge passed during oxidation for each particle analyzed in two different populations: the PVP-capped 29 nm AgNSs (gray) and citrate-capped 29 nm AgNSs (yellow). Single particle oxidation was performed in 50 mM KNO3 at a 10 μm Pt microdisk electrode held at 1650 mV vs Ag/AgCl (3 M KCl) with an agar junction.
Download figure:
Standard image High-resolution imageAt 1650 mV, the peak duration was 0.9 ± 0.5 ms and 1.3 ± 0.8 ms for the 29 nm PVP-capped AgNSs and 34 nm PVP-capped AgNCs, respectively. At 1500 mV (not listed in the tables), the peak durations were slightly longer, at 1.2 ± 0.7 and 2.4 ± 1.7 ms, respectively. This parallels our previous observations in KCl solutions. 42 This work indicated an increase in peak duration with an increase in potential between 500 mV and 660 mV in the presence of KNO3, attributed to the release of Ag+ in the absence of chloride causing repulsion of the particle from the electrode surface resulting in a rapid multi-step oxidation. 42 The return to a pattern of decreasing peak duration with increasing potential further supports the hypothesis that silver oxide species are formed rapidly in the 1500–1650 mV potential range, diminishing repulsion of free Ag+ from the positively polarized electrode surface, and thereby decreasing the occurrences of multi-step oxidations.
Duration of anodic peak response of AgNPs in 50 mM KOH
Figure 10 shows a plot of peak width as a function of Q2/3 for the PVP-capped particles of three different shapes that were analyzed in KOH at 900 mV. A linear model fits the data quite well, with R2 = 0.9973. This linear relationship parallels that which was found in the KNO3 solution at the large overpotentials for populations of different shapes of PVP-capped AgNPs. However, the slope of the line in Fig. 10 for the KOH solution (2.96 (±0.15) × 108 (ms/C2/3) ), is 1.8x that for the KNO3 solution (1.61(±0.08) × 108 (ms/C2/3)), which is due to the increased time for oxidation that occurs in the more alkaline solution. The lower solubility of Ag2O(s) at the higher pH 68 may be one reason for the longer peak duration that is consistent with the model expressed by Eq. 8, but other mechanisms are also possible. The corresponding y-intercept of Fig. 10 (0.47(±0.06) (ms)) in KOH is also higher than that of Fig. 8A (0.35(±0.03) (ms)) in KNO3 for PVP-capped particles. The meaning of a non-zero intercept and the information contained therein is unknown at this time. In addition, a geometric dependence, which is predicted by Eq. 8, is not supported by our data–peak widths from AgNPs having different shapes fall on the same line. A more quantitative analysis of these plots and development of a more suitable model will require further investigation. Nonetheless, the experimental results suggest that while the rate of AgNP oxidation depends on the chemistry of the solution environment, the rate of different AgNPs in that environment depends only on the amount of silver present in the particle, regardless of the shape or surface area. (The surface area to volume ratios are 0.18, 0.15 and 0.72 for the 34 nm PVP-AgNCs, 39 nm PVP-Ag NSs and 24 nm PVP-AgRNPls, respectively.)

Figure 10. Evaluation of the relationship of the average anodic peak width (duration) and the average of the total charged passed (integrated current under the peaks), raised to a power of 2/3 for the entire population for each of the three different shapes of PVP-capped nanoparticles (AgNS (light gray circle), AgRNPl (yellow circle) and AgNCs (blue square)). Single particle oxidation was performed in 50 mM KOH at a 10 μm Pt microdisk electrode held at 900 mV vs Ag/AgCl (saturated KCl) with an agar junction. Error bars represent one standard deviation. The least squares best fit line for all the points is: y = 2.96 (±0.15) × 108 (ms/C2/3)x + 0.47 (±0.06)(ms), R2 = 0.9973.
Download figure:
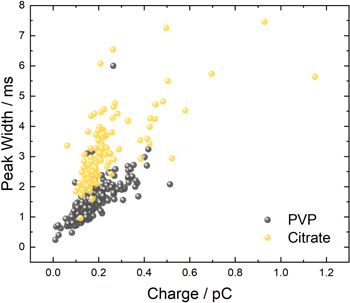
Standard image High-resolution imageThe effect of the capping ligand on the oxidation rate in the KOH solution was further addressed by considering the distribution of results for two populations of similarly sized nanoparticles, one of PVP- and the other of citrate-capped AgNSs, shown in Fig. 11. Two groupings can be clearly observed, where citrate-capped AgNSs exhibit peak widths that are ~1.7 times those of the PVP-capped AgNSs for a given charge. One possible explanation may involve an expanded structure of PVP in the KOH solution that facilitates the particle oxidation rate. The exact cause of the faster silver oxidation rate of the PVP-capped AgNSs requires further study.
Figure 11. Evaluation of the relationship of the anodic peak width (duration) to the total charge passed during oxidation for each particle analyzed in two different populations: the PVP-capped 39 nm AgNSs (gray) and citrate-capped 39 nm AgNSs (yellow). Single particle oxidation was performed in 50 mM KOH at a 10 μm Pt microdisk electrode held at 900 mV vs Ag/AgCl (saturated KCl) with an agar junction.
Download figure:
Standard image High-resolution image
Conclusions
PVP-capped AgNPs of differing shapes were analyzed via single particle oxidation at a Pt microdisk electrode at very large overpotentials (1500 and 1650 mV vs Ag/AgCl (3 M KCl with an agar junction) in solutions of 50 mM KNO3 and at diminished overpotentials (900 and 1000 mV (vs Ag/AgCl (saturated KCl) with an agar junction) in 50 mM KOH. The effect of the large PVP ligand was further investigated by comparing the electrochemical behavior with that of citrate-capped AgNSs of different sizes. Current responses were readily achievable under these conditions for the PVP-capped AgNPs despite their protective layer and thus these conditions are worthy of considering when monitoring the evolution of such particles in situ is desirable. The spike was the main focus of the spike-step current response in the KNO3, where oxidation of the AgNP occurs within the spike and water oxidation within the step. The average size of the particles determined from coulometric quantification of the spike at 1650 mV was greater than that from TEM when n = 1 (a one-electron oxidation). At 1500 mV, the size was grossly underestimated due to incomplete oxidation. Thus, at 1650 mV, although the primary electrochemical reaction involves the oxidation of Ag to Ag(I), there is a possibility that higher-ordered AgOx complexes and catalysis of water may contribute to the charge within the current spike. The protective layer of PVP diminishes contributions from the extra charge to the current spike, however, in comparison to the citrate-capped particles.
Analysis in the KOH solution at ∼900 mV showed that the formation of Ag(I) is the primary reaction occurring within the current spike. Also, the shape of the anodic response at this potential did not exhibit an underlying current step; evidence of a step became visible at 1000 mV, however. Size determination by coulometry using single particle oxidation of PVP-capped AgNCs in the KOH solution was more aligned with the TEM analysis than for the PVP-capped AgNSs presumably where the assumption of a perfect sphere will overestimate sizing by TEM compared to the electrochemistry.
The time for oxidation (the spike width) of PVP-capped AgNPs has a strong linear dependence on the total charge passed raised to the 2/3 power in both types of electrolytes and independent of the particle shape, indicating that the available surface area has little to-no influence on the reaction kinetics of silver oxidation under those conditions. In addition, although the PVP-capped AgNPs offered a more reproducible analysis of kinetics, the silver oxidation rate is so fast under the KNO3 conditions that the PVP-capping ligand does not slow the kinetics compared to the citrate ligand. However, the peak widths are substantially longer for the particles by about 1.8✕ in the KOH solution than in the KNO3 solution, which might be attributable to lower solubility of AgOx at higher pH and other mechanisms. In the KOH solution for a given particle size, however, the presence of the PVP-ligand leads to shorter peak widths and faster silver oxidation than when the ligand is citrate.
To achieve a more complete assessment of whether shape can influence electrochemical responses of oxidative impacts, additional investigations are needed. Such studies would address the electrochemical responses at lower overpotentials where kinetic limitations play a bigger role, and therefore the surface area and facets of the nanoparticles may become more important. In addition, consideration should be given to the structure of the electrode surface itself, as well as alignment of the nanoparticles within the strong electric fields at the electrode/solution interface. The latter will also be influenced by the ligands and their distributions around the nanoparticles.
Acknowledgments
J. C. S. is grateful for the Sturgis International Fellowship, a grant made possible by the generous support of the Roy and Christine Sturgis Charitable Trust. K. K. acknowledges the German Academic Exchange Service (DAAD) for a doctoral scholarship. K.T. acknowledges financial support from the European Research Council (ERC) starting grant under the European Union's Horizon 2020 research and innovation programme (MITICAT; grant agreement no. 949724). This work was also funded by the Deutsche Forschungsgemeinschaft (DFG, German Research Foundation) under Germany's Excellence Strategy—EXC-2033—Projektnummer 390677874 and Arkansas Biosciences Institute, a major research component of the Arkansas Tobacco Settlement Proceeds Act of 2000. Partial support from the National Science Foundation (CMI-1808286, CBET-1703827, CBET-1826642) is also acknowledged.