

Abstract
To overcome the low faradaic efficiency (FE) of single Mo or Fe based electrocatalysts in nitrogen reduction reactions (NRR) due to the competition from the hydrogen evolution reaction (HER), a series of bimetallic MoFe compound catalysts were prepared under an NH3 atmosphere through a facile precipitation-pyrolysis method. The formed tetravalent Mo was found to be capable of inducing better electronic interactions between the surface nitrogen species and the Fe metal groups, thus improving the FE. It was demonstrated that the prepared ternary MoFe-N catalyst exhibited a remarkable FE of 33.26 % and a high NH3 yield rate of 33.31 μg h−1 mg−1cat. for NRR, which was believed to have been caused by an obvious change in the valence of Mo that resulted in a lower HER activity. X-ray photoelectron spectroscopy analysis further revealed that thermal processing under an NH3 atmosphere formed the Mo(IV) active sites in Mo–N bond, which led to a significant suppression in HER activity. Finally, through the study of the surface hydrogenation mechanism, it was concluded that the synergistic effect of the adsorbed H* and Mo active sites was the main reason for the improved performance of NRR.
Export citation and abstract BibTeX RIS
Since its creation in the 1930s, the Haber-Bosch (H-B) process has been the main method used for industrial NH3 production; however, its harsh reaction conditions (300 °C ∼ 500 °C, 150 ∼ 250 atm) and high CO2 emissions make it unsustainable and not environmentally friendly. 1,2 Consequently, the electrochemical synthesis of NH3 using renewable energy as the energy input and the hydrogen from water as the proton source has been receiving more and more attention, and is considered a promising alternative to the H-B process. 3 However, there are two major challenges associated with the nitrogen reduction reaction (NRR) in aqueous media 4 : (1) how to efficiently activate the ultra-stable N≡N bond (941 kJ mol−1); and (2) how to improve the Faradaic efficiency (FE) of the NRR process. To solve the first challenge, catalysts with high activity, strong N2 adsorption ability, and strong N≡N activation are required. 5 Although some noble metals, such as Ru, 6 Au 7 and Pd, 8 exhibit excellent NRR activity, their high cost has restricted their large-scale applications. 9,10 Thus, other catalysts such as non-precious metals are preferred. To solve the second challenge, catalysts that can inhibit the HER while maintaining good NRR activity are desired, 11 as the NRR faces competition from the hydrogen evolution reaction (HER) in aqueous electrolyte. 12,13 It is well known that ionic liquids are very effective in inhibiting the HER when used as electrolytes, as they can suppress the protons near the electrode and improve the solubility of N2 molecules 14,15 ; however, the price of ionic liquids is too high, so they are not suitable for large-scale applications too. 16
To address the above two challenges, numerous efforts have been made to develop highly efficient catalysts using precious metals, non-precious metals, and non-metals through effectively regulating the electronic structure. 17,18 Although some progress has been made, there are still many more opportunities to further improve the performance while reducing the cost.
Nitrogenase, an enzyme of nitrogen-fixing microorganisms extensively found in nature, can catalyze the conversion of nitrogen to ammonia through the actions of V-proteins, Fe-proteins and Mo-proteins. In addition, it is widely known in nature that the Fe-Mo compound can be coordinated as an effective catalytic active site, and these two elements are also known to have higher N2 activation capabilities than the noble metals. 19 Therefore, Fe- and Mo-based materials have attracted a lot attention for their potential as catalysts for the electrochemical synthesis of NH3. 20 For example, Zhang et al. fabricated the Co-doped MoS2−x heterogeneous electrocatalyst and found that Mo atoms can adsorb and activate nitrogen molecules. 21 Wang et al. proposed that the doping of Mo4+ ions in the FeS2 lattice could boost the adsorption and activation of N2. 22 It was noticed that Fe can easily combine with other elements to form compounds 23 while Mo with multiple valences can effectively promote the electron exchange between the neighboring atoms and the surrounding environment. 24 The electron transfer process would also affect the adsorption of N2 or the desorption of intermediate products and subsequently cause competition between NRR and HER. 25–28 Additionally, a few researchers explored the performance of Fe-Mo bimetallic catalysts for NRR. Fe2(MoO4)3 nanoparticles and FeMoO4 nanorods were found to have rather good NH3 yields, but their FEs were unsatisfactory. 29–31 From the perspective of bionics, we believe that a higher FE can be achieved with the FeMo-based compounds for NRR as long as an appropriate synthesis method is selected and the right valence of material is obtained. Therefore, a FeMo compound catalyst with an evenly distributed Fe species and Mo species deserves further study.
Inspired by the fact that the Mo ion is easy to precipitate with divalent metal ions, we prepared the MoFe compound materials at room temperature and then calcined the materials under the NH3 atmosphere for the N-doping treatment. The obtained amorphous MoFe-N catalyst was then applied to the NRR process. It was demonstrated that an NH3 yield rate of 33.31 μg h−1 mg−1 cat. for MoFe-N was achieved in a 0.05 M H2SO4 solution for the MoFe-N catalyst, which is higher than that of many other catalysts reported in literature. Also, the FE of 33.26 % achieved for MoFe-N is remarkably higher than that of most single Mo or Fe-based catalysts. This might be due to the Mo4+ that appeared in the MoFe-N compound via the thermal process under the NH3 atmosphere. Meanwhile, a lot of electronic interactions between the Mo-N and Fe species exist, which also led to the formation of Mo-N-Fe ternary active sites, thus resulting in the improvement of FE.
All in all, an attempt was made in this work to improve both the NH3 production rate and the FE for NRR. With that in mind, a facile yet practical precipitation-thermal treatment method was developed for the synthesis of efficient compound catalysts. Specifically, the method for constructing Mo, Fe bimetallic catalysts generates tetravalent Mo, so that it plays a critical role in achieving a high NH3 production rate and decent FE. We believe that this work can potentially provide a new pathway for the improvement of the electrochemical reduction of nitrogen to ammonia, which would be of great interest to many peers.
Experimental
Materials
Ammonium iron(II) sulfate (Fe(NH4)2·(SO4)2), Sodium molybdate dihydrate (Na2MoO4·2H2O), Hexadecyl trimethyl ammonium Bromide (C19H42BrN, CTAB), concentrated hydrochloric acid (HCl), ammonium chloride (NH4Cl), salicylic acid (C7H6O3), sodium citrate dehydrate (C6H5Na3O7·2H2O), sodium nitroferricyanide dihydrate (C5FeN6Na2O·2H2O), sodium hypochlorite solution (NaClO), and Nafion (5 wt.%) sodium were all purchased from Aladdin Ltd in Shanghai. Para-(dimethylamino) benzaldehyde (p-C9H11NO), hydrazine hydrate (N2H4·H2O), sodium hydroxide (NaOH), hydrochloric acid (HCl), and ethanol (CH3CH2OH) were bought from Beijing Chemical Corporation. All the reagents and chemicals were used as received (without further purification). The de-ionized (DI) water used throughout the experiments was self-made via a Millipore system in the lab.
Preparation of MoFe bimetallic compounds
To prepare solution A, 0.5 mmol of Fe(NH4)2·(SO4)2 (0.1961 g) was added to 30 mL of DI water and then stirred for 0.5 h. For solution B, 0.5 mmol of Na2MoO4 (0.1210 g) and 0.1 g of PVP 10000 were added into 30 mL of DI water and stirred for 0.5 h; afterwards, solution A was added dropwise into solution B while vigorously stirred for 1 h. The obtained sample was then collected and washed with DI water and anhydrous ethanol repeatedly by centrifugation several times. The obtained sample was named MoFe-RT and then sintered in a muffle furnace at 500 °C for 2 h, and the obtained product after sintering was named MoFe-O. The MoFe-RT was also annealed separately in an Ar or NH3 atmosphere at 500 °C for 2 h. The generated products were denoted as MoFe-Ar and MoFe-N, respectively.
Materials characterization
The surface morphology of the catalyst was investigated with field emission-scanning electron microscopy (FE-SEM) (Zeiss Supra 55). High-resolution transmission electron microscopy (HR-TEM) characterization was performed on a TECNAI F30 TWIN equipped with an energy dispersive X-ray (EDX) accessory. Powder X-ray diffraction (XRD) patterns were collected on a Rigaku Corporation Ultima IV using Cu Kα radiation (λ = 1.54 Å) and operated at 30 mA and 40 kV. The scanning 2θ values ranged from 10° to 90° at a scan rate of 5° min−1. X-ray photoelectron spectroscopy (XPS) signals were recorded on a K-Alpha + photoelectron spectrometer with monochromatic Al Kα X-ray. The binding energy of C1 s (284.8 eV) was used as a calibrated standard. The UV–vis absorption spectra were generated on a spectrophotometer (UV-1200, MAPADA). N2 temperature-programmed desorption (N2-TPD) was carried out with a Micrometeritics AutoChem Ⅱ 2920, where 100 mg catalysts were heated at 400 °C for 1 h in He (40 mL min−1); after being cooled to 50 °C, the sample was swept with N2 atmosphere for 1 h. Then, the pretreated sample was heated from 50 °C to 400 °C at a ramp of 10 °C min−1 in He.
Electrochemical performance measurement
The electrochemical performance measurements were performed with a CHI 660E electrochemical analyzer (CH Instruments, Inc., Shanghai) using a standard three-electrode system with MoFe compounds/carbon paper as the working electrode, Pt foil as the counter electrode, and saturated Ag/AgCl as the reference electrode. All the potentials measured were calibrated to the reversible hydrogen electrode (RHE) using the following equation: E (RHE) = E (Ag/AgCl) + 0.278 (V). All experiments were performed at room temperature. For N2 reduction experiments, the 0.05 M H2SO4 solution was purged with N2 for 30 min to form a N2-saturated solution. The chronoamperometry test was conducted in a N2-saturated 0.05 M H2SO4 solution (40 ml) in a two-compartment cell, which was separated by a Nafion 117 membrane. Linear sweep voltammetry (LSV) was performed at the scan rate of 5 mV s−1. Chronoamperometric tests were carried out at different potentials for 2 h.
Determination of NRR products
The ammonia concentration in the product was determined with an ultraviolet spectrophotometer via the indophenol blue method. In detail, 2 mL of 1.0 M NaOH solution containing 5 wt.% salicylic acid, 5 wt.% sodium citrate, 1 mL of 0.05 M NaClO, and 0.2 mL of 1 wt.% C5FeN6Na2O were added into a 2 mL electrolyte and allowed to react for a while. Then, the indophenol blue concentration was detected at a wavelength of 655 nm using a UV–vis absorption spectrum after the solution stood at room temperature for 2 h. The working curves of different concentrations-absorbance were generated by measuring the absorbance of ammonium chloride solutions at different concentrations. The obtained working curves (y = 0.1174x + 0.0159, R2 = 0.9998) had a strong linear relationship between the concentration and the absorbance.
On the other hand, the concentration of hydrazine, a by-product, was spectrophotometrically determined via the Watt and Chrisp method. The details are below: 5 mL of the prepared color reagent (5.99 g of p-C9H11NO, 30 mL of HCl and 300 mL of C2H5OH) were mixed first. Then, with the solution standing at room temperature for ∼10 min, the absorption spectrum was detected at a wavelength of 455 nm using the UV–vis absorption spectrum. Curves of different concentrations-absorbance were generated by measuring the absorbance of hydrazine solutions at different concentrations. The obtained working curves (y = 0.08x−0.002, R2 = 0.999) had a good linearity for the concentration and the absorbance.
Calculation of faradaic efficiency and NH3 yield rate
The yield rate for NH3 production was calculated with the following equation:

where  is the measured NH3 concentration, V is the volume of electrolyte, t is the time of the whole reduction reaction, and A is the effective area of the working electrode.
The Faradaic efficiency (FE) of NH3 production was calculated using the following equation:

where  is the measured NH3 concentration, V the volume of electrolyte, F the Faradaic constant, and Q the total electricity of the whole NRR process.
Results and Discussion
Physical characterizations: morphology, crystallography, and surface chemical properties
A series of MoFe catalysts were successfully prepared via the facile one-step thermal method (please see Supporting Information for the preparation details). The obtained precipitation of sodium molybdate and ferrous ammonium sulfate hexahydrate in aqueous solution under ambient conditions was named MoFe-RT and then calcined at 500 °C under different atmospheres. The primary preparation process is illustrated in Fig. S1 (available online at stacks.iop.org/JES/168/126518/mmedia). Based on the thermal treatment atmosphere (O2, Ar and NH3), the final products were labeled MoFe-O, MoFe-Ar and MoFe-N. The scanning electron microscopy (SEM), transmission electron microscopies (TEM) and dispersive X-ray spectroscopy (EDS) analysis were used to investigate the morphology of the MoFe compound catalysts and spatial distribution of Mo, Fe, N and O atoms in MoFe compound catalysts. SEM and TEM images of MoFe-RT, MoFe-O, MoFe-Ar, and MoFe-N compounds (Fig. 1) indicated that they were irregular particles with diameters of about 100 nm. The HRTEM image of MoFe-N is shown in Fig. S2. As seen, there are no obvious lattice fringes or material characteristic peaks. The energy-dispersive X-ray (EDX) elemental mapping images (Figs. 1i–1l)) revealed the homogeneously distributed Mo, Fe, N, and O elements in the nanoparticles. The X-ray diffraction (XRD) patterns of four MoFe compound catalysts are shown in Fig. S3. As observed, only the MoFe-O sample shows diffraction peaks at 21.6°, 22.9°, 24.9°, 26.7°, 27.4°, 31.0° and 34.0°, corresponding to the (102), (031), (131), (221), (202), (311) and (240) planes of Fe2(MoO4)3 (JCPDS No. 33–0661). The other MoFe compound catalysts did not show any characteristic peaks of the substances. Additionally, the results showed that a bimetallic catalyst (MoFe-N) with the homogeneous mixture of Mo and Fe was prepared.

Figure 1. SEM images of (a) MoFe-RT, (b) MoFe-O, (c) MoFe-Ar and (d) MoFe-N. TEM images of (e) MoFe-RT, (f) MoFe-O, (g) MoFe-Ar and (h) MoFe-N. EDX mapping of N (red), O (blue), Mo (cyan), and Fe (yellow) of (i) MoFe-RT, (j) MoFe-O, (k) MoFe-Ar and (l) MoFe-N.
Download figure:
Standard image High-resolution imageAdditionally, the elemental valence states of surface elements of MoFe catalysts were investigated by X-ray photoelectron spectroscopy (XPS). The survey spectra of MoFe compound catalysts revealed the presence of Fe, Mo, O and N elements in the catalysts (Fig. S4). All spectra were calibrated according to the C 1 s binding energy at 284.8 eV (Fig. S5). The elemental compositions in MoFe-O, MoFe-Ar and MoFe-N are shown in Table S1. The molar ratio of Mo/Fe in the MoFe samples was essentially 1:1. However, the content of Mo in MoFe-O was obviously decreased, which could be due to the partial covering of the Mo element by the oxide layer on the surface of the materials. In the Mo 3d region (Fig. 2a), two independent peaks are located at 235.8 and 232.6 eV, which can be assigned to Mo 3d3/2 and Mo 3d5/2, respectively. 30 Generally, Mo6+ originates from surface-oxidized Mo species. 32 Unlike the MoFe-O and MoFe-Ar catalysts, the Mo 3d region of MoFe-N clearly indicated the presence of two low valence chemical states, i.e. Mo4+ (234.7 eV) and Moδ+ (230.3 eV). 33 The atomic ratio of Mo in different valence states is Mo6+: Mo4+: Moδ+ = 0.4: 0.4: 0.2, and the reductive NH3 atmosphere can result in an additionally lower oxidation state of the Mo element. The reason why Mo (IV) can act as an active site for nitrogen fixation is because elements with unoccupied d orbital can accept electrons from N2, thus facilitating the adsorption of N2. 34,35 From the high-resolution XPS spectra of Fe 2p for MoFe-O, MoFe-Ar, and MoFe-N (Fig. 2b), the coexistence of Fe2+ and Fe3+ mixed valence states is evidenced by the observed peaks at 711.1, 724.3, 712.6, and 725.5 eV, and the atomic ratio of Fe2+ and Fe3+ does not change with the thermal treatment conditions of MoFe catalysts. 36 The peaks of MoFe-Ar and MoFe-N in Fe 2p3/2 (711.1 and 712.6 eV) are positively shifted ∼ 0.7 eV in comparison with those of MoFe-O (710.4 and 711.9 eV). Typically, the signals at 530.4 eV and 531.2 eV for O 1 s correspond to the typical lattice oxygen and chemisorbed oxygen, respectively, indicating the presence of metal oxides on the catalysts (Fig. S6). 31,37 Also, MoFe-O has the highest oxygen content and lowest nitrogen content among the MoFe compounds as a result of the thermal treatment in an air atmosphere. The N 1 s region of MoFe-N (Fig. 3c) showed three peaks at 397.08, 398.73 and 400.4 eV, corresponding to the Mo–N bond, pyridinic N and pyrrolic-N, respectively. 38–40 The peak for the metal-N bond was detected in MoFe-N, which indicated a strong electron interaction between the surface nitrogen species and the metal induced by the reductive NH3 atmosphere and Mo-bearing species in the surroundings. However, the peak of the metal-N bond did not appear in the MoFe-O and MoFe-Ar compounds, which signals that the thermal treatment under an NH3 atmosphere is indeed an effective measure for the construction of a metal-N bond, while N of PVP mainly forms a pyrrolic-N bond during the thermal process (NH3 and Ar atmosphere). In addition, the N contents of MoFe-O, MoFe-Ar and MoFe-N are 17.77, 23.78 and 26.22 at.%, respectively. It is worth noting that the increase in nitrogen content in MoFe-N is due to not only the nitrogen in metal-N bond, but also the nitrogen in the surface nitrogen species. In addition, there is a strong electronic interaction between the Mo-N and the Fe species. Therefore, the Mo-N-Fe was formed in the catalyst of MoFe-N, which further optimized the electronic structure of Mo elements, and thus benefitted the NRR catalysis. The surface bonding configuration of MoFe compound catalysts were investigated with Fourier transform infrared (FTIR) spectroscopy. As shown in Fig. 2d, the IR signals at 3447 and 1654 cm−1 correspond to the stretching vibration and the bending vibration of water that was physically adsorbed on the surface of the catalysts. 41 The spectra of PVP showed three peaks at 2958, 1423 and 1291 cm−1, which can be attributed to the C-H, N–H and C–N bonds of PVP, respectively. 41,42 The FTIR spectra of MoFe-O and MoFe-N showed no characteristic peak of PVP, which suggests that no PVP remained in the catalyst. 19 The IR signal of the N–H bonds of MoFe-N may originate from NH3 atmosphere. The characteristic peak of the N–H bond was found in the IR spectra of MoFe-Ar, which was believed to be the N contained in PVP. The FTIR spectra of MoFe-O showed a characteristic peak of Mo–O bond at 819 cm−1. The four different MoFe compound catalysts actually have similar FTIR characteristic peaks; that is, the introduction of N did not significantly affect the chemical structure of the samples.
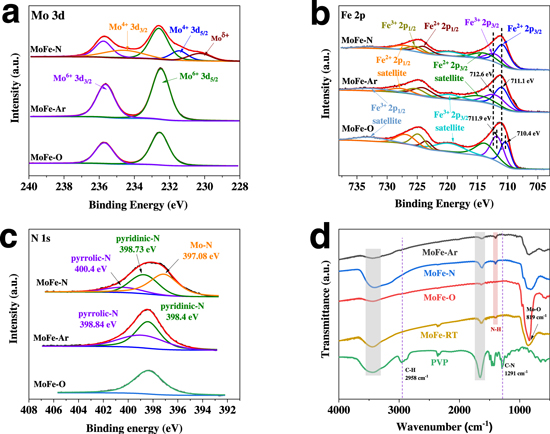
Figure 2. XPS spectra of (a) Mo 3d, (b) Fe 2p and (c) N 1 s of three MoFe compound catalysts. (d) FTIR spectra of PVP, MoFe-RT, MoFe-O, MoFe-Ar and MoFe-N.
Download figure:
Standard image High-resolution image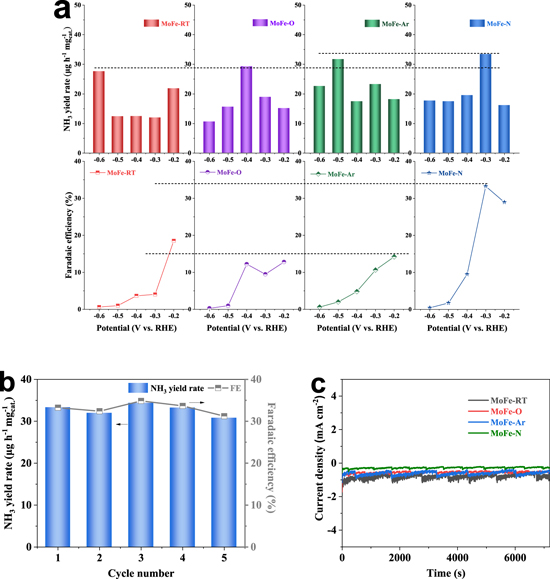
Figure 3. (a) The NH3 yield rates and FEs of MoFe-RT, MoFe-O, MoFe-Ar and MoFe-N at different potentials. (b) the NRR activities of the four different Mo-Fe compounds at −0.3 V after five consecutive cycles. (c) chronoamperometric (i-t) curves of four Mo-Fe compounds at −0.3 V.
Download figure:
Standard image High-resolution imageThe adsorption capacity of N2 is one of the prerequisites for an electrocatalyst to have excellent NRR performance. Fig. S7 shows the N2 temperature-programmed desorption (N2-TPD) of MoFe compound catalysts. As seen, MoFe-N (green line) had two peaks at temperatures of ∼100 °C (which is attributed to the physisorption of N2) and 340 °C (which corresponds to the chemisorption of N2). As such, the strong N2 adsorption on MoFe-N denotes the strong binding of N2, which is favorable for electrochemical NRR.
Electrocatalytic performance of catalysts
The electrochemical NRR activities of MoFe compounds were measured in an N2-saurated 0.05 M H2SO4 electrolytic using an H-type electrolytic cell separated by a Nafion 117 membrane. The prepared Fe-Mo compound that was coated on carbon paper was used as the working electrode, the Ag/AgCl saturated KCl electrolyte was used as the reference electrode, and Pt was used as the counter electrode. Figure S8 shows the LSV curves of MoFe-N in an N2-saturated (black line) and an Ar-saturated (red line) 0.05 M H2SO4 electrolyte. The current density obtained in an N2-saturated electrolyte is obviously higher than that of an Ar-saturated electrolyte at given potentials, which indicates that MoFe-N is a more effective catalyst for the electrochemical NRR. Subsequently, the electrocatalytic activities of the prepared Fe-Mo compounds toward NRR were investigated at different potentials from −0.2 to −0.6 V in an N2-saturated 0.05 M H2SO4 electrolyte. It was observed that after 2 h of the NRR process at the given potentials, the produced NH3 could be detected in the electrolyte via the indophenol blue method, and a possible by-product N2H4 was also detected via the Watt and Chrisp method. The standard curves of NH3 and N2H4 are shown in Fig. S9. The chronoamperometric (i-t) curves of MoFe-N at different potentials are plotted in Fig. S10. Further, the NH3 yield rates and FEs of the prepared MoFe compounds were obtained and plotted in Fig. 3a. As seen, the NH3 yield rates and the FEs of the MoFe catalysts shared the same tendency, which generally increased first and then decreased with the potential becoming more negative. Also, the MoFe-N exhibited the largest NH3 yield rate of 33.31 μg h−1 mg−1 cat. At −0.3 V, which was slightly higher than that of other Mo-Fe compound catalysts.
Additionally, it was found that the FEs of MoFe compound catalysts also decreased as more negative potentials were applied. Noticeably, MoFe-N showed the highest FE of 33.26 % at −0.3 V, which is significantly higher than that of the other MoFe compound catalysts. In addition, the obtained NH3 yield rate and FE for MoFe-N are much better than those reported for single Mo-, Fe- catalysts and even better than some of the noble metal-based catalysts (see Table S2). As observed, the current densities of the four MoFe compounds at −0.3 V had no obvious decrease for at least 10 h, illustrating that the electrocatalysts had excellent stability (Fig. S11). In addition, the accelerated degradation test (ADT) in Fig. S12 also demonstrated a good electrochemical stability. It was also observed that after 5 cycles, the NH3 yield rate and the FE of MoFe-N had no obvious decrease, indicating its excellent stability for electrochemical NRR (Fig. 3b). We believe that the reason the MoFe catalysts exhibited FE loss at negative potentials lower than −0.3 V is due to the increased competition from the HER. Also, from Fig. 3c, one can see that the current density of MoFe-N is the smallest of all the MoFe compound catalysts prepared. However, as the HER is the dominant reaction in the acidic electrolyte, 43 the improved FE of MoFe-N must be due to the effective inhibition of HER. Therefore, we speculate that Mo(IV) might be able to suppress the activation of H2 significantly. To verify the above speculation, we designed an experiment to collect the hydrogen gas generated by the four different MoFe catalysts during a 10 h chronoamperometric electrolysis using the Drainage Method. The schematic diagrams of the drainage and gas collection process and of the MoFe catalysts are shown in Fig. S13 of the Support Information. The results showed that there is not much of a difference in H2 production rates among MoFe-RT, MoFe-O and MoFe-Ar, and all of them exhibit significantly higher H2 production rates than MoFe-N. Based on the above experiments, it was verified that the Mo(IV) active sites not only benefit the NH3 formation, but also play a critical role in suppressing the HER. Furthermore, no N2H4 was detected in the electrolyte after the NRR electrolysis, revealing that the MoFe catalysts have exclusive selectivity for NH3.
Tafel slope was further used to evaluate the HER kinetics. Figure S14 shows the Tafel slopes for the catalysts of MoFe-RT, MoFe-O, MoFe-Ar and MoFe-N, which are calculated from the corresponding polarization curves obtained in a 0.05 M H2SO4 electrolyte. As seen, the slope of MoFe-N was 65 mV dec−1 for HER, higher than that of the other MoFe catalysts, indicating the poor intrinsic HER activity of MoFe-N. Also, it was demonstrated that the low valence of Mo(IV) produced under the NH3 atmosphere can effectively inhibit the HER kinetics. 44 The cyclic voltammogram curves at varying scan rates and electrochemical double layer capacitances (Cdl) of MoFe-RT, MoFe-O, MoFe-Ar and MoFe-N are shown in Fig. S15. As observed, the Cdl of MoFe-N was slightly higher than that of MoFe-RT, MoFe-O and MoFe-Ar, respectively. The electrochemical impedance spectroscopy (EIS) measurements were performed at −0.3 V in an N2-saturated electrolyte to get more insight into the NRR kinetics. As seen, MoFe-N possessed a lower charge transfer resistance and a lower mass transfer resistance than MoFe catalysts, which implied improved NRR kinetics (Fig. S16). 45 Further, to confirm that the detected NH3 in the electrolyte was actually coming from the electrochemical reduction of N2 rather than from the MoFe catalysts themselves, a series of control experiments were performed, including: (a) Replacing N2 gas with Ar gas at −0.3 V for MoFe-N NRR electrolysis; (b) Applying open-circuit potential to the MoFe-N in an N2-saturated electrolyte; (c) Using a bare carbon paper as the working electrode in an N2-saturated electrolyte at −0.3 V. The testing results are presented in figure 4(a). As seen, no NH3 was detected in the electrolyte in any of the above control tests, indicating that the produced NH3 does indeed come from electrochemical N2 fixation.
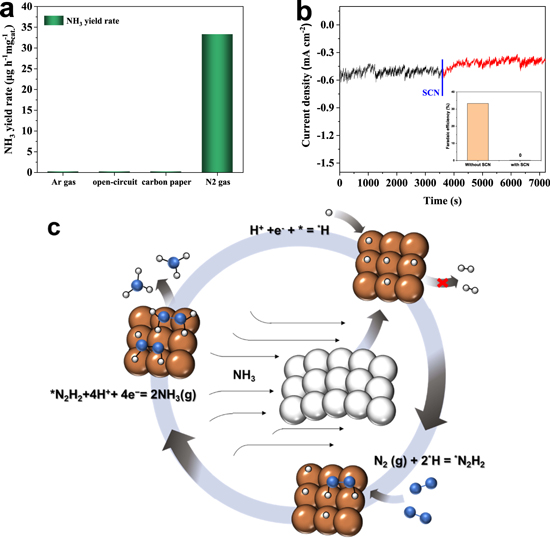
Figure 4. (a) NH3 yield rates for MoFe-N in Ar gas at −0.3 V, MoFe-N in N2 gas at open-circuit potential, and carbon paper in N2 gas at −0.3 V. (b) Chronoamperometry curves of MoFe-N in N2-saturated 0.05 M H2SO4 electrolyte with addition of SCN−. Inset: FEs of MoFe-N with and without SCN−. (c) Schematic of surface-hydrogenation mechanism for NRR of MoFe-N catalyst.
Download figure:
Standard image High-resolution image
In order to study the reaction mechanism, the active sites of the MoFe catalysts need to be identified. Based on the above characterization, we believe that the low valence Mo species is very likely the exclusive active site for NRR. It is also known that the SCN− ion has a high affinity to metal species, as it can poison the metal active sites toward electrochemical reaction. The EIS was measured at −0.3 V in a N2-saturated electrolyte for both cases of with and without 5 mM KSCN. As seen in Fig. S17, the impedance of the catalyst in the electrolyte with 5 mM KSCN was significantly smaller than that of without 5 mM KSCN, which means that the addition of KSCN is beneficial to the conductivity of the catalyst. As shown in Fig. 4b, KCSN was added purposely to the electrolyte during the ongoing process. The inset of the figure shows the NRR activity of MoFe-N in the 0.05 M H2SO4 with 5 mM KSCN electrolyte. It is clearly seen that the current was significantly reduced after the addition of SCN−. Meanwhile, no NH3 was detected in the 0.05 M H2SO4 solution after a 5 mM KSCN electrolyte was added. These results suggest that the decrease in current density for NRR can be ascribed to the blocking of low valence Mo species by SCN−, which further confirms that the low valence Mo species is the main active site of MoFe-N for NRR. Additionally, the current density of MoFe-N in an Ar-saturated electrolyte with and without KSCN was measured. As shown in Fig. S18, the current density of MoFe-N increased significantly after the addition of KSCN, and HER process occurred in the Ar-saturated electrolyte (no NRR). Therefore, we believe that the NRR activity of MoFe-N decreased after the addition of KSCN.
Moreover, in order to further verify the source of N in the produced NH3, a 10 h chronoamperometry test in an Ar-saturated 0.05 M H2SO4 electrolyte was performed to check the variation of N in the MoFe-N catalysts before and after the test. The N 1 s XPS spectra and elemental compositions of MoFe-N after the 10 h chronoamperometry test in an Ar-saturated electrolyte are shown in Fig. S19 and Table S1. The results indicate that the content of N atoms in MoFe-N did not change before and after the 10 h test, but the content of Fe3+ and Mo6+ increased. This, we think, is probably due to the HER process mainly occurring in the Ar-saturated 0.05 M H2SO4 electrolyte during the 10 h chronoamperometry. The evolution of H2 was observed with a large number of electrons transferred. The N2-TPD results revealed that MoFe-N exhibited a better N2 adsorption capacity than the other MoFe catalysts that were prepared. However, there is no obvious difference in NH3 yield rates across the four different MoFe catalysts, indicating that N2 adsorption on the active sites of MoFe catalysts is not the rate-determining step (RDS). It may not even be the first step for electrochemical NRR, which is distinctly different from the widely accepted associative and dissociative mechanisms. Recently, more attention has been paid to a new NRR mechanism of surface hydrogenation (SHM) proposed by Ling et al. 46 As shown in Fig. 4c, the N2 adsorption is replaced by the reduction of H+ as the foremost step in NRR (or the first elementary step of HER: H+ + e− + * → *H). Subsequently, the gas phase N2 can be directly activated and reduced into *N2H2. 10 Furthermore, the activation of N2 can be reinforced through the cooperative effect of surface *H and active sites. Ling et. al also took an N-doped carbon-supported single Mo catalyst and a pure Mo catalyst as prototypes for calculations. Both catalysts demonstrated strong N2-binding strength and relatively high activity toward the NRR. This shows that the surface hydrogenation mechanism is suitable not only for catalysts with weak N2 binding strength, but also for catalysts with strong N2 binding strength. We know while multiple mechanisms may coexist in a system, only one mechanism dominates. The NH3 production rate of the MoFe-N is not different from that of the other three MoFe catalysts studied, but its FE is quite different from those of the other three, which is why we proposed that the catalyst conforms to the surface hydrogenation mechanism. According to the first-principle theory, it is only possible that the first step is the RDS, which means that in the case of insufficient amount *H, the N2 adsorption will be stronger while the H reduction will be weaker. In other words, the MoFe-N catalyst with a strong N2 adsorption capacity could inhibit HER, thus enhancing the NRR.
Conclusions
From the study above, the following conclusions can be drawn. Of the four different compound catalysts prepared, the MoFe-N was the most effective in the electrochemical reduction of N2 to NH3, which can be easily fabricated via a facile yet effective method of precipitation, followed by pyrolysis in an NH3 atmosphere. Encouragingly, the obtained MoFe-N catalyst demonstrated a remarkable Faradaic efficiency of 33.26 % and an NH3 yield rate of 33.31 μg h−1 mg−1 cat., which are both significantly higher than those of the MoFe-Ar compound and other Mo- and Fe-based electrocatalysts. The characterization of the catalysts revealed that the electronic structure of Mo in MoFe-N catalyst was optimized by the Mo-N-Fe structure formed during the NH3 treatment. Therefore, pyrolysis of the bimetallic under a reducing NH3 atmosphere is a critical step in preparing such a catalyst. Finally, the NRR tests indicated that the Mo(IV) was able to significantly suppress HER, and the surface hydrogenation mechanism study indicated that the synergistic effect of the adsorbed H* and Mo(IV) active sites played a critical role in the adsorption and activation of N2. All in all, this work might open up a new pathway for fabricating the efficient NRR electrocatalysts and deserves further study.
Acknowledgments
This work was supported by the National Science Foundation of China (21276214), and the Fundamental Research Funds for the Central Universities of China (20720170043).
Appendix
The experiment section, XRD, XPS spectra, N2 adsorption-desorption curves, standard calibration curves for measuring the concentrations of NH3 and N2H4, and electrochemical performances can all be found in the appendices.