
Abstract
Direct production of aluminium-silicon alloy during aluminium electrolysis in fluoride-based melts was studied. Experiments were carried out in a laboratory cell dedicated to current efficiency measurements. Electrolysis was run at 960 °C, 970 °C, and 980 °C at a fixed cathodic current density (CCD) of 0.9 A cm−2 and a cryolite ratio (CR) of 2.2. Silicon content was up to 4 wt.% added via SiO2 precursor. SEM/EDX and ICP-MS were carried out for some of the deposits to characterize the solidified deposit surface of the produced metal and to estimate the current efficiency for Al-Si alloy. It was possible to produce alloys of at least 9.0 wt.% Si in Al with an estimated alloy current efficiency of approximately 63%. The presence of silica in the melt brought a rise in the recorded cell voltage which implies a lowering of the electrolyte conductivity.
Export citation and abstract BibTeX RIS

This is an open access article distributed under the terms of the Creative Commons Attribution Non-Commercial No Derivatives 4.0 License (CC BY-NC-ND, http://creativecommons.org/licenses/by-nc-nd/4.0/), which permits non-commercial reuse, distribution, and reproduction in any medium, provided the original work is not changed in any way and is properly cited. For permission for commercial reuse, please email: permissions@ioppublishing.org.
Aluminium-silicon alloys are mechanically characterized by their high strength-to-weight ratio, good fluidity and castability, and their resistance to corrosion. 1,2 They are widely employed in the automotive and aerospace industries due to their excellent mechanical properties. 3
Electrowinning of silicon is a possibility and has been studied in a laboratory experiment to a certain extent. 4 It may be assumed that the energy requirement for silicon electrowinning is comparable to that of aluminium considering the differences in valencies and decomposition voltages. 5 Cryolite has a good ability to dissolve oxides and silica is no exception. The decomposition voltages of both silica and alumina were measured in a graphite crucible having alumina or silica as sidelining with a graphite anode. 6 In cryolitic melts of 5 wt.% SiO2 or 5 wt.% SiO2 and 10% Al2O3 the decomposition voltage of silica was found to be in the range of 1.00–1.25 V in the temperature range of 1000 °C–1030 °C and according to the experimental conditions mentioned in 6,7 where the cathode was either the bottom of a graphite crucible, aluminium, or copper. The observed decomposition voltage of alumina was 1.25‒1.45 V, which was in agreement with the values reported in, 8 when cryolitic melts saturated with alumina at 1000 °C were tested using either aluminium or aluminium—silicon alloy(12.5 wt.% Si) as a cathode. 6 When copper was used as a cathode, the decomposition voltage of alumina was 1.50 V at 1030 °C. 7 It has been reported that the decomposition potential of silica calculated based on Nernst's equation to be −1.75 V at 1040 °C. 9 Such results imply the possibility of simultaneous deposition of aluminium and silicon from their oxides.
An attempt to electrodeposit silicon in molten cryolite using silica and alumina was tested but ended up producing Al-Si alloy instead due to the high potentials applied. 10 Another study reported the electrodeposition of Si in cryolite- silica electrolyte and formed Al-Si alloy on a graphite cathode at 980 °C. 11 Silicon in aluminium may also come from some exchange reactions which have been reported to be possible reasons behind current efficiencies of Si higher than 100% 6,11 .
The melting points of aluminium and silicon are 660 °C and 1414 °C, respectively. The phase diagram of the Al-Si binary system shows the eutectic reaction to occur at around 12.6 wt.% Si and 577 ± 1 °C. 12 Silicon alloys containing Si less than that of the eutectic are referred to as hypoeutectic while those having higher Si are called hypereutectic. The maximum solubility of Si in Al happens at the eutectic temperature which is around 1.65 wt.% as seen in Fig. 1.

Figure 1. Al-Si binary phase diagram. 13
Download figure:
Standard image High-resolution imageThe reduction mechanism of SiO2 in cryolitic mixtures was reported to be a two-step reduction according to the following: 9


Another report has studied the electrodeposition of Si in molten alkali fluoride mixtures on silver and silicon substrates. Electrochemical measurements have shown that the reduction of silicon is diffusion-controlled and takes place in two steps. 14 Voltammetry study showed that a stepwise reduction of Si (IV) followed by a reduction of Si (II) took place in alkaline fluoride melts as well as an alloying step between Al and Si occurred when the cryolitic melt was used as electrolyte. 15
The current efficiency of the alloy is of high significance. It can be calculated according to:

where Walloy is the total mass of metal produced experimentally whereas Walloy. theoretical is the theoretical mass of alloy produced. The theoretical mass of the produced alloy is given by Faraday's law as:

where Malloy is the molecular mass of the alloy and zalloy is the average charge transferred for the deposition of the alloy.
The two quantities may be estimated for the Al-Si alloy according to the so-called electrochemical equivalent given by:

Thus CE% for the alloy can be given by:

where MAl, MSi, zAl, zSi xAl, and xSi are the molecular masses of Al and Si, their charges, and their mass fractions respectively.
This work reports a study on the electrochemical deposition of an aluminium-silicon alloy during aluminium reduction in fluoride-based melts in a laboratory cell implementing industrial standards, the effect of the presence of Si on the current efficiency with respect to Al, the current efficiency of the alloy, and the shape of the surface of the solidified deposit.
Experimental
Experiments were carried out in a laboratory cell originally designed by Solli et al. 16 for current efficiency measurements during electrodeposition. The laboratory cell is schematically illustrated in Fig. 2. A graphite crucible with cylindrical sintered alumina sidelining of about 10 cm height containing anode, cathode, and electrolyte was used. The anode is cylindrical with a central vertical hole passing through it with an inward inclination angle of 10˚ as well as horizontal holes penetrating the anode.

Figure 2. The laboratory cell design for CE measurements.
Download figure:
Standard image High-resolution imageThis design provides good convection within the bath so that anode gas bubbles pass through the central vertical hole in the bottom allowing the electrolyte to flow up and through the horizontal holes on the sides causing the electrolyte to circulate in a loop. By that, the gas bubbles would have less effect on the diffusion layer and thus the current efficiency would not be significantly affected by increased convection.
The liquid aluminium metal product wetted on a steel plate resting on the bottom of the graphite crucible acts as a cathode which ensures an almost flat deposit surface and as a result an even current distribution. A steel pin of 21 mm height is placed in a 4 mm deep hole at the center of the bottom of the graphite crucible to make a contact with the steel cathode plate. The latter is placed on top of a layer of alumina powder after cementing the bottom of the crucible with a layer of cast alumina cement of 7 mm thickness. These two layers should prevent loss of the deposit and minimize the chances of forming aluminium carbide (Al4C3). The electrolyte constituents shown in Table I were transferred into the crucible after being dried at 200 °C for 24 h. The cell was then placed in a Pythagoras tube inside a vertical furnace. Two copper lids with greased rubber O-rings were used to seal up the two ends of the furnace making it gas-tight. The anode held by a steel current collector was placed in the bath such that it was lowered into the bath until it touched the surface of the melt which is called the contact point. From the contact point, the anode was lowered into the bath for another 2 cm. The furnace was continuously flushed with argon gas during the experiment in order to prevent air burning of cell components. The temperature (±1 °C) was recorded during electrolysis using a thermocouple made of Pt/Pt10Rh placed inside a lateral slot of the crucible.
Table I. Electrolyte constituents.
| Chemicals | Initial amount added (wt.%) | Pre-treatment | Quality/Supplier |
|---|---|---|---|
| AlF3 | 43.3 | Sublimed at 1090 °C for 24 h | Industrial grade, Alcoa- Norway |
| NaF | 47.7 | Dried at 200 °C for 24 h | 99.5%, Merck-Germany |
| CaF2 | 5.0 | Dried at 200 °C for 24 h | Precipitated pure, Merck-Germany |
| Al2O3 | 4.0 | Dried at 200 °C for 24 h | Anhydrous (γ-alumina), Merck-Germany |
| SiO2 | Up to 8.6 | Dried at 200 °C for 24 h | −325 Mesh powder, 99.5%, Alfa Aesar-Germany |
A DC power supply was used to supply the current. The operating temperature was varied from 965 °C − 980 °C with a fixed electrolysis duration of 4 h. The superheat was estimated to vary from 13 °C − 28 °C based on an equation in. 17,18 The cathodic current density (CCD) was kept at 0.9 A cm−2 for all runs. A cryolite ratio (CR) of 2.2 was used for all runs. The standard electrolyte was 12 wt.% AlF3, 5 wt.% CaF2, 4 wt.% Al2O3, and a balance of Na3AlF6.
Bath sampling was conducted regularly at constant intervals using quartz tubes while keeping the same position of the sampling in the bath for all runs. Mechanical and chemical post-treatments, the latter by aluminium chloride hexahydrate solution for 30–40 min, were conducted after the deposited metal was collected. Bath samples were crushed into a fine powder and dissolved in a mixture of strong acids including HCl, HNO3, and HF. The solutions were digested and agitated to ensure complete dissolution. ICP-MS was conducted for samples afterward to determine the Si content in the bath.
Elemental mapping and analysis of deposited metal were performed by energy-dispersive X-ray detector (EDX, Oxford Xmax) coupled with scanning electron microscope (SEM APREO, FEI) with an electron beam energy of 20 kV.
Results and Discussion
Cell performance
Blank tests
Blank tests were carried out with no addition of silica at 965 °C, 970 °C, and 980 °C. Current efficiencies for the blank tests are presented in Table II.
Table II. CE of blank tests in Figs. 3 and 4.
| Temperature (°C) | CE% | CE% Mean | Standard Deviation (SD) | Standard Error (SE) |
|---|---|---|---|---|
| 95.8 | ||||
| 965 | 95.4 | 95.5 | 0.2 | 0.1 |
| 95.4 | ||||
| 95.1 | ||||
| 970 | 94.6 | 94.5 | 0.5 | 0.3 |
| 93.9 | ||||
| 93.8 | ||||
| 980 | 93.1 | 93.0 | 0.7 | 0.4 |
| 92.0 |
Figure 3 shows the mean values of the obtained current efficiencies for the blank tests mentioned earlier. The trendline constructed in Fig. 3 based on the least square regression yielded a decrease in the current efficiency of 0.2% for every 1.0 °C increase in the operating temperature. It agrees with reports which suggest that the enhancement of 1% in current efficiency was recorded upon the decrease of 5 °C in the operating temperature. 17 Blank tests can be considered as benchmarks to check for the positive and the negative effect of the addition of impurities on the current efficiency.

Figure 3. Average values of CE of blank tests at different temperatures, CR = 2.2, NaF-AlF3 cryolite, CCD = 0.9 A cm−2, and electrolysis time = 4 h. Error bars are based on the standard error of the mean (SEM). CE = 256 ± 10.2—(0.2 ± 0.0) T.
Download figure:
Standard image High-resolution imageSi addition
SiO2 was admixed into the bath before melting. Three concentrations were considered: 1 wt.% Si, 3 wt.% Si, and 4 wt.% Si. Temperatures varied were 965 °C, 970 °C, and 980 °C. Another test was carried out at 980 °C at an initial corresponding content of Si of 1 wt.% but with an initial content of alumina of 2 wt.%, unlike all other tests which were run with an alumina standard content of 4 wt.%. The solubility of silica at the CR and in the temperature range for these experiments is not available in the literature, but at 1010 °C it is less than 5 wt.%. 19 Thus at 1010 °C the electrolyte would be supersaturated with silica if the corresponding wt.% of silicon is more than 2.3%. The silica solubility at lower temperatures is most likely lower than at 1010 °C.
Effect of Si content on the apparent CE
As depicted in Fig. 4, the apparent current efficiencies were decreasing upon the increase in the initial content of Si added to the bath at 965 °C, 970 °C, and 980 °C. At 965 °C a drop of 13% in the apparent current efficiency, with respect to the blank test run at the same temperature, was recorded upon the introduction of 1 wt.% Si initially into the bath. It was around 10% at 970 °C and 4% at 980 °C at the same conditions.

Figure 4. The apparent current efficiency of Al at different temperatures and Si initial contents added to the bath.
Download figure:
Standard image High-resolution imageEffect of operating temperature
According to Table III, results show higher apparent current efficiencies at higher operating temperatures (965 °C, 970 °C, and 980 °C) at 1 wt.% Si. The same behavior was observed at Si initial content of 4 wt.% at 965 °C and 980 °C. That implies the higher the operating temperature the less the reduction in the apparent current efficiency. The low apparent current efficiency at the higher wt.%Si can probably be attributed to the electrolyte being supersaturated with silica, leading to sludge formation which passivates a part of the cathode surface. Higher temperatures will counteract this as the silica solubility increases with temperature, which explains improved performance at 980 °C as compared to the lower temperatures.
Table III. CE of Al at different initial content of Si in Fig. 4.
| Temperature (°C) | Silicon in the electrolyte (wt.% Si) | Apparent CE% |
|---|---|---|
| 0 | 95.5 | |
| 965 | 1 | 82.2 |
| 4 | 59.2 | |
| 970 | 0 | 94.5 |
| 1 | 84.2 | |
| 0 | 93.0 | |
| 1 | 87.9 | |
| 980 | 3 | 62.2 |
| 4 | 61.3 | |
| 1 | 76.5 | |
| (2wt.% Al2O3) |
The effect of the content of Si on the apparent current efficiency with respect to the blank tests is shown in Fig. 5. The results suggest that for every 1 wt.% Si initially added to the electrolyte an average reduction in the apparent current efficiency in the range of 9% is estimated. The results also suggest that the higher the initial content of silicon the lower the apparent current efficiency. As mentioned above, this can likely be attributed to the electrolyte being supersaturated with silica, leading to sludge formation as at content of 4 wt.% Si the content of silica is around 8.5 wt.%.

Figure 5. Apparent current efficiency (CE) as a function of added Si content (into the electrolyte) at 965 °C and 980 °C. The trendline is constructed based on least square regression.
Download figure:
Standard image High-resolution imageThe test that was carried out at 980 °C with 1 wt.% Si and 2 wt.% Al2O3 yielded lower apparent current efficiency of around 77% compared to that run at the same conditions but with the standard alumina content of 4 wt.%, as seen in Table III. That can be attributed to the fact that alumina enhances the solubility of silica, so a lower alumina content will decrease silica dissolution in the electrolyte. 19
It has been reported that for every 1 wt.% Si added a decrease in the range of 31% has been estimated. 20 The difference between this work's values and the work in 20 could be attributed to the difference in some parameters such as operating temperatures, CCD, and bath chemistry.
ICP sample analysis.–A sample bath analysis using ICP-MS has been done for the experiment carried out at 980 °C and 4 wt.% Si. Figure 6 shows the change in the concentration of Si with time in the bath. At the first 30 min of electrolysis, the corresponding content of Si in the bath was estimated to be 3.7 wt.%. Then it increased significantly to reach a maximum value of around 5.7 wt.% Si after 3 h of electrolysis. At the end of electrolysis, the content of Si in the bath was down to 2.3 wt.%. The Si content in the bath did not follow an exponential decay experienced with other impurities like Ti, probably because the silica was not completely dissolved in the electrolyte.

Figure 6. Variation of Si content in the bath at initial added content of 4 wt.% Si content at 980 °C.
Download figure:
Standard image High-resolution imageThe analysis of the same metallic sample using ICP-MS revealed that the content of Si is 8.6 wt.%. Based on that, the actual CE of Al was estimated to be 56%. The estimated current efficiency of the alloy (CE alloy) Al-8.6%Si is approximately 63% according to equations (3–6). The conversion percentage of Si, which may be defined as the percentage of the ratio of the mass of silicon found in the final deposit divided by the mass of Si initially added to the bath, was estimated to be 14%. This value is significantly low which can be related to the high content of Si still in the bath as seen in Fig. 6.
Deposit surface appearance and cell voltage behavior
As seen in Figs. 7–10 the deposit surfaces were very deformed. They have mostly detached spherical balls with a little deposit on the cathode plate apart from the experiment run at 965 °C with 4 wt.% Si initially added as depicted in Fig. 9.

Figure 7. Deposits using NaF-AlF3 cryolite with no alumina feeding at 1 wt.% Si, CR = 2.2, CCD = 0.9 A cm−2, t = 4 h, (1) T = 965 °C, (2) T = 980 °C.
Download figure:
Standard image High-resolution image
Figure 8. Deposit using NaF-AlF3 cryolite with no alumina feeding at 3 wt.% Si, CR = 2.2, CCD = 0.9 A cm−2, t = 4 h, and at 980 °C.
Download figure:
Standard image High-resolution image
Figure 9. Deposits using NaF-AlF3 cryolite with no alumina feeding at 4 wt.% Si, CR = 2.2, CCD = 0.9 A cm−2, t = 4 h, (1) T = 965 °C, has two areas P1 and P2, (2) T = 980 °C.
Download figure:
Standard image High-resolution image
Figure 10. Deposits using NaF-AlF3 cryolite, CR = 2.2, CCD = 0.9 A cm−2, t = 4 h, (1) T = 980 °C, 2 wt.% Al2O3 at 1 wt.% Si, (2) T = 970 °C at 1 wt.% Si.
Download figure:
Standard image High-resolution imageAs seen in Figs. 11 and 12, the presence of Si in the melt did decrease the conductivity which was translated into higher cell voltage. Interestingly, Fig 11 shows that when the initial alumina content added was reduced by half while keeping a silicon content of 1 wt.%, the conductivity was lower. The temperature has a positive effect on conductivity as seen in Figs. 11 and 12 as expected. 18
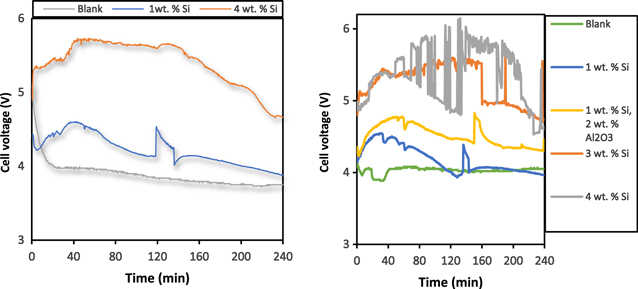
Figure 11. Cell voltage behavior during electrolysis at different initial contents of Si: (1) (left) at 965 °C, (2) (right) at 980 °C.
Download figure:
Standard image High-resolution image
Figure 12. Cell voltage behavior during electrolysis: (1) (left) at different initial contents of Si, 970 °C, (2)(right) blank tests at 965 °C,970 °C, and 980 °C.
Download figure:
Standard image High-resolution imageThe mechanism based on the dissociation of silica into Si4+ and O2− in the cryolite-based melt has been suggested by Monnier's study. 11 In principle the presence of Si4+ in the cryolite-based melt should have increased the conductivity since the silicon cation (IV) has a charge to ionic radius ten times greater than sodium cation. 21 Experimentally, the conductivity is reduced due to the presence of silica which is an indication of a possible formation of large complex anions such as SiO2F2 2− and Si2O4F3 3− which have low mobility. 22
Such anions may increase the melt viscosity due to the possible formation of a glassy network which hinders the charge transport of the smaller ion. 23 Silica has a stronger effect on the conductivity in comparison with alumina in cryolite-based melts. Alumina has aluminium in common with cryolite which means the structural changes are less pronounced and as a result, less effect on the conductivity is expected. 21 Alumina dissociates in cryolite forming fluoride-containing anions while the concentration of the sodium cation is not significantly affected. The decrease in the conductivity is more pronounced in cryolite-silica melt due to the increase in the viscosity as well as the formation of aluminosilicates which reduces the free sodium cations' concentration.
Solidified deposit surface characterization
A sample (deposit appearing in Fig. 9) was characterized by SEM/EDX. Two areas on the solidified deposit (P1 and P2) were analyzed. As seen in Fig. 13 (corresponds to area P1 in Fig. 9), silicon seemed to form an alloy with aluminium. Other impurities which may have come from the raw materials or the substrate of the cathode were detected. SEM showed some porous areas on the surface.

Figure 13. EDX elemental mapping images of area 1 (P1) of deposit appearing in Fig. 9 showing the presence of Si on Al.
Download figure:
Standard image High-resolution imageThe EDX mapping spectrum of P1 showed about 13.4 wt.% Si and 86.6 wt.% Al as seen in Fig. 14. These are different phases formed during solidification, probably alpha-Al and an Al-Si eutectic mixture. In P1 the composition is closer to the eutectic composition so the alpha-Al phase would not form before the eutectic solidifies to a much finer structure based on the phase diagram in Fig. 1. At P2 SEM showed silicon present along with some frozen alumina and/or silica on the surface reflected by the presence of oxygen as seen in Fig. 15. The EDX of this area gave about 10 wt.% Si and 90 wt.% Al according to Fig. 16.

Figure 14. EDX spectrum of area 1 of deposit appearing in Fig. 9 (P1) showing the presence of Si on Al.
Download figure:
Standard image High-resolution image
Figure 15. EDX elemental mapping images of area 2 (P2) of solidified deposit appearing in Fig. 9 showing the presence of Si on Al.
Download figure:
Standard image High-resolution image
Figure 16. EDX spectrum of area 2 of deposit appearing in Fig. 9 (P2) showing the presence of Si on Al.
Download figure:
Standard image High-resolution image
Conclusions
The effect of the actual operating temperature on the current efficiency for aluminium deposition has been in good agreement with that reported in the literature.
The Co-deposition of silicon to produce Al-Si alloys was studied in a laboratory cell dedicated to aluminium current efficiency measurements. The values obtained for apparent current efficiencies were incomparable to those for blank tests at the same conditions which may indicate the infeasibility of the process to be implemented in Hall-Heroult industrial cells at relatively high contents of silicon added.
The introduction of silicon by adding silica to the electrolyte negatively affects the apparent current efficiency for aluminium regardless of the operating temperature which may be due to the co-deposition of silicon, and incomplete dissolution of silica in the electrolyte which can cause sludge. The results suggest that for every 1 wt.% Si initially added to the electrolyte the average reduction in the apparent current efficiency is in the range of 9%. Results also suggest that the higher the initial content of silica added to the bath the lower the apparent current efficiency which may be due to the high content of oxide in the bath which as a result may lead to sludge formation. A lower apparent current efficiency was recorded at lower initial alumina concentration while keeping the initial added silica content fixed at the same operating conditions. This can be explained by higher alumina content increasing silica solubility, which reduces the sludging.
ICP results of one metallic sample suggested the formation of Si hypoeutectic alloy. Solidified deposits of deformed surfaces along with detached metallic lumps were observed. The cell voltage behavior for deposits suggests a suppression in the conductivity of the electrolyte due to the presence of dissolved silicon-containing species. The higher the temperature the larger the decrease in the conductivity seemed to be as indicated by higher cell voltage. The characterization of one metallic deposit using SEM/EDX showed some porosity on one area whereas it showed a spread of silicon on aluminium on the surface. Al-13% Si (hypereutectic) and Al-10% Si (hypoeutectic) were found.
Acknowledgments
The Norwegian University of Science and Technology's financial support is greatly acknowledged. Special thanks are due to Muhammad Zubair from Chemical Engineering Department (NTNU) for helping with SEM/EDX.