
Abstract
The natural convection boundary layer ( ) and its influence on cathodic current in a galvanic couple under varying electrolytes as a function of concentration (1 − 5.3 M NaCl) and temperature (25 °C−45 °C) were understood. Polarization scans were obtained under quiescent conditions and at defined boundary layer thicknesses using a rotating disk electrode on platinum and stainless steel 304L (SS304L); these were combined to determine
  With increasing chloride concentration and temperature,
  decreased. Increased mass transport (Sherwood number) results in a decrease in
  providing a means to predict this important boundary. Using Finite Element Modeling, the cathodic current was calculated for an aluminum alloy/SS304L galvanic couple as a function of water layer (WL) thickness and cathode length. Electrolyte domains were delineated, describing (i) dominance of ohmic resistance over mass transport under thin WL, (ii) the transition from thin film to bulk conditions at
  and (iii) dominance of mass transport under thick WL. With increasing chloride concentration, cathodic current decreased due to decreases in mass transport. With increasing temperature, increased cathodic current was related to increases in mass transport and solution conductivity. This study has implications for sample sizing and corrosion prediction under changing environments.
Export citation and abstract BibTeX RIS

This is an open access article distributed under the terms of the Creative Commons Attribution Non-Commercial No Derivatives 4.0 License (CC BY-NC-ND, http://creativecommons.org/licenses/by-nc-nd/4.0/), which permits non-commercial reuse, distribution, and reproduction in any medium, provided the original work is not changed in any way and is properly cited. For permission for commercial reuse, please email: permissions@ioppublishing.org.
Metallic structures are commonly exposed to marine atmospheric conditions, characterized by thin electrolyte layers allowing for the formation an electrochemical or corrosion cell. The electrolyte can be formed through salt spray or deliquescence of salt as either a droplet or a thin water layer (WL) on the alloy surface and the chemical composition and thickness can vary widely. 1 As such, the rate and extent of corrosion on the alloy surface is dictated by the combination of environmental, physicochemical, and geometric variables, which include relative humidity (RH), temperature, electrolyte conductivity, electrolyte film thickness, in addition to the electrochemical kinetics on the alloy surface. 2–6 Due to the large potential variation in environmental conditions and WL thicknesses, modeling can serve as an important tool to evaluate environmental effects on the corrosion of alloys and galvanic couples.
One of the most important controlling factors for corrosion in atmospheric environments is the WL thickness. Tomashov initially recognized a corrosion rate dependence with WL thickness and qualitatively described four different reaction control mechanisms. Under bulk, full immersion conditions, a plateau in corrosion rate is seen and a constant diffusion layer is achieved. Decreasing the WL causes an increased corrosion rate which is due to more rapid diffusion of oxygen across the thinner WL. Further decreasing the WL thickness reduced dissolution due to anodic control (owing to lower corrosion product solubility in a smaller solution volume). Finally, once a continuous film is lacking, the final regime is reached and is characterized by a very low corrosion rate of dry chemical oxidation. 4 While useful conceptually, the outline presented by Tomashov lacked a demonstrated quantitative description between electrochemical kinetics and the film thickness.
Numerous authors have attempted to quantitatively determine the transition from bulk, full immersion kinetics to thin film kinetics.
4,7–34
The transition occurs at the natural convection boundary layer ( ) and is formed on surfaces affected by convection or advection in response to thermally or compositionally driven spatially inhomogeneous density distributions.
32
This flow prevents a concentration gradient of the oxidized or reduced species from extending to large distances away from the electrode (i.e. the concentration gradient is finite and close to the surface). In the absence of natural convection, the diffusional boundary layer would continuously increase with time, lowering the diffusion-limited current density (ilim) continuously
9
; however, an ilim is observed in many cases. The quantification of
) and is formed on surfaces affected by convection or advection in response to thermally or compositionally driven spatially inhomogeneous density distributions.
32
This flow prevents a concentration gradient of the oxidized or reduced species from extending to large distances away from the electrode (i.e. the concentration gradient is finite and close to the surface). In the absence of natural convection, the diffusional boundary layer would continuously increase with time, lowering the diffusion-limited current density (ilim) continuously
9
; however, an ilim is observed in many cases. The quantification of  in solutions of various compositions has yielded values from near 250 μm
21,24–27,35
to between 500 and 1000 μm.
9,16,17,19,20,33
Several methods exist to quantify
in solutions of various compositions has yielded values from near 250 μm
21,24–27,35
to between 500 and 1000 μm.
9,16,17,19,20,33
Several methods exist to quantify  however, recently, Liu et al. utilized a rotating disk electrode (RDE) and quiescent cathodic polarization scans to quantify
  in a dilute chloride-containing brine which could form under atmospheric conditions.
9
It was determined that in 0.6 M NaCl, in which the oxygen reduction reaction (ORR) is dominant and the diffusion of oxygen to the metal surface is the rate limiting process,
36
in a dilute chloride-containing brine which could form under atmospheric conditions.
9
It was determined that in 0.6 M NaCl, in which the oxygen reduction reaction (ORR) is dominant and the diffusion of oxygen to the metal surface is the rate limiting process,
36
 was roughly 800 μm.
9
Below
was roughly 800 μm.
9
Below  the flux of oxygen to the surface of the cathode is determined by the WL thickness. While the method presented provides a robust framework, there is still a gap in literature regarding
  as a function of common environmental parameters such as brine composition, concentration, and temperature.
Models have been presented in literature to understand  21,24
Of particular note, Amatore et al.
24
described a micro-convection approach in which a diffusion-like term was used to account for natural convection. Dolgikh et al.
21
used this idea and extended it to multi-ion environments. While models exist to investigate natural convection, these models have not been widely applied, and the effects of
21,24
Of particular note, Amatore et al.
24
described a micro-convection approach in which a diffusion-like term was used to account for natural convection. Dolgikh et al.
21
used this idea and extended it to multi-ion environments. While models exist to investigate natural convection, these models have not been widely applied, and the effects of  on the extent of corrosion in various environments have seldom been explored. Typically, atmospheric, thin film (<
  ) corrosion modeling scenarios are presented in modeling.
6,9–12,37–42
For example, Palani et al. examined the effect solution concentration on a galvanic couple between AA2024 and a carbon-fiber reinforced polymer (CFRP) as a function of WL thickness. Although they found good agreement between experimental and modeling results, Palani and coworkers only explored dilute concentrations (≤ 0.6 M NaCl), small electrode configurations (0.01 m), and thin WL (< 50 μm).
40
On the other hand, Liu et al. determined the dependence of the cathodic current delivery capacity on the electrolyte film thickness with relation to
) corrosion modeling scenarios are presented in modeling.
6,9–12,37–42
For example, Palani et al. examined the effect solution concentration on a galvanic couple between AA2024 and a carbon-fiber reinforced polymer (CFRP) as a function of WL thickness. Although they found good agreement between experimental and modeling results, Palani and coworkers only explored dilute concentrations (≤ 0.6 M NaCl), small electrode configurations (0.01 m), and thin WL (< 50 μm).
40
On the other hand, Liu et al. determined the dependence of the cathodic current delivery capacity on the electrolyte film thickness with relation to  and cathode size in an AA2024/SS316L galvanic couple in 0.6 M NaCl at 25 °C. In their study, the total cathodic current was calculated using cathodic boundary conditions obtained through RDE by integrating the current density across the electrode. Various electrolyte layer domains were delineated by WL thicknesses and cathode sizes. For thin films less than
  the total current was generally independent of the size of the cathode and the nature of kinetics at the electrochemical interface, being solely driven by the ohmic resistance in solution. For thick films greater than
  mass transport (M-T) of oxygen to the cathode surface and cathode size dictated the total current. As such,
  defined the upper limit of the thin film regime,
9
and this needs to be understood as a function of exposure environment in order to inform upon atmospheric corrosion.
defined the upper limit of the thin film regime,
9
and this needs to be understood as a function of exposure environment in order to inform upon atmospheric corrosion.
When dissimilar alloys are present under an electrolyte and in electrical contact, a galvanic couple forms and, in combination with the WL thickness and composition, serves as another controlling factor that can influence corrosion. The WL will influence both diffusional kinetics at the cathode and ohmic drop in solution between the anode and cathode, affecting the total amount of cathodic current available to drive dissolution at the anode. 9,12,37,39,41,43 However, synergies often exist between the cathode and anode and a majority of the work to date has focused primarily on either one or the other of these two regions.
Finally, it is important to put the WL thicknesses presented in this paper into perspective. In atmospheric conditions, a deliquesced WL is dependent upon RH, salt composition, and loading density of the salt (LD), and ranges from 1–200 μm under typical conditions.
1,44
RDE experiments simulate a WL (Eq. 2) by imposing a hydrodynamic boundary layer which can range from 7–200 μm depending on rotation rate, solution composition/concentration, and temperature.
9,36,45
Third, salt spray accelerated corrosion testing, such as ASTM B117,
46
creates varying WL thickness from 660–1210 μm and depends heavily on the angle of exposure.
47
Finally,  determines the transition between thin film and bulk corrosion kinetics and again is dependent upon the solution composition and concentration. For 0.6 M NaCl at 25 °C solution
  was calculated to be 800 μm.
9
At 25 °C and 0.6 M NaCl, an enormous LD of roughly 27 g m−2 would be needed to reach
was calculated to be 800 μm.
9
At 25 °C and 0.6 M NaCl, an enormous LD of roughly 27 g m−2 would be needed to reach  via deliquescence of surface salt deposits
44
which is unlikely to be achieved under typical conditions. Thus, the WL thickness (dependent on LD and RH) will likely be controlling the flux of oxygen to the surface and ultimately the cathodic current in atmospheric conditions. However, it should be noted that under either condensation, rain, or salt spray, WLs above 1,000 μm are likely, at least transiently. In addition, the accumulation of corrosion products or inert dust may, through capillary action, create WL that are effectively much larger in terms of the diffusion of oxygen. A wide range of WL thicknesses will be explored in this paper, from thin WL (7 μm or 7 × 10⁻⁶ m) to thick WL (50,000 μm or 5 × 10⁻² m), encompassing WLs that are present in atmospheric, salt spray, and full immersion conditions.
via deliquescence of surface salt deposits
44
which is unlikely to be achieved under typical conditions. Thus, the WL thickness (dependent on LD and RH) will likely be controlling the flux of oxygen to the surface and ultimately the cathodic current in atmospheric conditions. However, it should be noted that under either condensation, rain, or salt spray, WLs above 1,000 μm are likely, at least transiently. In addition, the accumulation of corrosion products or inert dust may, through capillary action, create WL that are effectively much larger in terms of the diffusion of oxygen. A wide range of WL thicknesses will be explored in this paper, from thin WL (7 μm or 7 × 10⁻⁶ m) to thick WL (50,000 μm or 5 × 10⁻² m), encompassing WLs that are present in atmospheric, salt spray, and full immersion conditions.
This paper measures cathodic kinetics on platinum (Pt) and stainless steel 304L (SS304L) under varying electrolyte layers using an RDE, and quantitatively determines  as a function NaCl concentration and temperature. Cathodic kinetics in NaCl and MgCl2
45
and knowledge of
as a function NaCl concentration and temperature. Cathodic kinetics in NaCl and MgCl2
45
and knowledge of  are combined to inform upon cathodic currents in a galvanic couple between SS304L and an aluminum alloy (AA) 7050-T7451 across thin film to bulk conditions. The results of this study identify not only trends in
  that can be described by mass transport phenomena but also discusses controlling mechanisms for galvanic corrosion under varying environmental conditions.
Experimental
Methods utilized within are similar to Alexander et al. 36 and Katona et al. 45 and brief descriptions of these methods are given below.
Brine properties
The density  dissolved oxygen concentration
  and viscosity
  were measured for NaCl brines (0.6 M to saturated) at 25 °C, 35 °C, and 45 °C. Solution
  were measured using hydrometers calibrated for specific gravity ranges from 1.000 to 1.220, and 1.20 to 1.420. Hydrometer accuracies at temperatures above their calibration temperature was verified by measuring the density of saturated NaCl solutions at the temperatures of interest.
48
were measured using hydrometers calibrated for specific gravity ranges from 1.000 to 1.220, and 1.20 to 1.420. Hydrometer accuracies at temperatures above their calibration temperature was verified by measuring the density of saturated NaCl solutions at the temperatures of interest.
48
 measurements were taken using the Chesapeake Bay Institute-modified Winkler iodometric titration method.
49,50
Briefly, samples were heated to the temperature of interest and equilibrated with the ambient air for a few hours, then transferred to a glass-stopper flask, which was calibrated gravimetrically with DI water to contain a total solution volume of 146 ml. Next, 1 ml of 3 M manganese (II) sulfate (MnSO4) and 1 ml of basic potassium iodide (KI) (4 M KI in 8 M NaOH) were added to the flask and capped to allow for minimal air to exist in the flask. The contents of the flask were thoroughly mixed using a magnetic stir bar for several minutes for the KI to disperse and break apart precipitates that formed. To quench the reaction, 50% sulfuric acid (H2SO4) was added along with a starch indicator.
measurements were taken using the Chesapeake Bay Institute-modified Winkler iodometric titration method.
49,50
Briefly, samples were heated to the temperature of interest and equilibrated with the ambient air for a few hours, then transferred to a glass-stopper flask, which was calibrated gravimetrically with DI water to contain a total solution volume of 146 ml. Next, 1 ml of 3 M manganese (II) sulfate (MnSO4) and 1 ml of basic potassium iodide (KI) (4 M KI in 8 M NaOH) were added to the flask and capped to allow for minimal air to exist in the flask. The contents of the flask were thoroughly mixed using a magnetic stir bar for several minutes for the KI to disperse and break apart precipitates that formed. To quench the reaction, 50% sulfuric acid (H2SO4) was added along with a starch indicator.  was measured via titration of the acidified solution by sodium thiosulfate (Na2S2O3).
  was measured at each temperature, using a Brookfield AMETEK LDTV2T Viscometer with an ultra-low
  adaptor. Roughly 16 ml of each sample was transferred to the sample cell, and each temperature set point equilibrated for 10 min. Five spindle speeds were analyzed to achieve a torque between 10% and 95% to verify the Newtonian fluid relationship. Solution properties for MgCl2 were obtained from Katona et al.
45
adaptor. Roughly 16 ml of each sample was transferred to the sample cell, and each temperature set point equilibrated for 10 min. Five spindle speeds were analyzed to achieve a torque between 10% and 95% to verify the Newtonian fluid relationship. Solution properties for MgCl2 were obtained from Katona et al.
45
Materials
High-speed rotating disc electrodes (RDE) with a diameter of 5 mm comprised of SS304L and 99.99% Pt were acquired from Pine Research Instrumentation, Inc. (USA). Prior to each use, the electrodes were polished using a 1 μm Dialube Diamond Suspension®, then rinsed with ultrapure (18.2 MΩ-cm) water and dried with nitrogen (N2). Brine solutions were prepared using ultrapure water and reagent grade chemicals (≥ 99.0% purity).
Electrochemical tests
A three-electrode cell was used with the alloy specimen as the working electrode (WE), a saturated calomel reference electrode (SCE), and a Pt-coated niobium mesh as the counter electrode. The exposed area of the WE during testing was 0.196 cm2. Samples were immersed in the solution and temperature of interest in a 150 ml water-jacketed cell and sparged with lab air to maintain a solution saturated in O2. The WE was rotated using a Pine instruments MSR rotator with an accuracy of ± 1 % of the display reading. Rotation speeds ranged from 100 to 6000 rpm, with multiple repetitions carried out at the 500 rpm speed to evaluate method uncertainty. All solutions exhibited laminar flow. The solution temperature was controlled to 25, 35, or 45 ± 1 °C using a water circulator and thermostat. Quiescent polarization scans were performed with the working electrode perpendicular to gravity which permits the assumption of an equivalent diffusional boundary layer thickness for natural convection. 33 Cathodic polarization measurements were performed on SS304L and Pt in 1, 3, and 5.3 M (saturated) NaCl at scan rates of 0.167 and 1 mV s−1 respectively after 1 h of open circuit potential (OCP) equilibration and stabilization. The scans were performed from OCP to −1.2 VSCE.
Analysis
The theoretical diffusion-limited current density  can be calculated by Fick's first law and assuming one-dimensional diffusion via

where  is the number of electrons transferred,
  is Faraday's constant
 is the diffusivity of the reacting species,
  and
and  (assumed to be zero) are the concentrations of the reacting species in the bulk solution and at the electrode surface respectively, and
  is the hydrodynamic boundary layer thickness. When using an RDE,
  is given as a function of rotation speed (
 in
in  ) through,

where  is the kinematic viscosity
  8
Substituting Eq. 2 into 1 yields the Levich equation
45,51
:
8
Substituting Eq. 2 into 1 yields the Levich equation
45,51
:

The Levich equation only applies at non-zero rotation rates, as at  = 0,
= 0,  would be zero and the boundary layer thickness infinite. Experimentally, a finite current density is observed for stagnant electrodes. The finite current density is controlled by
  which can determined through the method of Liu et al..
9
Briefly,
which can determined through the method of Liu et al..
9
Briefly,  from RDE experiments is plotted as a function of
  and a linear fit is achieved (Fig. 3 from Liu et al.
9
and Fig. 3 from Charles-Granville et al.
33
).
and a linear fit is achieved (Fig. 3 from Liu et al.
9
and Fig. 3 from Charles-Granville et al.
33
).  from a quiescent polarization scan in full immersion, under quiescent conditions (0 rpm, referred to as
  ) is then obtained. The intersection of
  with the linear fit yields
Further analysis was performed by calculating the overall mass transfer coefficient ( ), given by,

Finally, the Sherwood number ( also known as the Nusselt number for mass transfer) is calculated, given by


Finite element modeling
Modeling described here is an extension of previous work from Liu et al. and the model and initial results are described in more detail in the original publication. 9 It is noted that results from Liu et al. utilized SS316L polarization scans while work here was performed on SS304L. 9 Briefly, the modeling framework is based on the Laplace Equation. 52 COMSOL Multiphysics v5.5 (COMSOL, Inc., Burlington, MA) software was utilized. The potential and current distributions along a SS304L cathode coupled galvanically with AA7050-T7451 were modeled using a simplified, two-dimensional geometry which represented the cross-section of a couple under a WL, as depicted in Fig 1. The anode length was fixed at 0.01 m, and the range of cathode lengths considered in this study varied from 0.01 m to 0.5 m, corresponding to an area ratio of 1:1 to 1:50, respectively. The width of both electrodes was considered identical, obviating the necessity for a three-dimensional model. As such, the current per width (IC /W) is calculated due to the two-dimensional model. The WL thickness was varied across roughly four orders of magnitude from 8 μm to 50,000 μm (8 × 10⁻⁶–5 × 10⁻² m) in order to provide a sufficiently range to capture exposure conditions representative of thin films and full immersion. The lower limit of WL was set by the physical limitations of the RDE; above a certain rotation speed (typically above 6000 rpm), the hydrodynamic boundary layer thickness experiences turbulence and Levich behavior no longer exists.
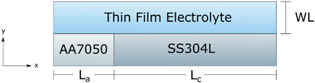
Figure 1. Schematic configuration of a galvanic couple under a thin water layer (SS304L cathode with AA7050 anode in this study). Width of anode/cathode is normal to x-y plane. Figure adapted from Liu et al. 9
Download figure:
Standard image High-resolution imageThe values used for solution conductivity ( ) were obtained from OLI Studio Analyzer 9.5 (OLI Systems, Inc., Cedar Knolls, NJ). Plots of
  can be seen in Katona et al. for NaCl solutions
53
and Katona et al. for MgCl2.
54
The anodic boundary conditions (B.C.) were the anodic kinetics of AA7050 (anodic B.C.) obtained from Liu et al.
9
and were assumed to be constant across all chloride concentrations and temperatures. Cathodic B.C. were measured for SS304L cathodic polarizations in NaCl as a function of
can be seen in Katona et al. for NaCl solutions
53
and Katona et al. for MgCl2.
54
The anodic boundary conditions (B.C.) were the anodic kinetics of AA7050 (anodic B.C.) obtained from Liu et al.
9
and were assumed to be constant across all chloride concentrations and temperatures. Cathodic B.C. were measured for SS304L cathodic polarizations in NaCl as a function of  (rpm). When WL thicknesses were greater than
  the cathodic, quiescent polarization scan was utilized. Any WL less than
  utilized the cathodic polarization scan corresponding to the WL. Cathodic polarizations for MgCl2 were taken from previous work
45
and it is noted that there was no observed rotational dependence in MgCl2 electrolytes. All calculations were assumed to be steady state and the polarization scans were not dependent upon pH. Both anodic and cathodic currents were measured, and it was ensured currents were identical.
utilized the cathodic polarization scan corresponding to the WL. Cathodic polarizations for MgCl2 were taken from previous work
45
and it is noted that there was no observed rotational dependence in MgCl2 electrolytes. All calculations were assumed to be steady state and the polarization scans were not dependent upon pH. Both anodic and cathodic currents were measured, and it was ensured currents were identical.
Results
First, solution properties are presented for NaCl solutions as a function of concentration and temperature. These properties are further utilized to calculated diffusional boundary layers for each rotation rate. Next, cathodic kinetics and Levich behavior for Pt and SS304L are presented as a function of rpm, solution concentration, and temperature. Third, the calculated boundary layers and limiting current densities are utilized to calculate  under quiescent conditions. The
  is then correlated to the Sh. Finally, knowledge of
  and the obtained cathodic kinetics are utilized to inform upon the cathodic current from an AA/SS galvanic couple as a function of solution composition (NaCl and MgCl2 solutions), solution concentration, temperature, WL thickness, and cathode length.
Solution properties
Measured solution properties, 
 and
and  are presented in Figs. 2a–2c respectively, as a function of chloride concentration and temperature for NaCl and MgCl2 electrolytes. Values for MgCl2 are obtained from Katona et al..
45
Calculated
are presented in Figs. 2a–2c respectively, as a function of chloride concentration and temperature for NaCl and MgCl2 electrolytes. Values for MgCl2 are obtained from Katona et al..
45
Calculated  (from OLI studio) are presented in Fig. 2d as a function of chloride concentration and temperature for NaCl and MgCl2 electrolytes. With increasing chloride concentration,
  and
and  decrease while
  and
and  increase. With increasing temperature,
 and
and  decrease while
  increases.
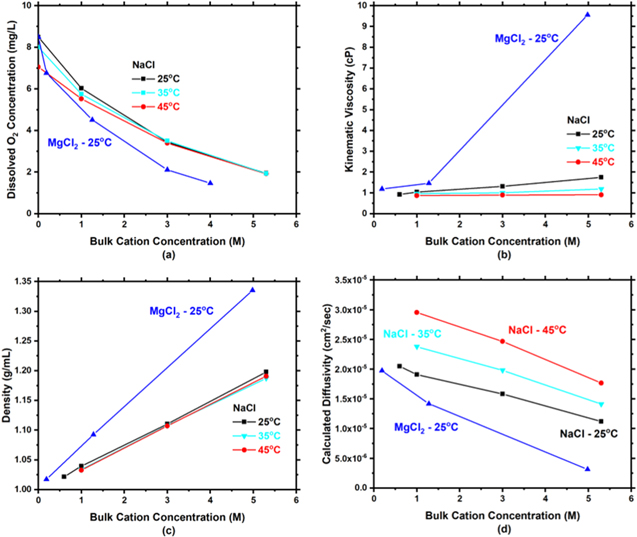
Figure 2. Experimentally measured (a) dissolved oxygen, (b) kinetic viscosity, and (c) density for NaCl and MgCl2 solutions as a function of chloride concentration and temperature. It is noted that values for MgCl2 are obtained from Katona et al.. 45 (d) Calculated (modeled) oxygen diffusivity using OLI Studio for NaCl and MgCl2 solutions as a function of chloride concentration and temperature. It is noted that the lines present are not fits but are present to help the reader connect points.
Download figure:
Standard image High-resolution imageCathodic kinetics
Platinum
Measured cathodic polarization scans on Pt in a range of NaCl solution concentrations (1, 3, 5.3 M NaCl) and temperatures (25 °C, 35 °C, and 45 °C) are presented in Fig. 3. The corresponding calculated  using Eq. 2 and solution properties presented in Fig. 2 are given alongside the rotation speeds. The polarization measurements are characterized by an ORR activation-controlled region from OCP to approximately −0.1 VSCE, followed by mass transfer (M-T) controlled ORR from −0.1 VSCE to −0.8 VSCE and finally HER below −0.8 VSCE. The potential of the transition to M-T kinetics is dependent upon rotation rate. With increasing solution concentration, ilim decreases and with increasing temperature, ilim increases.
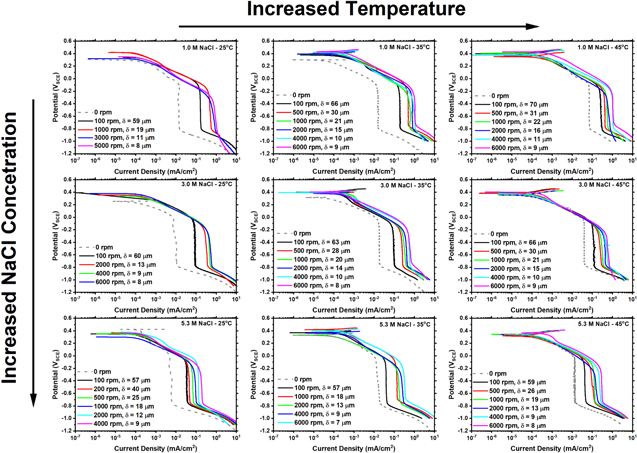
Figure 3. Experimentally measured cathodic polarization scans for platinum in NaCl electrolyte at multiple concentrations (1, 3, 5.3 M) and temperatures (25 °C, 35 °C, and 45 °C). It is noted that moving from the top to the bottom increases the concentration and moving from left to right increases temperature.
Download figure:
Standard image High-resolution imageStainless steel 304L
Cathodic polarizations measured on SS304L are shown in Fig. 4 for the same solution concentrations and temperatures as Pt. The polarization measurements are characterized by an ORR activation-controlled region from OCP to approximately −0.6 VSCE followed by M-T controlled ORR from −0.8 VSCE to −1 VSCE and finally HER below −1 VSCE. As with Pt, the transition to M-T kinetics is dependent upon rotation rate. It is noted that as  decreases, there is an unusual transition behavior between the activation-controlled regime and the M-T controlled region in the potential range of −0.6 to −0.8 VSCE. With smaller
  the transition becomes more pronounced. The same concentration and temperature trends that were present in Pt are present for SS304L.
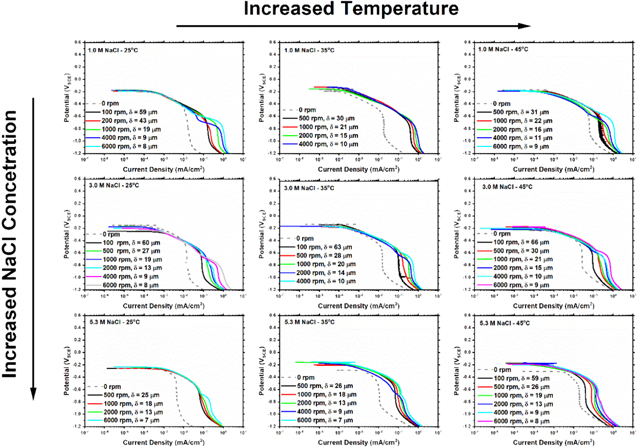
Figure 4. Experimentally measured cathodic polarization scans for SS304L in NaCl electrolyte at multiple concentrations (1, 3, 5.3 M) and temperatures (25 °C, 35 °C, and 45 °C). It is noted that moving from the top to the bottom increases the concentration and moving from left to right increases temperature.
Download figure:
Standard image High-resolution imageLevich analysis
Levich plots for Pt and SS304L are shown in Fig. 5 for all chloride concentrations and temperatures. Also plotted in Fig. 5 is the predicted Levich behavior (Eq. 3) for each NaCl solution for n = 4 (ORR reaction producing four hydroxyl ions) using the properties from Fig. 2. In general, Pt exhibits linear Levich behavior being slightly below the predicted Levich behavior for a four-electron transfer. It is noted that as the rotation rate is increased, ilim for SS304L decreases with respect to values for Pt. There is no trend in this behavior with concentration or temperature. Additionally, n was calculated for both Pt and SS304L for all chloride concentrations and temperatures and yielded values between 3.8–3.4, and no trend with chloride concentration or temperature was present. It is noted that SS304L had a lower calculated n in comparison to Pt.

Figure 5. Levich analyses for platinum and SS304L as a function of chloride concentration and temperature. It is noted that moving from the top to the bottom increases the concentration and moving from left to right increases temperature. The dashed line represents theoretical behavior from experimental and modeling results while individual points represent experimentally determined values.
Download figure:
Standard image High-resolution imageNatural convection boundary layer
Calculated  values, based on the formulism of Liu et al.,
9
are presented for NaCl solutions as a function of chloride concentration and temperature in Fig. 6a. Also shown in Fig. 6a are values obtained for
values, based on the formulism of Liu et al.,
9
are presented for NaCl solutions as a function of chloride concentration and temperature in Fig. 6a. Also shown in Fig. 6a are values obtained for  in 0.6 M at 25 °C from Liu et al.
9
and Charles-Granville et al..
33
Overall, with increasing chloride concentration,
in 0.6 M at 25 °C from Liu et al.
9
and Charles-Granville et al..
33
Overall, with increasing chloride concentration,  decreases. Additionally, with increasing temperature,
  decreases. It is noted that values of
  were calculated using ilim for both Pt and SS304L. Generally, SS304L had a higher
  due to a lower ilim. Figure 6b compares
  for NaCl to MgCl2 as a function of chloride concentration at 25 °C. Polarization scans for MgCl2 on Pt were obtained from Katona et al..
45
Below 5 M chloride,
for NaCl to MgCl2 as a function of chloride concentration at 25 °C. Polarization scans for MgCl2 on Pt were obtained from Katona et al..
45
Below 5 M chloride,  is similar for both salts.
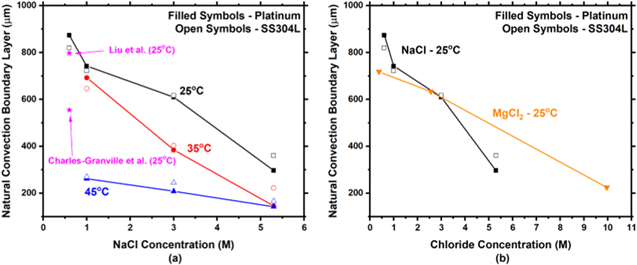
Figure 6. Experimentally calculated natural convection boundary layer thickness as a function of (a) NaCl concentration and temperature and (b) solution composition (NaCl and MgCl2) at 25 °C. It is noted that the x-axis of (b) is total chloride concentration.
Download figure:
Standard image High-resolution imageAs seen in Fig. 7,  decreases with increased calculated Sh (Eq. 5),. Also included in Fig. 7 are values obtained for
  in 0.6 M NaCl at 25 °C from Liu et al.
9
and Charles-Granville et al.,
33
0.6 M sodium hydroxide (NaOH) from Katona et al.,
55
and 10 mM potassium ferrocyanide
in 0.6 M NaCl at 25 °C from Liu et al.
9
and Charles-Granville et al.,
33
0.6 M sodium hydroxide (NaOH) from Katona et al.,
55
and 10 mM potassium ferrocyanide  from Amatore et al.
25
all at room temperature. The fit present in Fig. 7 utilized data only from this experiment, but values of
from Amatore et al.
25
all at room temperature. The fit present in Fig. 7 utilized data only from this experiment, but values of  from literature
9,25,33,55
show good agreement with the fit.
from literature
9,25,33,55
show good agreement with the fit.
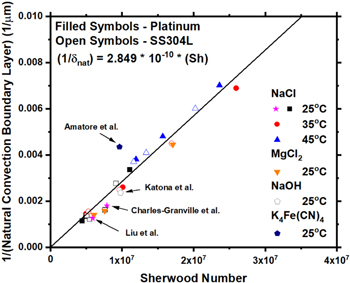
Figure 7. Inverse of natural convection boundary layer as a function of calculated Sherwood number (Sh). Values also plotted were obtained from Liu et al., 9 Charles-Granville et al., 33 Katona et al., 55 and Amatore et al.. 25
Download figure:
Standard image High-resolution imageModeling in a galvanic couple
Cathodic current per width as a function of WL thickness and cathode length at 25 °C
The modeled potential and current density as a function of distance away from the AA/SS interface for 1 M NaCl at 25 °C and an LC = 0.3 m are presented in Fig. 8. With increasing distance from the AA/SS interface, the potential rises from the coupling potential of AA and SS, nearing the open circuit potential of the SS at far distances. At the same time, the current density of the cathode decreases with increasing distance from the interface. When considering the logarithmic distance from the AA/SS interface (Fig. 8b), the current density is constant near the interface and decreases rapidly at greater distances. The total cathodic current per width (IC /W) is obtained by integrating the current density along the entire cathode length.
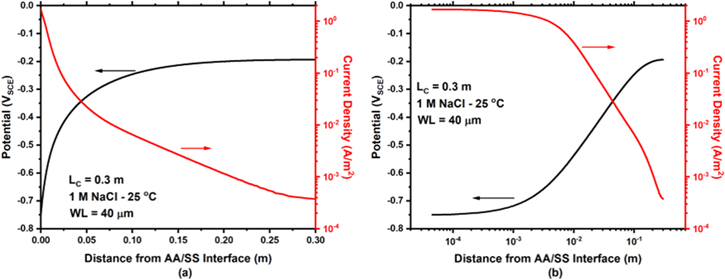
Figure 8. (a) Modeled potential and current density distributions of the cathode as a function of linear distance from the AA/SS interface for 1 M NaCl at 25 °C and a cathode length of 0.3 m. (b) Distributions in (a) with a logarithmic distance from the AA/SS interface.
Download figure:
Standard image High-resolution image
IC
/W for a SS304L cathode vs WL thickness as a function of cathode length (LC
) at 25 °C are presented in Figs. 9a–9c for 1, 3, and 5.3 M NaCl, respectively. For small cathodes (< 0.16, < 0.18, and < 0.32 m for 1, 3, and 5.3 M respectively), IC
/W increases with WL thickness, then decreases to an intermediate minimum at  before reaching a plateau. For intermediate and large cathode lengths ( ≥ 0.16, ≥ 0.18, and ≥ 0.32 m for 1, 3, and 5.3 M respectively) IC
/W grew before reaching a first plateau at WL thicknesses from roughly 100 μm to
before reaching a plateau. For intermediate and large cathode lengths ( ≥ 0.16, ≥ 0.18, and ≥ 0.32 m for 1, 3, and 5.3 M respectively) IC
/W grew before reaching a first plateau at WL thicknesses from roughly 100 μm to  (Fig. 6), and then again increased with WL until reaching a second plateau. The second plateau increases with LC
. The LC
denoted as the transition from small to large cathode is considered the critical cathode length (LCrit
). At LCrit
, IC
/W does not decrease with increasing WL thickness above
(Fig. 6), and then again increased with WL until reaching a second plateau. The second plateau increases with LC
. The LC
denoted as the transition from small to large cathode is considered the critical cathode length (LCrit
). At LCrit
, IC
/W does not decrease with increasing WL thickness above  due to M-T kinetic limitations. Below LCrit
, IC
/W decreases with increasing WL thickness as the current has influences from both ohmic control and M-T limitations. At values above LCrit
, IC
/W is limited by the cathode size and becomes independent of WL thickness due to M-T limitations.
due to M-T kinetic limitations. Below LCrit
, IC
/W decreases with increasing WL thickness as the current has influences from both ohmic control and M-T limitations. At values above LCrit
, IC
/W is limited by the cathode size and becomes independent of WL thickness due to M-T limitations.
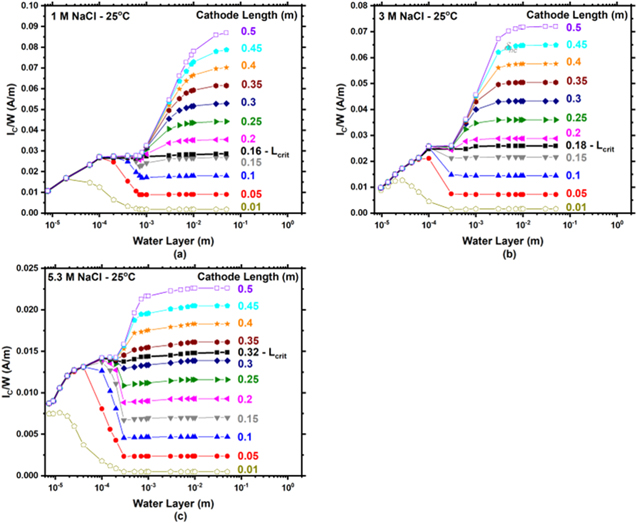
Figure 9. Modeled total cathodic current per cathode width (IC/W) vs water layer thickness as a function of cathode length at 25 °C for (a) 1, (b) 3, and (c) 5.3 M NaCl. It is noted that the ordinate in all graphs is different.
Download figure:
Standard image High-resolution imageCathodic current per width as a function of WL thickness and cathode length at 45 °C
IC /W for a SS304L cathode vs WL thickness as a function of LC at 45 °C are presented in Figs. 10a–10c for 1, 3, and 5.3 M NaCl respectively. Although the overall behavior is qualitatively the same as at the lower temperature, the distinction between short and intermediate/long cathode lengths are 0.07, 0.12, and 0.13 m for 1, 3, and 5.3 M respectively.
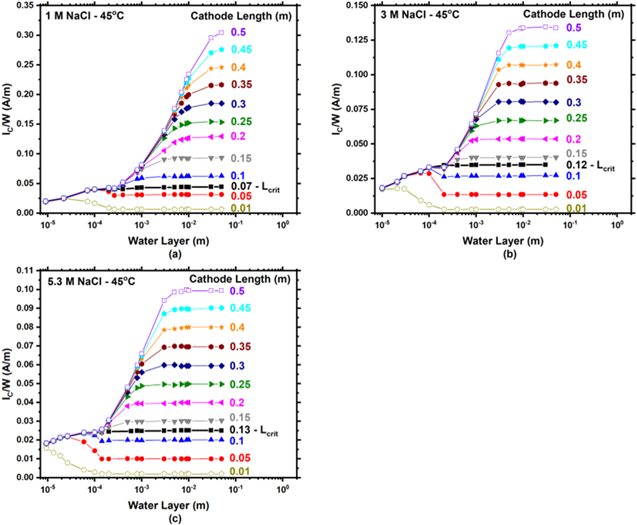
Figure 10. Modeled total cathodic current per width (IC/W) vs water layer thickness as a function of cathode length at 45 °C for (a) 1, (b) 3, and (c) 5.3 M NaCl. It is noted that the ordinate is different in all figures.
Download figure:
Standard image High-resolution imageCritical cathode sizes increase with chloride concentration and decrease with increasing temperature
LCrit is calculated for all scenarios in this study and is presented in Fig. 11. With increasing chloride concentration, LCrit increases, while with increasing temperature LCrit decreases.
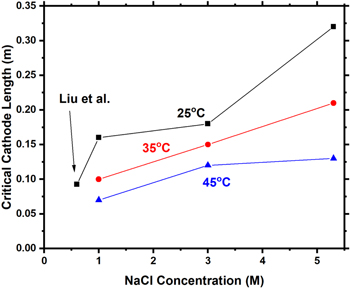
Figure 11. Critical cathode length (LCrit ) as a function of chloride concentration and temperature for NaCl brines from modeling results (Figs. 9 and 10).
Download figure:
Standard image High-resolution imageIncreased IC/W calculated for 4.98 M MgCl2 in comparison to 5.3 M NaCl at large cathode sizes
Figure 12a presents IC
/W for a SS304L cathode vs WL thickness as a function of LC
at 25 °C in 4.98 M MgCl2. In contrast to 5.3 M NaCl (c), 4.98 M MgCl2 does not have influences from M-T limitations. At all cathode lengths, IC
/W increases with WL, eventually plateauing due to the size of LC
. There is no depression in IC
/W with increasing WL thickness above  as was present in NaCl at 25 °C and 45 °C, thus, there is no LCrit
in 4.98 M MgCl2. A direct comparison of 4.98 M MgCl2 (9.96 M Cl−) and 5.3 M NaCl is presented in Figs. 12b and 12c. At small WLs, a greater IC
/W is calculated in NaCl in comparison to MgCl2 solutions. At large WLs, a greater IC
/W is presented in MgCl2 in comparison to NaCl solutions.
as was present in NaCl at 25 °C and 45 °C, thus, there is no LCrit
in 4.98 M MgCl2. A direct comparison of 4.98 M MgCl2 (9.96 M Cl−) and 5.3 M NaCl is presented in Figs. 12b and 12c. At small WLs, a greater IC
/W is calculated in NaCl in comparison to MgCl2 solutions. At large WLs, a greater IC
/W is presented in MgCl2 in comparison to NaCl solutions.
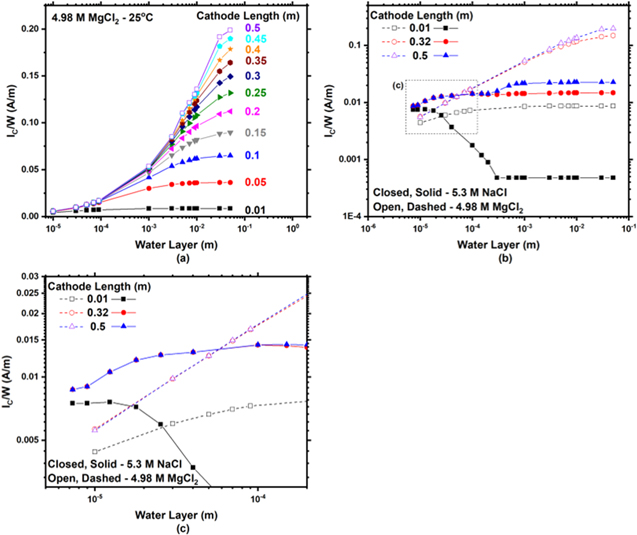
Figure 12. (a) Modeled total cathodic current per width (IC/W) vs water layer thickness as a function of cathode length at 25 °C for 4.98 M MgCl2. The cathodic polarization scan for SS304L in MgCl2 was obtained from Katona et al.. 45 (b) Comparison of IC/W vs water layer thickness as a function of cathode length at 25 °C for 4.98 M MgCl2 and 5.3 M NaCl. (c) Zoomed in region as denoted in (b). It is noted that (b) and (c) are log-log plots.
Download figure:
Standard image High-resolution imageIncreased IC/W on SS304L coupled with AA7050 is calculated at elevated temperatures
A comparison of IC /W at Lcrit at 25 °C and 45 °C is presented in Figs. 13a–13c for 1, 3, and 5.3 M NaCl. At all WLs and all NaCl concentrations 45 °C has a higher IC /W in comparison to 25 °C despite 45 °C having a smaller LCrit .

Figure 13. Comparison of the modeled total cathodic current per width (IC/W) vs water layer thickness as a function temperature at the respective critical cathode length (LCrit ) for (a) 1, (b) 3, and (c) 5.3 M NaCl. It is noted that the ordinate in (a) is different than (b) and (c).
Download figure:
Standard image High-resolution imageIncreased IC/W on SS304L coupled with AA7050 is calculated at elevated temperatures
A comparison of IC /W at LCrit in 1, 3, and 5.3 M NaCl is presented in Figs. 14a and 14b at 25 °C and 45 °C respectively. Additionally, IC /W at LC = 0.5 m in 1, 3, and 5.3 M NaCl is presented in Fig. 14c and 14d, at 25 °C and 45 °C respectively. At LCrit and 25 °C (Fig. 14a), 1 and 3 M NaCl have almost identical behavior, whereas 5.3 M NaCl has lower IC /W at WLs greater than 20 μm. At Lcrit and 45 °C (Fig. 14b), below a WL of 20 μm, all NaCl solutions behave similarly, however, above 20 μm, the IC /W decreases from 1, 3, to 5.3 M NaCl. At LC = 0.5 m and 25 °C (Fig. 14c), behavior of all solutions is similar below a WL of 100 μm. However, at the thickest WL explored (0.05 m), 4.98 M MgCl2 has the highest IC /W followed by 1, 3, and 5.3 M NaCl in that order. It is interesting to note that between a WL of 300 μm and 10,000 μm the data for 3 M NaCl have a higher IC /W than 1 M NaCl. Finally, at LC = 0.5 m and 45 °C (Fig. 14d), behavior of all solutions is similar below a WL of 10,000 μm above which the highest IC /W is 1 M NaCl followed by 3 and 5.3 M NaCl.
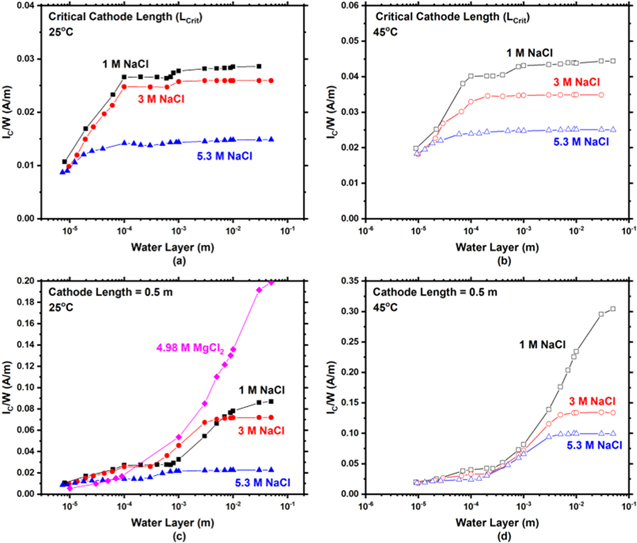
Figure 14. Comparison of the modeled total cathodic current per width (IC/W) vs water layer thickness as a function solution concentration at the respective critical cathode length (LCrit ) for (a) 25 and (b) 45 °C. Comparison of IC /W vswater layer thickness as a function solution concentration at a cathode length (LC) of 0.5 m for (c) 25 °C and (d) 45 °C. It is noted that the ordinate axis is different in each graph.
Download figure:
Standard image High-resolution imageDiscussion
Overall mass transport and diffusive mass transport describe changes in the natural convection layer thickness
The importance of WL thickness on the rate of corrosion under atmospheric conditions cannot be understated. One such defining characteristic of a thick WL is the presence of natural (or free) convection due to the spontaneous fluid flow created by density gradients. In the present case for NaCl solutions, this flow prevents the oxygen concentration gradient from extending to large distances away from the electrode. In the absence of natural convection, the diffusional boundary layer would continuously increase with time, lowering the diffusion-limited current density continuously.
9
Instead, a well-defined, diffusion-limited current for ORR is found for both Pt and SS304L under all NaCl solutions as presented in Figs. 3 and 4 respectively. Calculated  are presented in Fig. 6 using the experimental method presented by Liu et al..
9
In general, ilim for SS in NaCl is slightly below that for Pt (Fig. 5) and is attributed to effects of the oxide.
36,56
When the ilim of SS is used to calculate
are presented in Fig. 6 using the experimental method presented by Liu et al..
9
In general, ilim for SS in NaCl is slightly below that for Pt (Fig. 5) and is attributed to effects of the oxide.
36,56
When the ilim of SS is used to calculate  this causes an increase in
  (Fig. 6). Therefore, in order to determine
  electrodes that do not have an influence from an oxide, such as Pt, should be utilized.
Although natural convection in electrochemical systems has been discussed previously in the literature,
4,7–34
there has been a limited amount of experimental work aimed at determining the quantitative thickness of this layer when oxygen is the reactant on the surface of the alloy; the presented work serves to fill a missing gap. Notably, work has been conducted to describe free convection mass transport,
7,18,28–31
specifically when Cu2+ ions are reduced in solution
7,18,28,29
; however, the authors do not predict  Wragg et al.
7,18
and Fenech and Tobias
28
studied free convection under stagnant conditions, producing correlations between dimensionless parameters involving D, density differences between the bulk (
Wragg et al.
7,18
and Fenech and Tobias
28
studied free convection under stagnant conditions, producing correlations between dimensionless parameters involving D, density differences between the bulk ( ) and the surface (
 ),
),  and a characteristic dimension of the electrode (x). In general, the Sh (or Nusselt number for mass transfer) is described in terms of the Schmidt (
 ) and Grasshof (
 ) numbers. In all cases, a knowledge of the density difference is required to describe the natural convection in the system. In the case of ORR, density differences are unknown and become complex with the addition of ORR byproducts, such as hydroxyl ions.
A further review of natural convection in multiple electrochemistry environments is presented by Novev and Compton,
32
however, the quantification of  is seldom presented in literature, especially for atmospheric scenarios, and is highlighted as an important area of study. Of particular note, Amatore and coworkers have determined
  for oxidation reactions of multiple solutions
24–27
through the use of a polarized microelectrode. For reactions involving the oxidation
for oxidation reactions of multiple solutions
24–27
through the use of a polarized microelectrode. For reactions involving the oxidation  (10 mM in aqueous 1 M KCl) a
  of 230
24
and 250 μm
25
was measured. For
of 230
24
and 250 μm
25
was measured. For  (10 mM) and
  (2 mM) in aqueous 1 M KCl a
  of 150 μm was measured.
26
For fluorenone (10 mM) and 1-cyanonaphthalene (10 mM) in 0.1 M NBu4BF4/DMF a
of 150 μm was measured.
26
For fluorenone (10 mM) and 1-cyanonaphthalene (10 mM) in 0.1 M NBu4BF4/DMF a  of 135 μm was measured.
27
The inherent solution and concentration effects on
of 135 μm was measured.
27
The inherent solution and concentration effects on  as suggested by Liu et al.,
9
are apparent not only in one-electron transfer reactions,
24–27
but also in ORR reactions, as displayed in Fig. 6.
as suggested by Liu et al.,
9
are apparent not only in one-electron transfer reactions,
24–27
but also in ORR reactions, as displayed in Fig. 6.
While mass transfer, or Sh, could not be described in terms of dimensionless solution variables due to a lack of data in the present case, Sh can be calculated per Eq. 5 and used to describe  as shown in Fig. 7. With increasing Sh,
  decreases in all cases studied, however, there are differences in governing factors with increased solution concentration or temperature. Sh describes mass transport and can be described as the ratio of overall mass transfer coefficient (K) to diffusive mass transport (D/d)
57
as seen in Eq. 5. In order to determine the governing factors of the solution related to mass transport, normalized solution parameters are presented in Fig. 15. All variables are normalized with respect to 1 M NaCl at 25 °C. With increasing chloride concentration at 25 °C (Fig. 15a), Sh and K increase, however,
decreases in all cases studied, however, there are differences in governing factors with increased solution concentration or temperature. Sh describes mass transport and can be described as the ratio of overall mass transfer coefficient (K) to diffusive mass transport (D/d)
57
as seen in Eq. 5. In order to determine the governing factors of the solution related to mass transport, normalized solution parameters are presented in Fig. 15. All variables are normalized with respect to 1 M NaCl at 25 °C. With increasing chloride concentration at 25 °C (Fig. 15a), Sh and K increase, however,  and
and  decrease. Although K increases roughly by a factor of 1.3,
  decreases by a factor of 1.7 at 5.3 M NaCl, causing an overall increase in Sh. Thus, with increasing chloride concentration, a greater decrease in diffusive mass transport (
 ) in comparison to overall mass transport coefficient (K) causes an increase in Sh and a decrease in
  In other words, an increase in chloride concentration decreases
  due to an increase in mass transport (Sh) with the dominating influence being a decrease in diffusive mass transport (
 ).
).
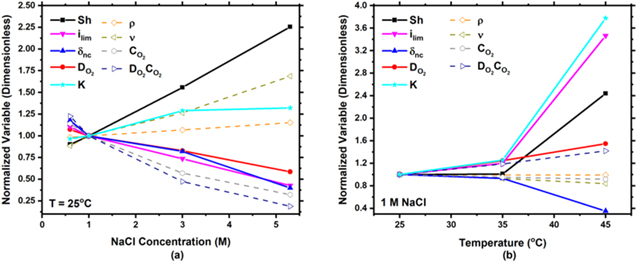
Figure 15. Normalized, measured solution properties for (a) various NaCl concentrations at 25 °C and (b) various temperatures at 1 M NaCl. All values were normalized to 1 M NaCl at 25 °C. It is noted that the ordinate is different between (a) and (b).
Download figure:
Standard image High-resolution imageConsidering the case of 1 M NaCl with increasing temperature, now the governing factor in determining  becomes a significant increase in overall mass transport coefficient (K). With increasing temperature at 1 M NaCl (Fig. 15b), one can see that Sh, K, and
  increase, however,
  decreases. K increases by roughly a factor of 3.8 and
  increases by a factor of 1.5 at 45 °C in comparison to 25 °C causing for an overall increase in Sh. Thus, with increasing temperature, a greater increase overall mass transport coefficient (K) in comparison in diffusive mass transport (
 ) causes for an increase in Sh and a decrease in
  In other words, an increase in temperature decreases
  due to an increase in mass transport (Sh) with the dominating influence being a significant increase in overall mass transport coefficient (K).
It is important to note that the trend presented agrees with other studies of natural convection boundary layers in literature. Based on the work of Amatore et al.,
24
Sh can be calculated for the oxidation of  to
to  Values obtained from their study are as follows:

 and
and  Based on Eq. 5, Sh was calculated, and both Sh and corresponding
  (250 μm) are plotted in Fig. 7. While this value lies slightly above the predicted value based on the results presented within, very good agreement is observed. Measurements of
  by Amatore et al. were performed in solutions that did not have temperature control and could have influences on convection and
  32,58
Additionally, Sh can also describe
32,58
Additionally, Sh can also describe  when ORR has a two electron transfer (such as in MgCl2)
45
or less than two electron transfer (such as in NaOH).
55
Thus, with the knowledge of Sh for mass transport in an electrochemical system, the unique fit presented in Fig. 7 can be used to predict
when ORR has a two electron transfer (such as in MgCl2)
45
or less than two electron transfer (such as in NaOH).
55
Thus, with the knowledge of Sh for mass transport in an electrochemical system, the unique fit presented in Fig. 7 can be used to predict 
Regimes of cathodic current are clearly distinguishable and change with chloride concentration and temperature
With changes in LC , distinct regimes delineate the dependence of cathode current on film thickness for NaCl electrolytes. In general, the potential of the cathode rose from the AA/SS coupling potential at the interface to the OCP of the cathode (SS) as shown in Fig. 8. The overall extent and distribution of the potential rise is determined by the ohmic drop and current density in solution. As such, the ohmic drop is determined by the WL thickness and temperature, the current/potential relationship, solution conductivity, and the cathode length. A similar treatment to cathodic regimes as was taken by Liu et al. 9 and will be presented below.
NaCl electrolytes
LC
< LCrit
—For sufficiently thin WLs (< 100 μm), the ohmic drop is dominant, and, generally, less than 20 % of the cathode length was within the M-T limited kinetics (Fig. 16a). Most of the potentials experienced along the length of the cathode are within activation-controlled kinetics. There are two governing factors for this: (i) an increased ohmic drop due to a thin WL and (ii) the potential at which the transition from ilim to activation controlled current densities starts is lower. For example, under a WL of 8 μm in 1 M NaCl at 25 °C, the diffusion limited region starts at a potential of −0.74 VSCE whereas under immersed conditions ( = 714 μm) the diffusion-limited region starts at −0.5 VSCE. With thinner WL (e.g., 8 μm), an increased ohmic drop is present due to the physical geometry and will transition the cathode from M-T kinetics to activation-controlled kinetics at more negative potentials. The current density as a function of distance from the AA/SS interface is shown in Fig. 17a for LC
= 0.01 m in 1 M NaCl at 25 °C and the ohmic drop is signified by the current density decreasing with increased distance from the AA/SS interface. Thus, for small cathode sizes and small WL, the ohmic drop is the controlling mechanism for the galvanic couple. In semi-logarithmic plots such as Figs. 9 and 10, the IC/W region is relatively linear.
= 714 μm) the diffusion-limited region starts at −0.5 VSCE. With thinner WL (e.g., 8 μm), an increased ohmic drop is present due to the physical geometry and will transition the cathode from M-T kinetics to activation-controlled kinetics at more negative potentials. The current density as a function of distance from the AA/SS interface is shown in Fig. 17a for LC
= 0.01 m in 1 M NaCl at 25 °C and the ohmic drop is signified by the current density decreasing with increased distance from the AA/SS interface. Thus, for small cathode sizes and small WL, the ohmic drop is the controlling mechanism for the galvanic couple. In semi-logarithmic plots such as Figs. 9 and 10, the IC/W region is relatively linear.
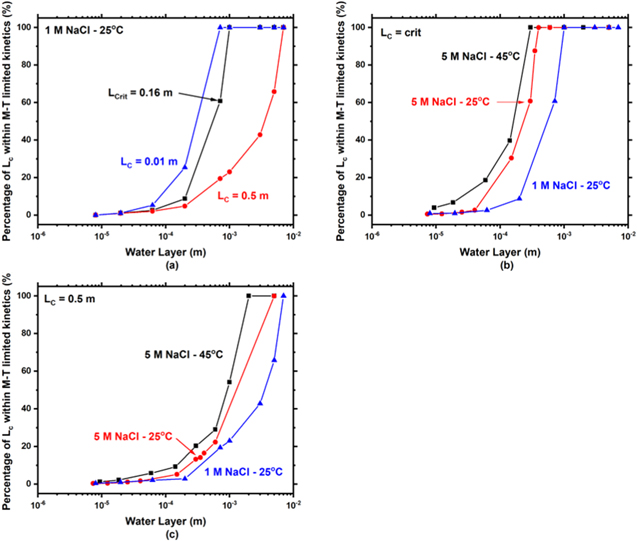
Figure 16. Modeled percentage of the cathode length within mass-transport limited kinetics for (a) 1 M NaCl at 25 oC various cathode lengths. (b) Comparison of percentage of the cathode length within mass-transport limited kinetics for 5.3 M NaCl at 25 and 45 oC and 1 M NaCl at 25 oC at (b) the respective critical cathode length and (c) a cathode length of 0.5 m.
Download figure:
Standard image High-resolution image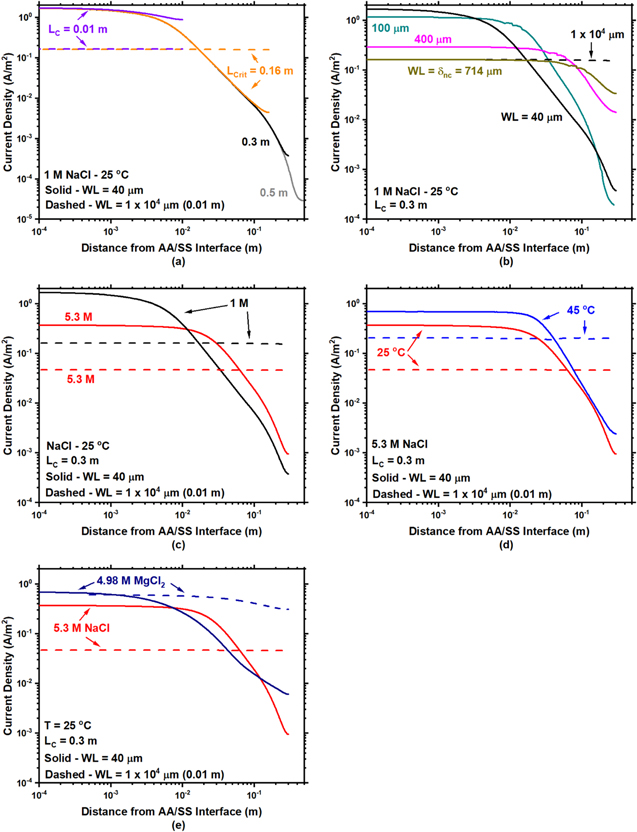
Figure 17. (a) Modeled current density vs distance from the AA/SS interface as a function of cathode length and (b) WL at a fixed cathode length. (c) Current density vs distance from the AA/SS interface as a function of solution concentration and water layer thickness and (d) as a function temperature and cathode length. (e) Comparison of MgCl2 and NaCl current densities from the AA/SS interface at 25 °C as a function of water layer thickness.
Download figure:
Standard image High-resolution imageFor thicker WLs (100 μm to  ), there is a combined effect from ohmic and a M-T kinetics. Generally, ohmic resistances dominated when less than 50 % of the cathode was in the region of M-T limited kinetics. When > 50 % of the cathode was within M-T kinetics, the dominant factor controlling the relationship between IC
/W and WL became mass transport with minimal influence from ohmic drop. As a result, for LC
< LCrit
, the total cathodic current showed a sharp rise with decreasing WL due to the inverse relationship between ilim and the WL thickness and the change in controlling mechanisms. This sharp rise is most evident in 5.3 M NaCl at 25 °C for LC
= 0.01 and 0.05 m (Fig. 8c). The transition between ohmic control and M-T control is illustrated in Fig. 12 of Liu et al..
9
), there is a combined effect from ohmic and a M-T kinetics. Generally, ohmic resistances dominated when less than 50 % of the cathode was in the region of M-T limited kinetics. When > 50 % of the cathode was within M-T kinetics, the dominant factor controlling the relationship between IC
/W and WL became mass transport with minimal influence from ohmic drop. As a result, for LC
< LCrit
, the total cathodic current showed a sharp rise with decreasing WL due to the inverse relationship between ilim and the WL thickness and the change in controlling mechanisms. This sharp rise is most evident in 5.3 M NaCl at 25 °C for LC
= 0.01 and 0.05 m (Fig. 8c). The transition between ohmic control and M-T control is illustrated in Fig. 12 of Liu et al..
9
For the large WL thicknesses (>  ), the galvanic couple is essentially under full immersion conditions, and ohmic drop across the entire cathode was negligible. The major contribution in this region was the M-T kinetic limitations. The two electrodes were not polarized appreciably from the coupling potential predicted by Mixed Potential Theory. This is shown in Fig. 17a for WL = 14,000 μm as the cathodic current density moving away from the anode/cathode interface is flat. Generally greater than 50 % of the cathode is in M-T limited kinetics (Fig. 16). Thus, the cathodic current density at all points is equal to the coupling current density (for the AA/SS couple, this current density is the mass transport-limited cathodic current density when WL =
  ) and IC
/W is simply ilim
·LC
. As shown in Figs. 9 and 10, the IC
/W scales linearly with LC
and is generally below IC
/W for a WL of 100 μm. Again, in this regime, the system behaves as if it is fully immersed in the electrolyte.
) and IC
/W is simply ilim
·LC
. As shown in Figs. 9 and 10, the IC
/W scales linearly with LC
and is generally below IC
/W for a WL of 100 μm. Again, in this regime, the system behaves as if it is fully immersed in the electrolyte.
LC = LCrit —For sufficiently thin WLs (< 100 μm), the behavior is identical to the scenario when LC < LCrit and ohmic drop is still dominating. A comparison of this behavior is shown for WL = 44 μm in 1 M NaCl at 25 °C in Fig. 17(a). With increased cathode size, the percentage of cathode within M-T limited kinetics decreases (Fig. 16a), highlighting the importance of ohmic drop in thin WLs with increasing cathode size.
For thicker WLs (100 μm— ), there again is competition between ohmic drop and M-T limitations. The IC
/W in this regime was constant despite differences in polarization curve behavior with changes in WL. With increased WL thickness, under the same concentration and temperature, ilim decreases, however, ohmic drop effects will diminish. This unique behavior is illustrated in Fig. 17b for 1 M NaCl at 25 °C. Although Fig. 17b is for a larger cathode than LCrit
, the same trends are present. Directly comparing WL thicknesses between 100 μm and
), there again is competition between ohmic drop and M-T limitations. The IC
/W in this regime was constant despite differences in polarization curve behavior with changes in WL. With increased WL thickness, under the same concentration and temperature, ilim decreases, however, ohmic drop effects will diminish. This unique behavior is illustrated in Fig. 17b for 1 M NaCl at 25 °C. Although Fig. 17b is for a larger cathode than LCrit
, the same trends are present. Directly comparing WL thicknesses between 100 μm and  (in this case 714 μm), 100 μm has a greater current density than
  However, the IC
/W also displays the greatest effect from ohmic drop as signified by a sharp decrease in the current density when increasing the distance from the AA/SS interface. Increasing the WL from 100 μm to 714 μm, the current density is decreased, but the effects from ohmic drop are also decreased as signified by the current density distribution becoming flatter in Fig. 17b. Thus, when integrating the current along the cathode, IC
/W is roughly the same (Fig. 9a) between 100 μm and
However, the IC
/W also displays the greatest effect from ohmic drop as signified by a sharp decrease in the current density when increasing the distance from the AA/SS interface. Increasing the WL from 100 μm to 714 μm, the current density is decreased, but the effects from ohmic drop are also decreased as signified by the current density distribution becoming flatter in Fig. 17b. Thus, when integrating the current along the cathode, IC
/W is roughly the same (Fig. 9a) between 100 μm and  due to these off-setting phenomena. Another way to approach this effect is to consider the percentage of the cathode that is in the M-T regime. At 100 μm roughly 7 % of the cathode is in M-T limited kinetics, whereas at
  (714 μm) roughly 60% of the cathode is in M-T limited kinetics. Thus, under relatively thin WL, the effect of the larger ohmic resistance dominated and nulled the effects of enhanced M-T limited kinetics. As a result, IC
/W is constant over this WL and LC
range.
(714 μm) roughly 60% of the cathode is in M-T limited kinetics. Thus, under relatively thin WL, the effect of the larger ohmic resistance dominated and nulled the effects of enhanced M-T limited kinetics. As a result, IC
/W is constant over this WL and LC
range.
For large WL thicknesses (>  ), the IC/W displays identical behavior to small cathodes with the caveat that IC
/W is slightly greater than that at
), the IC/W displays identical behavior to small cathodes with the caveat that IC
/W is slightly greater than that at  Again, IC
/W scales directly with cathode size as the couple is essentially under full immersion conditions.
Again, IC
/W scales directly with cathode size as the couple is essentially under full immersion conditions.
LC
> LCrit
—For sufficiently thin WLs (< 100 μm), the behavior is identical to the two previous scenarios. A comparison of the cathodic current densities for all cathode lengths is shown for WL = 44 μm in 1 M NaCl at 25 °C in Fig. 17a. With increased cathode size, the cathodic current density decreases and the percentage of cathode within M-T limited kinetics decreases (Fig. 16a). For thicker WLs (100 μm— ), there again is competing factors between ohmic drop and M-T limitations. These trends are identical for when LC
= LCrit
. Finally, for large WL thicknesses (>
), there again is competing factors between ohmic drop and M-T limitations. These trends are identical for when LC
= LCrit
. Finally, for large WL thicknesses (>  ), the trends are the same as the previous groupings with IC
/W increased in comparison to IC
/W at
), the trends are the same as the previous groupings with IC
/W increased in comparison to IC
/W at 
Overall, there is little experimental validation of the presented phenomena as the majority of studies performed are across orders of magnitude of WL and do not vary electrode sizes. Of recent note, Tran et al. looked at the coupling current density as a function of WL thickness in an aluminum 6061-T6 with a high strength steel (HSS) in 2 M NaCl solutions in thin WL. 59 The experimental arrangement contained two (one AA and one HSS) 0.01 × 0.01 m (1 × 1 cm) electrodes mounted 0.005 m apart in an epoxy resin. Various WL thicknesses were placed on top of the couple and with decreasing WL thickness, an increase in the coupling current density was measured for the AA/HSS couple. 59 This scenario is most similar to the cathode size of 0.01 m presented in Figs. 9a and 9b for 1 and 3 M NaCl. Calculated IC /W is 8.7 and 7.7 times higher at a WL of 25 μm in comparison to bulk solutions for 1 and 3 M NaCl respectively. This arrangement equates to an average increase in IC/W of a factor of 8.2 for 25 μm in comparison to bulk solutions and would be comparable to 2 M NaCl. Tran et al. reported a corrosion rate increase of a factor of 8 for a WL of 25 μm in comparison to bulk solutions in 2 M NaCl 59 which fits quite well with the modeled currents in Figs. 9a and 9b and shows the efficacy of this study and modeling techniques.
Under all LC
—Thin WLs (< 100 um) exhibit the same IC
/W across all LC
greater than 0.05 m despite the larger cathodes having more length to provide current to the anode. When comparing all cathode lengths and thin WLs (Fig. 17(a)), the current densities are constant at and near the stainless steel/aluminum alloy interface. The constant IC
/W near to the interface is due to the fact that the first few mm of the cathode contribute over 90 % of the total current to IC
/W.
9
Thus, it is not surprising that IC
/W under thin WL thicknesses is independent of the cathode length. When cathode lengths are under 0.05 m, the IC
/W is limited by the size of the cathode. On the contrary, the IC
/W at thick water layers (>  ) are dependent on the cathode size, because there is limited to no ohmic drop (a constant current density as a function of distance from the interface is shown in Fig. 17a for the entire cathode length), and the current density is essentially the coupling current density multiplied by the cathode size.
Increasing solution concentration decreases IC
/W due to a significant decrease in  but increases the percentage of the cathode in M-T kinetics due to an increased
  for NaCl solutions. First, when increasing solution concentration, ilim decreases due to a decreased
  and
and  and an increase
  (Eq. 3).
  has the most severe decrease (Fig. 15) and is directly proportional to ilim (Eq. 3), thus, will be the most influential parameter when changing solution concentration. Next, a decrease in solution concentration also decreases the current density in the activation-controlled regime. These differences can be seen in Figs. 3 and 4 by comparing the individual rows. Finally, with increased solution concentration in NaCl electrolytes, an increase in solution conductivity is present.
53
When directly comparing IC
/W (Fig. 14), a decrease in IC
/W is calculated at all LC
values used with an increased solution concentration due to a decrease in ilim. Additionally, an increase in solution concentration increases the percentage of LC
that is in the M-T limited kinetics region because an increase in solution conductivity decreases the ohmic drop and broadens the M-T regime. These two competing phenomena are shown in Fig. 17c for a large cathode and two WLs (40 and 10,000 μm) in 1 and 5.3 M NaCl at 25 °C. Under a WL = 40 μm, an increased current density is calculated in the 1 M NaCl in comparison to 5.3 M NaCl, however, a more rapid decrease in the current density is calculated when moving away from the interface in 1 M NaCl in comparison to 5.3 M NaCl. This effect causes a lower percentage of the cathode to be in M-T kinetics for lower concentrations (Figs. 16b and 16c).
has the most severe decrease (Fig. 15) and is directly proportional to ilim (Eq. 3), thus, will be the most influential parameter when changing solution concentration. Next, a decrease in solution concentration also decreases the current density in the activation-controlled regime. These differences can be seen in Figs. 3 and 4 by comparing the individual rows. Finally, with increased solution concentration in NaCl electrolytes, an increase in solution conductivity is present.
53
When directly comparing IC
/W (Fig. 14), a decrease in IC
/W is calculated at all LC
values used with an increased solution concentration due to a decrease in ilim. Additionally, an increase in solution concentration increases the percentage of LC
that is in the M-T limited kinetics region because an increase in solution conductivity decreases the ohmic drop and broadens the M-T regime. These two competing phenomena are shown in Fig. 17c for a large cathode and two WLs (40 and 10,000 μm) in 1 and 5.3 M NaCl at 25 °C. Under a WL = 40 μm, an increased current density is calculated in the 1 M NaCl in comparison to 5.3 M NaCl, however, a more rapid decrease in the current density is calculated when moving away from the interface in 1 M NaCl in comparison to 5.3 M NaCl. This effect causes a lower percentage of the cathode to be in M-T kinetics for lower concentrations (Figs. 16b and 16c).
Increasing the solution temperature increases both IC
/W and percentage of LC
that is within the M-T limited kinetics region. An increase in temperature increases ilim based on Eq. 3 due to an exponential increase in  (Figs. 2d and 15). Additionally, the activation-controlled kinetics are enhanced at elevated temperatures. These two electrochemical trends can be seen when comparing columns in Figs. 3 and 4. Finally, an increase in temperature will increase
  53
Combining these phenomena will increase IC
/W with increased temperature ( Fig. 9) as the cathode will experience less ohmic drop (due to increased conductivity), keeping a greater portion of the cathode in the M-T limiting kinetics region (Figs. 16b and 16c). This can also be seen in Fig. 17d where, with increased temperature, the calculated cathodic current density is higher and there is less of an ohmic drop effect as signified by a flatter curve.
53
Combining these phenomena will increase IC
/W with increased temperature ( Fig. 9) as the cathode will experience less ohmic drop (due to increased conductivity), keeping a greater portion of the cathode in the M-T limiting kinetics region (Figs. 16b and 16c). This can also be seen in Fig. 17d where, with increased temperature, the calculated cathodic current density is higher and there is less of an ohmic drop effect as signified by a flatter curve.
MgCl2 electrolytes
In saturated MgCl2, distinct regions based on cathode size do not occur (Fig. 12) due to a lack of ilim and lack of WL dependence on the cathodic kinetics. 45 This indicates that ohmic control is dominating at all LC and WL in 4.98 M MgCl2. As such, there is no decrease in IC /W with increasing WL thickness as there is in NaCl (Fig. 12b). Under very thin WLs (< 30–50 μm based on LC ), NaCl has a higher calculated IC /W (Fig. 12c). In thin NaCl solutions, an elevated ilim is measured (Eq. 1), however, in MgCl2 solutions there is no WL dependence and the solution is under activation-controlled HER. 45 Additionally, saturated MgCl2 has a lower conductivity 54 in comparison to saturated NaCl. 53 A lower conductivity in MgCl2 solutions will cause a greater ohmic drop effect in thin WL in comparison to saturated NaCl solutions, and because the polarization scan is under activation-controlled kinetics, a greater decrease in the current density is calculated. These competing phenomena are presented in Fig. 17e. Now, in thicker WL, saturated NaCl experiences a much smaller ilim in comparison to the activation-controlled MgCl2 kinetics, and, despite ohmic drop still being present at thicker WL in MgCl2 as shown in Fig. 17(e), a higher IC /W is calculated.
A similar relationship between NaCl and MgCl2 electrolytes is observed when predicting localized pitting corrosion on a SS using the formulism presented by Chen and Kelly. 60 The model relies on the fact that under freely corroding conditions, pitting can be considered a galvanic couple with the pit (the anode) growing only as long as the anodic current required to maintain the critical solution chemistry is predominantly supported by current from the surrounding material (the cathode). Under the same salt loading density (3 g m−2), both saturated NaCl and MgCl2 have a WL less than 10 μm, and the predicted pit size and predicted cathodic current are larger for saturated NaCl solutions. 54 This is exactly what is predicted in an AA/SS galvanic couple under thin WL conditions, as the IC /W is larger for saturated NaCl solutions (Fig. 12c).
Implications and Limitations
As with all models, the modeling approach used here has several limitations. First, an assumption is made that a uniform thin layer of electrolyte exists across the entire galvanic couple, which is not always the case in practice due to imperfect wetting, especially at the edge of the cathode/anode. This imperfect wetting would lead to a shorter effective length of cathode available. Next, the assumption of a static and uniform electrolyte layer with constant chemical concentration and conductivity neglects the fact of changes in chemical (solution chemistry, corrosion products), electrochemical (corrosion kinetics) and physical (evaporation, temperature) conditions that can and do occur with time. Third, the current work focused on the contribution from the cathode, using an anode that is largely non-polarizable. Fourth, the assumption of steady-state is made in the study, neglecting the time-evolution of cathodic current available and the evolution of the brine on the surface which can have precipitates or changing boundary conditions. If boundary conditions were dependent upon the pH in solution, it is believed that a decrease in modeled current would occur due to a decrease in the reversable potential for ORR, a decrease in ilim, and a decrease in the number of electrons transferred. Thus, it is believed the presented model is conservative because all of these effects would decrease the predicted current. Fifth, only ohmic drop is considered, which is an intrinsic limitation of the use of Laplace Equation-based modeling, with diffusion effects being captured through the effects on cathodic kinetics. Sixth, the anodic polarization scan of AA was assumed to be constant with changes in temperature and chloride concentration. Finally, quiescent polarization scans were measured with the electrode perpendicular to gravity.
Despite these limitations, the implications of this work, both in terms of natural convection boundary layer thickness determination and galvanic coupling modeling, should be noted. First, the method for determining  first proposed by Liu et al.,
9
was extended to elevated solution compositions and temperatures. The
first proposed by Liu et al.,
9
was extended to elevated solution compositions and temperatures. The  was determined with the electrode perpendicular to gravity, thus the value determined may not transfer to other configurations. However, one polarization scan was taken with the electrode parallel to gravity (typical flat cell configuration), the ilim was utilized to calculate a new
  and only produced a
  that was roughly 40 μm smaller in comparison (∼5 % smaller) to the configuration use in Fig. 6 at 1 M NaCl at 25 °C. This would indicate a minor directional dependence on
  however, further research is necessary. This work further produced a way to predict
  in using Sh and was cross-validated with other electrochemical systems, including ORR reactions with two electron transfers (MgCl2 electrolytes) and one electron transfer (NaOH electrolytes), and a one electron transfer of
  to
to  24
It is noted that in Eq. 5, a dependence on the electrode diameter is present. In this study a constant electrode diameter of 0.5 cm was utilized. Fenech and Tobias
28
and Wragg
18
noted that utilizing larger electrode diameters (> 0.5 cm) produced a constant ilim which would indicate a constant
24
It is noted that in Eq. 5, a dependence on the electrode diameter is present. In this study a constant electrode diameter of 0.5 cm was utilized. Fenech and Tobias
28
and Wragg
18
noted that utilizing larger electrode diameters (> 0.5 cm) produced a constant ilim which would indicate a constant  Thus, extrapolating
  values determined in this study to larger electrodes would be valid. Caution should be taken when extrapolating to smaller electrodes sizes due to an increase in ilim with decreasing electrode size. Additionally, when utilizing the fit present in Fig. 7 to predict
  the same electrode size should be utilized as further validation is needed to apply the fit to larger electrode diameters.
The importance of knowing  cannot be understated and was shown by exploring an AA/SS galvanic coupling. When considering sample exposures in real-life, atmospheric environments, the value of
  and LC
determine if a decrease in total current is experienced with increased WL. For example, in saturated NaCl solutions, at 25 °C, and WLs above
and LC
determine if a decrease in total current is experienced with increased WL. For example, in saturated NaCl solutions, at 25 °C, and WLs above  (~300 μm), any cathode length shorter than 0.32 m (32 cm) experiences IC
/W decreases in comparison to 100 μm WL due to M-T limitations. These limitations should be considered when selecting sample sizes for accelerated chamber testing and atmospheric exposure scenarios. Having a sample that is too small will decrease IC
/W and potentially the corrosion damage observed. In accelerated testing environments akin the ASTM B117, WL thicknesses are highly dependent upon angle of the sample and range from 660–1210 μm at exposure angles of 15° to 30° respectively.
47
In most scenarios, the exposed sample is going to be under full immersion conditions (> δnc
) especially at high angles of exposure and the total IC
/W will be dependent upon cathode size. Samples that are too small, will be non-conservative as a decrease in IC
/W will be experienced at thick WLs. Therefore, if small samples are utilized in accelerated testing (LC
< LCrit
), the corrosion damage may be reduced due to M-T limitations in full immersion conditions and will not provide for an accurate representative of thin film, in-service atmospheric environments. Overall, corrosion damage due to the variation in IC
/W in a galvanic couple can vary between accelerated corrosion tests and in-service damage and relies heavily on the sample size.
(~300 μm), any cathode length shorter than 0.32 m (32 cm) experiences IC
/W decreases in comparison to 100 μm WL due to M-T limitations. These limitations should be considered when selecting sample sizes for accelerated chamber testing and atmospheric exposure scenarios. Having a sample that is too small will decrease IC
/W and potentially the corrosion damage observed. In accelerated testing environments akin the ASTM B117, WL thicknesses are highly dependent upon angle of the sample and range from 660–1210 μm at exposure angles of 15° to 30° respectively.
47
In most scenarios, the exposed sample is going to be under full immersion conditions (> δnc
) especially at high angles of exposure and the total IC
/W will be dependent upon cathode size. Samples that are too small, will be non-conservative as a decrease in IC
/W will be experienced at thick WLs. Therefore, if small samples are utilized in accelerated testing (LC
< LCrit
), the corrosion damage may be reduced due to M-T limitations in full immersion conditions and will not provide for an accurate representative of thin film, in-service atmospheric environments. Overall, corrosion damage due to the variation in IC
/W in a galvanic couple can vary between accelerated corrosion tests and in-service damage and relies heavily on the sample size.
In atmospheric conditions, WL formation through salt deliquescence is possible and the cathodic current in a galvanic couple can be predicted as a function of environment. The WL is dictated by the loading density (LD, grams of salt per unit surface area, g m−2), the specific gravity of the solution ( ), the molecular weight (MW), and the equilibrium concentration of the salt (Ceq
) (WL = (LD.
), the molecular weight (MW), and the equilibrium concentration of the salt (Ceq
) (WL = (LD.
 )/(MW.Ceq
)).
61
Ceq
is controlled by the relative humidity (RH), because RH is equal to the activity of water based on the brine composition under equilibrium conditions. As the RH decreases, the concentration of chloride species in solution increases.
1
This is due to the fact that the lower RH represents lower activities of water in the gas phase, and at equilibrium, the activity of water in the liquid phase must match it. To achieve this equilibrium, some of the water evaporates. Therefore, IC
/W can be calculated as a function of RH and LD and is presented in Fig. 18. With increased RH, LD, and LC
, IC
/W increases. First, increasing RH decreases NaCl concentration. As presented in Fig. 14, a decrease in NaCl concentration increases IC
/W. Thus, increasing RH increases IC
/W. Next, increasing LD increases WL thickness. Considering 5.3 M NaCl, at a LD = 0.5 g m−2, the WL is 1.93 um and at a LD = 3 g m−2 the WL is 11.59 um. This six-fold increase in WL will increase the IC
/W. Although this may be the case for the presented LD, if a LD were achieved where full immersion conditions are present, a decrease in IC
/W would occur for a LC
= 0.01 m. As shown in Fig. 9, for LC
= 0.01 m and as previously discussed in Section 4.2, a decrease in IC
/W would be observed. This, however, is very unlikely, as an astronomical loading density of 77 g m−2 is required to reach full immersion conditions (
)/(MW.Ceq
)).
61
Ceq
is controlled by the relative humidity (RH), because RH is equal to the activity of water based on the brine composition under equilibrium conditions. As the RH decreases, the concentration of chloride species in solution increases.
1
This is due to the fact that the lower RH represents lower activities of water in the gas phase, and at equilibrium, the activity of water in the liquid phase must match it. To achieve this equilibrium, some of the water evaporates. Therefore, IC
/W can be calculated as a function of RH and LD and is presented in Fig. 18. With increased RH, LD, and LC
, IC
/W increases. First, increasing RH decreases NaCl concentration. As presented in Fig. 14, a decrease in NaCl concentration increases IC
/W. Thus, increasing RH increases IC
/W. Next, increasing LD increases WL thickness. Considering 5.3 M NaCl, at a LD = 0.5 g m−2, the WL is 1.93 um and at a LD = 3 g m−2 the WL is 11.59 um. This six-fold increase in WL will increase the IC
/W. Although this may be the case for the presented LD, if a LD were achieved where full immersion conditions are present, a decrease in IC
/W would occur for a LC
= 0.01 m. As shown in Fig. 9, for LC
= 0.01 m and as previously discussed in Section 4.2, a decrease in IC
/W would be observed. This, however, is very unlikely, as an astronomical loading density of 77 g m−2 is required to reach full immersion conditions ( ). Finally, an increase in LC
increases IC
/W at all RH. While small WL typically have an IC
/W that is independent of LC
, an LC
= 0.01 m is limited by physical size and will cause for a decrease in IC
/W. Any LC
≥ 0.05 m will behave nearly identical to 0.5 m under the LD presented. Overall, an increase in RH (decrease in NaCl concentration) increases in IC
/W and highlights the important, controlling behavior of cathodic kinetics in atmospheric corrosion.
). Finally, an increase in LC
increases IC
/W at all RH. While small WL typically have an IC
/W that is independent of LC
, an LC
= 0.01 m is limited by physical size and will cause for a decrease in IC
/W. Any LC
≥ 0.05 m will behave nearly identical to 0.5 m under the LD presented. Overall, an increase in RH (decrease in NaCl concentration) increases in IC
/W and highlights the important, controlling behavior of cathodic kinetics in atmospheric corrosion.
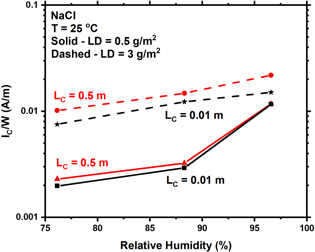
Figure 18. Comparison of the modeled total cathodic current per width (IC/W) vs relative humidity (RH) as a function loading density (LD) and cathode length (LC ). It is noted that the lines present are not intended as fits rather to guide the eye of the reader.
Download figure:
Standard image High-resolution image
Conclusions
This study presents cathodic kinetics of platinum and stainless steel 304L in elevated sodium chloride concentrations (1, 3, and 5.3 M NaCl) and elevated temperatures (25, 35, and 45 °C) as a function of boundary layer thickness. The natural convection layer was determined for all scenarios presented, and, with increasing temperature and chloride concentration, the natural convection decreases. For the first time, the dependence of the natural convection boundary layer was described by the Sherwood number enabling the prediction of the natural convection boundary layer with a polarization scan and readily available solution parameters. Additionally, the total cathodic current capacity of an aluminum/stainless steel galvanic couple was evaluated as a function of electrolyte film thickness, electrolyte composition, and cathode size. The water layer ranged from full immersion conditions where mass-transport kinetics dominated to the thin film regime where ohmic drop dominated. The natural convection boundary layer defined the upper limit for thin film atmospheric corrosion; for water layers above this limit, the total cathodic current scaled with cathode size. A decrease in total cathodic current of the galvanic couple was calculated with increasing chloride concentration due to a decrease in oxygen solubility, decreasing mass transport kinetics. An increase in total cathodic current was calculated with an increase in temperature due to an increase in diffusivity, increasing mass transport kinetics. The results of this study have important implications for sample sizing and corrosion prediction as a function of environment.
Acknowledgments
Sandia National Laboratories is a multi-mission laboratory managed and operated by National Technology and Engineering Solutions of Sandia, LLC., a wholly owned subsidiary of Honeywell International, Inc., for the U.S. Department of Energy's National Nuclear Security Administration under contract DE-NA0003525. Financial assistance from the U.S. Department of Energy's Nuclear Energy University Program under contract DE-NE0008901 is also acknowledged. Helpful discussions with Dr. Charles Bryan (Sandia National Laboratories) and Dr. Chao Liu (Shell) are gratefully acknowledged. This document is SAND2021-2792 J.