
Abstract
LiFePO4 (LFP) is an appealing cathode material for Li-ion batteries. Its superior safety and lack of expensive transition metals make LFP attractive even with the commercialization of higher specific capacity materials. In this work the performance of LFP/graphite cells is tested at various temperatures and cycling protocols. The amount of water contamination is controlled to study the impact of water on capacity fade in LFP. Further, several additive systems that have been effective in NMC/graphite chemistries are tested in LFP/graphite cells. The presence of excess water impacts cell performance severely when no electrolyte additives are used, or when the electrodes are poorly passivated. When effective additive systems are used, the existence of up to 500 ppm excess water in the cell is does not strongly affect cycle life and storage performance. Fe dissolution is studied in LFP with micro X-ray fluorescence spectroscopy (μXRF), and most electrolyte additives virtually eliminate Fe dissolution, even at high temperature and with water contamination. Removing excess water contamination suppresses Fe dissolution in cells without electrolyte additives. Finally, the capacity retention of LFP/graphite cells at high temperature is compared with long lifetime NMC/graphite cells, demonstrating challenges for LFP/graphite cells.
Export citation and abstract BibTeX RIS

This is an open access article distributed under the terms of the Creative Commons Attribution 4.0 License (CC BY, http://creativecommons.org/licenses/by/4.0/), which permits unrestricted reuse of the work in any medium, provided the original work is properly cited.
Olivine LiFePO4 (LFP) has long been pursued as a cathode material for Li-ion batteries. 1 Its relatively high specific capacity around 170 mAh g−1 and high redox potential (∼3.5 V vs Li+/Li) has made LFP a desirable material. While it cannot achieve the same energy density as more state-of-the-art materials such as Ni-rich layered oxides, its superior safety 2,3 and inexpensive precursor materials has resulted in continuing interest in LFP. As of 2018, LFP made up 34% of cathode material production in the Li-ion battery industry. 4 LFP is also attractive for grid energy storage systems, where energy density is less of a priority.
The use of LFP has practical issues, however. Both the lithiated and delithiated phases have inherently sluggish Li diffusion, severely inhibiting the rate capability of this material. However, this issue has largely been overcome by using carbon coatings to enhance electronic conductivity and small LFP particles to reduce the Li diffusion length within the particle. 5–7 Still, LFP suffers from capacity fading issues, especially when operated at high temperature. 8
Capacity fade in LFP has been studied extensively. It has been observed that particle cracking due to a large mismatch strain between the LiFePO4 and FePO4 phases could lead to electrical disconnect and loss of accessible capacity. 9,10 Other works studying commercial LFP/graphite cells showed that Li inventory loss leads to considerable capacity loss in high temperature cycling and storage experiments. 11–17 Some works have considered the effect of electrolyte additives on capacity fade in LFP/graphite cells, including vinylene carbonate (VC), 18 lithium difluoro(oxalate)borate (LiDFOB), 19 fluoroethylene carbonate (FEC), 20 trimethyl borate (TMB), 21 and tris(pentafluorophenyl) borane (TPFPB). 22 One major degradation mechanism of LFP/graphite cells is said to be the dissolution of Fe from the positive electrode, 23–26 and that the existence of impurity phases might be more susceptible to Fe dissolution than bulk LFP itself. 27 Further, dissolved Fe ions can migrate to the negative electrode and deposit on the graphite surface, which is thought to catalyze electrolyte reduction and solid electrolyte interphase (SEI) formation due to the high electronic conductivity of the deposited Fe metal. 28,29 It is widely accepted that Fe dissolution is initiated by the formation of HF from the reaction of the LiPF6 salt with residual water present in the cell, and subsequent attack of the LFP surface by HF. Koltypin et al. showed that storing LFP in electrolyte containing 100 ppm of intentionally added water significantly increased Fe dissolution after 20 d of storage. 30
Several approaches have been adopted to limit or suppress the dissolution of Fe from LFP. Using electrolyte additives such as vinylene carbonate (VC) was shown by Wu et al. to improve capacity retention and reduce the amount of Fe detected on a MCMB negative electrode after high temperature cycling. 18 Preventing the formation of HF by replacing the LiPF6 salt with LiClO4 or lithium bis-oxalatoborate (LiBOB) was shown to reduce the propensity for Fe dissolution in LFP/graphite cells. 26,30,31
Some recent work considered the importance of drying protocols on the water retention and subsequent performance of various electrode materials. Huttner et al. studied the impact of different drying procedures on the resulting water content and electrochemical performance of NMC622/graphite cells, showing that retaining some residual water after drying led to superior performance. 32 Previous work by Burns et al. showed that some intentionally added water in LCO/graphite and NMC/graphite cells could lead to marginally improved performance. 33 Stich et al. studied the water retention and resorption capacity of several materials, including LFP, NMC, graphite, LiCoO2 (LCO), LiMn2O4, and some common separator materials using Karl Fischer (KF) titration techniques. 34 They also showed in that work that large amounts of intentionally added water (1000 ppm) is detrimental to the performance of an LFP/graphite cell.
This work considered the impact of water contamination and various electrolyte additives on the performance of LFP/graphite cells. Different amounts of moisture in cells was achieved by controlling the vacuum drying temperature before filling with electrolyte. The additive systems studied in this work were shown previously to lead to long cycle life in NMC/graphite chemistries. 35–37 Cell performance was tested for water-containing and water-free cells using long-term cycling tests at 20 °C, 40°C, and 55 °C, as well as high temperature OCV storage experiments at 60 °C. Additionally, ultra-high precision coulometry (UHPC) tests were carried out to probe low-rate cycle performance. It was found that removing excess water from the cell greatly improved the performance in cells containing electrolyte without additives. When electrolyte additives were used, however, the impact of water contamination was minimal, and in some cases led to worse capacity retention. The impact of Fe dissolution on capacity fade and degradation under various conditions in these cells was investigated with scanning micro X-ray Fluorescence spectroscopy (μXRF), where it was found that most electrolyte additives suppressed Fe dissolution, even at high temperature. Finally, the performance of LFP/graphite and NMC532/graphite cells with identical graphite negative electrodes and electrolyte additives were compared cycling at 40 °C and 55 °C, showing much better capacity retention in the NMC cells compared to LFP. This suggests that capacity fade due to Li inventory loss is a major issue in the LFP/graphite chemistry at elevated temperature that must be overcome to achieve competitive lifetimes to NMC chemistries.
Experimental
Electrolyte preparation
All electrolyte materials were used as-received and prepared in an Ar-filled glovebox. The solvent blend used for all electrolytes in this work was a mixture of ethylene carbonate (EC) and dimethyl carbonate (DMC) in a ratio of 3:7 (w/w, <20 ppm water, Shenzhen Capchem). Methyl acetate (MA, Shenzhen Capchem) was used as a co-solvent in some cases. The base electrolyte hereby referred to as control (CTRL) consisted of 1.5 M LiPF6 (BASF) in EC:DMC 3:7. Several electrolyte additives were added to the base electrolyte in this work: vinylene carbonate (VC, BASF), fluoroethylene carbonate (FEC, BASF), LiPO2F2 (LFO, Shenzhen Capchem), and ethylene sulfate (DTD, Shenzhen Capchem). These additives were added to the CTRL electrolyte in different proportions, in single and binary additive blends. The different additive combinations considered were: 2% VC (2VC), 2% FEC (2FEC), 1% LFO (1LFO), 2% VC + 1% DTD (2VC + 1DTD), and 2% FEC + 1% LFO (2FEC + 1LFO). The shortened names of these additive systems will be used throughout this work.
Pouch cells
402035-size LiFePO4 (LFP, Hunan Yuneng)/artificial graphite (AG, Kaijin AML-400, simply referred to as graphite throughout this work) pouch cells were obtained from LiFUN Technologies (Zhuzhou, Hunan province, China). Full specifications of the cells used in this work can be found in Table SI (available online at stacks.iop.org/JES/167/130543/mmedia). Physical characterizations of the active materials as provided by the suppliers can be found in Table S2. These cells were assembled and vacuum sealed without electrolyte. Before filling with electrolyte, cells were transferred into an Ar-filled glovebox, cut open, and heated under vacuum for 14 h to remove residual moisture from the assembly procedure. The heating temperatures varied between 100 °C and 120 °C, depending on the experiment. It is noted that the heating temperatures throughout this paper quote the heater setpoint temperature. Actual temperatures reached inside the cell varied by a small systematic amount. Figure S1 shows a schematic of the vacuum heating system, as well as the true temperatures reached in the center of the jellyroll of a pouch cell for a given setpoint.
After heating, cells were filled with 1.0 ml (∼1.2 g) of electrolyte and vacuum sealed under −90 kPa gauge pressure in a vacuum sealer (MSK-115A, MTI corp.) for 4 s. After filling, cells were held at a constant voltage of 1.5 V for ∼24 h to ensure adequate wetting of the electrodes. Cells then underwent a single "formation" cycle on a Maccor 4000 series cycler at 40 °C. Cells were charged at a rate of C/20 to 3.65 V, held at this voltage for 1 h, then discharged at C/20 rate to approximately 60% state of charge. After formation, the cells were brought into an Ar-filled glovebox, cut open to remove any gases that formed during formation, and vacuum-sealed.
The data for the single crystal LiNi0.5Mn0.3Co0.2O2 (NMC532)/AG cells shown in Fig. 12 are for the same cells presented in a recent publication by Harlow et al., where experimental details can be found. 35
Water content measurements
The moisture contents of LFP electrodes extracted from the full pouch cells were measured with a Karl Fischer (KF) coulometric titrator (Mettler Toledo C30) equipped with an external drying oven (Mettler Toledo DO308). Samples were extracted from pouch cells in an Ar-filled glovebox without electrolyte after vacuum drying at different temperatures. Between 0.5 g and 0.7 g of sample (active material + conductive additive + binder + current collector) was used per test. The KF drying oven was set to 200 °C, and each sample was run for 30 min. A blank sample was run at the start of each day to determine the amount of moisture in the atmosphere transferred during sample loading, which was subtracted from each subsequent run.
Electrochemical impedance spectroscopy (EIS)
All EIS measurements presented in this work were recorded at a temperature of 10.0 °C  0.1 °C using a Biologic VMP3 potentiostat. Impedance data were collected from 100 kHz to 10 mHz with 10 data points per decade in frequency. The height of the sinusoidal signal was 10.0 mV. Impedance values quoted throughout this work were normalized to the active area of the cells (131.8 cm2).
Cycling protocols
Long term cycling tests were carried on a Neware cycler (Shenzhen, China). Cells were cycled at 20 °C, 40 °C, and 55 °C. All cells were cycled between 2.5 V and 3.65 V. Cells at 20 °C were cycled at a rate of 1C in CCCV mode on charge with a C/20 cut-off current, and 1C in CC mode on discharge. Every 100 cycles, cells at 20 °C underwent a "rate-map" test to probe discharge rate capability. Cells were charged at a rate of 1C, CCCV and discharged at progressive rates: C/20, 1C, 2 C, and 3 C. Cells at 40 °C and 55 °C were charged at a rate of C/3 CCCV on charge with a C/20 cut-off current, and discharged at C/3 with no constant voltage step. For cells cycling at 40 °C and 55 °C, a "checkup" cycle at C/20 was done every 50 cycles to monitor low-rate capacity retention. For cycling tests at 20 °C and 40 °C, nominally identical pair cells were made for each testing condition for each electrolyte. Pair cells were not made for 55 °C cycling due to limited cycler channels at 55 °C.
Ultra-high precision coulometry (UHPC) tests were done on the UHPC system at Dalhousie University. Cells were cycled at 40.0 °C  0.1 °C at a rate of C/20 for both charge and discharge. Further details about this setup can be found in Ref. 38. Nominally identical pair cells were made for each UHPC test.
OCV storage
OCV storage experiments were carried out in a 60 °C temperature box connected to a custom-built high-precision charger. The procedure done here follows a "smart" storage protocol outlined in Sinha et al. 39 Cells were cycled for two full cycles before storage between 2.5 V and 3.65 V at a rate of C/10 to precisely determine the initial discharge capacity. Cells were then charged to 3.65 V and held at that voltage for 10 h. Next, cells went into open circuit for 500 h. After the 500 h storage period, cells were discharged, charged, and discharged again at C/10 rate to determine the reversible and irreversible capacity loss during storage. Cells then went through a second 500 h storage period using the same procedure.
Ex-situ gas measurements
The volume of gas evolved in the cell was measured ex-situ after formation. Gas volume was measured using Archimedes' Principle. Cells were hung on a hook attached to the underside of a Shimadzu balance (AUW200D) and suspended in a beaker of deionized water (18 MΩ) at room temperature. The weight of the suspended cell was measured before and after a given test. The change in volume, Δv, due to gas produced in the cell is related to the change in weight  by:
by:

where  is the density of deionized water and
  is acceleration due to gravity.
Micro X-ray fluorescence spectroscopy
μXRF analysis and Fe calibration were carried out as previously described. 40,41 Briefly, a known linear gradient of Fe was sputtered on a pristine graphite electrode to prepare a matrix-matched Fe calibrant. The Fe signal to known mass loading ratio was determined at four different positions on the calibrant after scanning it using μXRF. The fractional error in the data was taken to be the same as the ratio of the standard deviation of the four calibration measurements divided by their average. The ratio of Fe signal to mass loading was used to convert the Fe signal from each sample to a loading in terms of μg cm−2. Cells were discharged to 2.5 V and the cell stack was unrolled to completely dry in a fumehood before μXRF analysis. A portion of the negative electrode was cut and mounted on a flat polyacrylic plate with double-sided tape, which was placed on the sample stage that moves in the x and y directions during the measurement. Sample scanning was carried out at a 45 or 100 μm step size with a 25 μm spot size, a scanning rate of 4.00 mm s−1 and a 200 μA tube current in the range of 0-50 keV using a Rh X-ray source under vacuum (<20 mbar). μXRF calibration was carried out for the two different step sizes used in this work.
Differential scanning calorimetry
The effect of vacuum heating on the pouch cell separator was investigated by differential scanning calorimetry (DSC). Thermograms were recorded with a TA Instruments Q1000 DSC equipped with a RCS cooler. The DSC cell heat flow was calibrated with sapphire crystals (provided with instrument) and the cell constants (temperature and enthalpy) were determined using indium as standard reference material (Tmpt = 156.6 °C and ΔH = 28.71 W g−1) 42 before experiments and a post-experiment check was also performed to confirm no instrument drift. Following recommendations in Ref. 43, all calibrations and sample protocols were the same: same pan type, purge gas, flow rate and heating rate were used. These include using TA Instruments standard hermetic sample pans, nitrogen gas at a flow rate of 50 ml min−1 and heating rates of 10 C min−1. To ensure a good baseline, the temperature range used was room temperature to 250 °C. Sample preparation consisted of cutting a small piece of separator (ca. 2.5 mg) and forming it into a small ball. This was weighed with a Sartorius SE2 microbalance in a tared DSC pan and hermetically sealed for experimentation.
Thermogravimetric analysis (TGA)
TGA measurements were carried out on a TA Instruments SDT Q600. Measurements were recorded from room temperature up to 500 °C. The instrument was weight calibrated (standard provided) and temperature calibrated using high-purity metals (99.999% Al, In, Sn, Pb and Zn) under an argon flow of 100 ml min−1. Sample measurements were performed with alumina crucibles and carried out under an Ar atmosphere (100 ml min−1). The protocol for these measurements was to isothermally purge the sample space with Ar for 30 min and then heat at one of two heating rates: 10 °C min−1 and 0.5 °C min−1.
Results
Water content in LFP/AG cells
Figure 1 shows results from Karl Fischer (KF) titrations of LFP positive electrodes. Points at 25 °C refer to LFP electrodes as received with no additional vacuum drying. The as-received electrodes had a high water content, nearing 1000 ppm. As vacuum drying temperatures were increased, the amount of water detected in the electrodes expectedly went down. However, when heated at 100 °C for 14 h, the water content in the electrode was still around 500 ppm. Drying at higher temperatures of 120 °C or 140 °C brought this value down even further to around 100 ppm. As it did not appear that heating to 140 °C brought a significant advantage over drying at 120 °C, drying temperatures up to a maximum of 120 °C were studied in this work. The KF apparatus was set up in air, and while LFP samples were prepared in an Ar glovebox, the samples would have spent a small amount of time (approximately 20 s) in the air before being loaded into the furnace for measurement. Räsänen et al. showed that LFP powder can absorb up to 400 ppm of water in 1 min in an environment with 35% relative humidity. 44 It is likely that some water was introduced from the environment as the samples were loaded, possibly leading to the relatively large spread in repeat samples (Fig. 1).
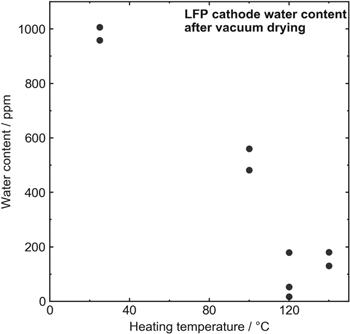
Figure 1. Water content in LFP electrodes as a function of vacuum drying temperature as measured by KF titration. Repeat measurements are shown by individual points.
Download figure:
Standard image High-resolution imageThere was initially some concern that higher vacuum drying temperatures could possibly melt the separator. However, it turned out that this was not an issue. DSC thermograms shown in Fig. S2 show roughly the same melting onset for separator samples that were not heated, and samples heated to 130 °C and 140 °C. The enthalpy (tabulated in Fig. S2) does show some small changes, an increase in enthalpy is noted indicating a higher degree of crystallinity. This is expected as at 140 oC heating, the cell is well into the melt area and upon cooling, it is assumed we are not following the same protocols as the separator manufacturer and cooling rates have an impact on crystal ordering. Further, rate capability and voltage hysteresis when cycling at 1C rate at 20 °C was unaffected after elevated heating temperatures, as can be seen in Fig. S3, indicating that electrolyte transport in the separator was unaffected by the elevated heating temperatures, and suggesting that the pore network in the separator was not degraded.
The mechanical integrity of both the LFP and graphite electrodes should also be considered when studying the effect of drying protocols on cell performance. Huttner et al. studied the effects of different post-drying procedures in NMC622/graphite cells, and found lower mechanical integrity of both the cathode and anode after various vacuum drying at 120 °C. 32 It should be noted that Huttner et al. dried for 18 or 96 h, while in this work cells were dried for only 14 h. This reduction in mechanical integrity was attributed to decomposition of CMC/SBR and PVDF binders in the anode and cathode, respectively. The LFP and graphite electrodes used in this work were tested for their mechanical integrity using a "bend tester" (see Fig. 4 in Ref. 45). Electrodes were bent around rods ranging in diameter from 6.3 mm to 1.5 mm. The test was considered "failed" for a given rod if there was any indication of electrode cracking or loss of adhesion from the current collector. LFP and graphite electrodes extracted from as-received, 100 °C dried, and 120 °C dried cells passed the bend test for all diameters of rods, indicating good mechanical integrity of electrodes at least in the dry state before the addition of electrolyte. However, the impact of binder degradation on the long-term performance of cells dried at elevated temperature should not be neglected. Figure S3 shows that while the voltage polarization was not impacted when cells were heated up to 140 °C, the capacity retention was slightly lower after 1000 cycles. The impact of binder degradation may be especially visible in high rate cycling (as was done in Fig. S3), where the electrode volumes change rapidly during charge and discharge. Therefore, the effect of drying temperature on binder integrity must be kept in mind in the high rate, low temperature cycling results that will be presented below. If cases were presented where cell performance was severely negatively affected by increased drying temperatures, an alternative approach could be to dry the cells for longer times at lower temperature, however it will be seen below that any negative impact of the higher drying temperature, if any, was minor.
Further, the thermal degradation of the CMC binder was tested using thermogravimetric analysis (TGA). Figure S4 shows the thermograms for CMC material (Daicel) heated in Ar atmosphere at 10 °C min−1 and 0.5 °C min−1. At both heating rates, no features were seen in the temperature range used for vacuum drying in this work (100 °C–120 °C), suggesting no thermal decomposition occurred at these temperatures. Small weight loss features at low temperature were likely due to the evaporation of adsorbed water on the sample.
Formation
Initial formation differential capacity curves showed very little differences between cells heated at 100 °C and cells heated to 120 °C (Fig. S5). Figure 2a shows the volume of gas produced in the formation cycle for different additive systems for different heating temperatures, and Fig. 2b shows the charge transfer resistance  after formation measured as the width of the depressed semi-circle in the Nyquist plot of the EIS spectra (full EIS spectra after formation can be seen in Fig. S6). Increasing the drying temperature (i.e. removing excess water from the cell) only had an impact on cells with control electrolyte (CTRL) on the formation cycle. Drying the cells at 120 °C reduced the volume of gas evolved as well as the
  measured after formation. For cells containing additives, no significant differences were seen in either the gas volume and
  between the two heating temperatures.

Figure 2. (a) Gas evolved during the formation cycle and (b) charge-transfer impedance for LFP/AG cells with different additive systems and different vacuum drying temperatures.
Download figure:
Standard image High-resolution imageHigh-precision coulometry
Figure 3 shows UHPC cycling results for LFP cells with CTRL and 2 VC electrolytes. Figure 3a shows voltage-capacity curves for cells with control electrolyte heated at 100 °C (black line) and 120 °C (red line). The cell with control electrolyte showed massive charge endpoint capacity slippage from cycle to cycle. A large amount of slippage suggests either an excessive amount of electrolyte oxidation at the positive electrode, or a significant amount of dissolution of Fe from the cathode. 46 The question of transition metal dissolution will be considered later. It seems unlikely that electrolyte would react readily at the positive electrode since the operating voltage of LFP is low compared to NMC chemistries. Alternatively, the result of this large slippage could be the reaction products from the negative electrode—most likely lithium alkoxides—migrating to the positive electrode and reacting, suggesting complex crosstalk reactions. Drying the cell at 120 °C and thus removing most of the residual water dramatically lowered the charge endpoint capacity slippage in the control electrolyte. In the case where electrolyte additives were used (2% VC, Fig. 3b), charge endpoint slippage remained low in the cell dried at 100 °C, with no noticeable difference when dried at 120 °C. It has been shown that the incorporation of VC in the electrolyte of Li-ion cells eliminates production of lithium alkoxides. 47 The UHPC results were investigated further in Fig. 3c, which shows the coulombic efficiency (CE) as a function of cycle number for CTRL and 2VC cells vacuum dried at 100 °C and 120 °C. For cells with CTRL electrolyte dried at 100 °C, CE decreased over the first several cycles, while the cell dried at 120 °C reached a stable CE just above 0.99 after 16 cycles. The cells with 2 VC both reached a CE around 0.999 after 16 cycles regardless of drying temperature.
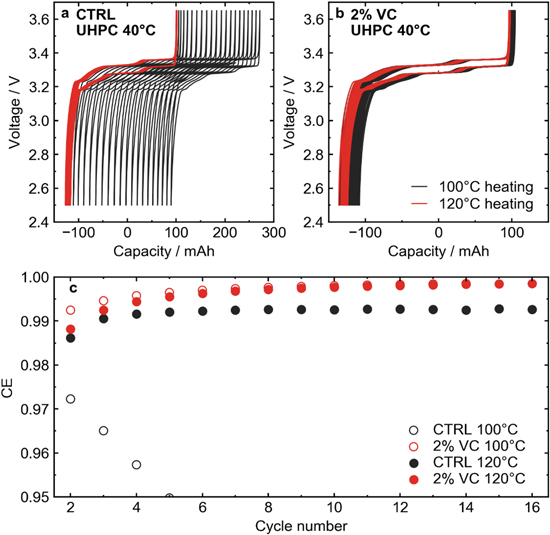
Figure 3. (a) Voltage-capacity curves for LFP cells with control electrolyte cycled at a rate of C/20 at 40 °C. Cells vacuum dried at 100 °C vs 120 °C are shown. (b) Voltage-capacity curves for LFP cells with the 2VC electrolyte vacuum dried at 100 °C and 120 °C. Cells were cycled at C/20 at 40 °C. (c) Coulombic efficiency (CE) vs cycle number for the cycles shown in panels (a) and (b).
Download figure:
Standard image High-resolution imageFrom the UHPC results with 2% VC, it appeared that the presence of the electrolyte additive prevented much of the negative impact of residual water in LFP. This was further explored with a range of different additive systems that have been used primarily in NMC/graphite chemistries. Figure 4 shows CE as a function of cycle number for UHPC tests for LFP cells vacuum dried at 100 °C and 120 °C with various additive systems: (a) CTRL, (b) 2VC, (c) 2FEC, (d) 1LFO, (e) 2VC + 1DTD, (f) 2FEC + 1LFO, (g) 2VC + 1DTD + 20MA, and (h) 2FEC + 1LFO + 20MA. Figure 4i summarizes these results, showing the CE of the cells with the different electrolytes tested at different drying temperatures after cycle 14. It would have been ideal to compare cells after more than 16 cycles when the SEI was more mature, but unfortunately an unplanned power outage cut the cycling of the 100 °C heated cells short. Due to the time-sensitive nature of CE measurements, 48 the cells did not resume cycling after this outage. The CE for the control cell vacuum dried at 100 °C was so low that it is off scale in Fig. 4a (∼0.95 after 5 cycles and decreasing, see Fig. 3c). While vacuum drying at 120 °C greatly improved the CE of CTRL, it was not competitive compared to cells with electrolyte additives. Looking broadly at all electrolyte additives studied, there were only small differences between the CEs of cells dried at the different temperatures, if any. VC-containing cells (2VC, 2VC + 1DTD) had the best CE values after ∼15 cycles. Some cells had 20% methyl acetate (MA), a common co-solvent for fast charging applications, added to the electrolyte. 49–51 Typically, the addition of MA results in a lifetime penalty due to the increased reactivity of MA compared to carbonate solvents such as DMC, as well as its poor SEI-forming properties. 36,51 However, in the UHPC tests, the CE of cells containing MA did not seem to be severely affected at 40 °C. This was likely in part due to the lower operating voltage of LFP/AG cells compared to NMC chemistries, which reduces the propensity for parasitic reactions between solvent molecules in the electrolyte and the positive electrode.

Figure 4. CE vs cycle number for LFP cells vacuum dried at different temperatures cycled using the UHPC cycler at 40 °C and a rate of C/20. Different additive systems are shown: (a) CTRL, (b) 2% VC, (c) 2% FEC, (d) 1% LFO, (e) 2% VC + 1% DTD, (f) 2% FEC + 1% LFO, (g) 2% VC + 1% DTD + 20% MA, and (h) 2% FEC + 1% LFO + 20% MA. (i) Summary of CE values under the conditions in the previous panels after 14 cycles Both CTRL cells are off scale in this panel.
Download figure:
Standard image High-resolution imageFigures 3a and 3b showed the difference in charge endpoint motion for cells with different vacuum drying temperatures and control electrolyte vs 2VC by examining the shift in voltage curves. Figure 5 considers charge endpoint slippage more quantitatively, showing the zeroed (at cycle 2) charge endpoint capacity vs cycle number for more electrolyte additives. Figure 5i shows the zeroed charge endpoint at cycle 14 for all electrolytes studied. Again, the improved performance of the control electrolyte upon increased vacuum drying temperature can be seen. Looking at the various electrolyte additives, some difference could be seen between cells heated at 100 °C and 120 °C. Nearly all electrolytes showed higher charge endpoint capacity slippage after heating at 120 °C compared to 100 °C heating, with the exception of 2FEC + 1LFO, where the slippage was roughly the same within error between the two heating temperatures. This suggests, interestingly, that there are in fact more oxidation reactions when there is less water present in the cells initially, likely as a result of crosstalk from the negative electrode.
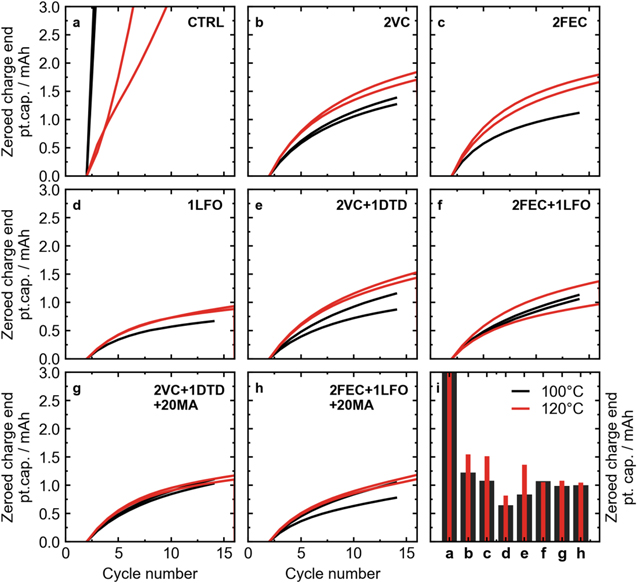
Figure 5. Zeroed (at cycle 2) charge endpoint capacity as a function of cycle number for LFP cells vacuum dried at different temperatures cycled using the UHPC system at 40 °C and a rate of C/20. (a) CTRL, (b) 2% VC, (c) 2% FEC, (d) 1% LFO, (e) 2% VC + 1% DTD, (f) 2% FEC + 1% LFO, (g) 2% VC + 1% DTD + 20% MA, and (h) 2% FEC + 1% LFO + 20% MA. (i) Summary of zeroed charge endpoint capacity values after 14 cycles.
Download figure:
Standard image High-resolution imageLong-term cycling
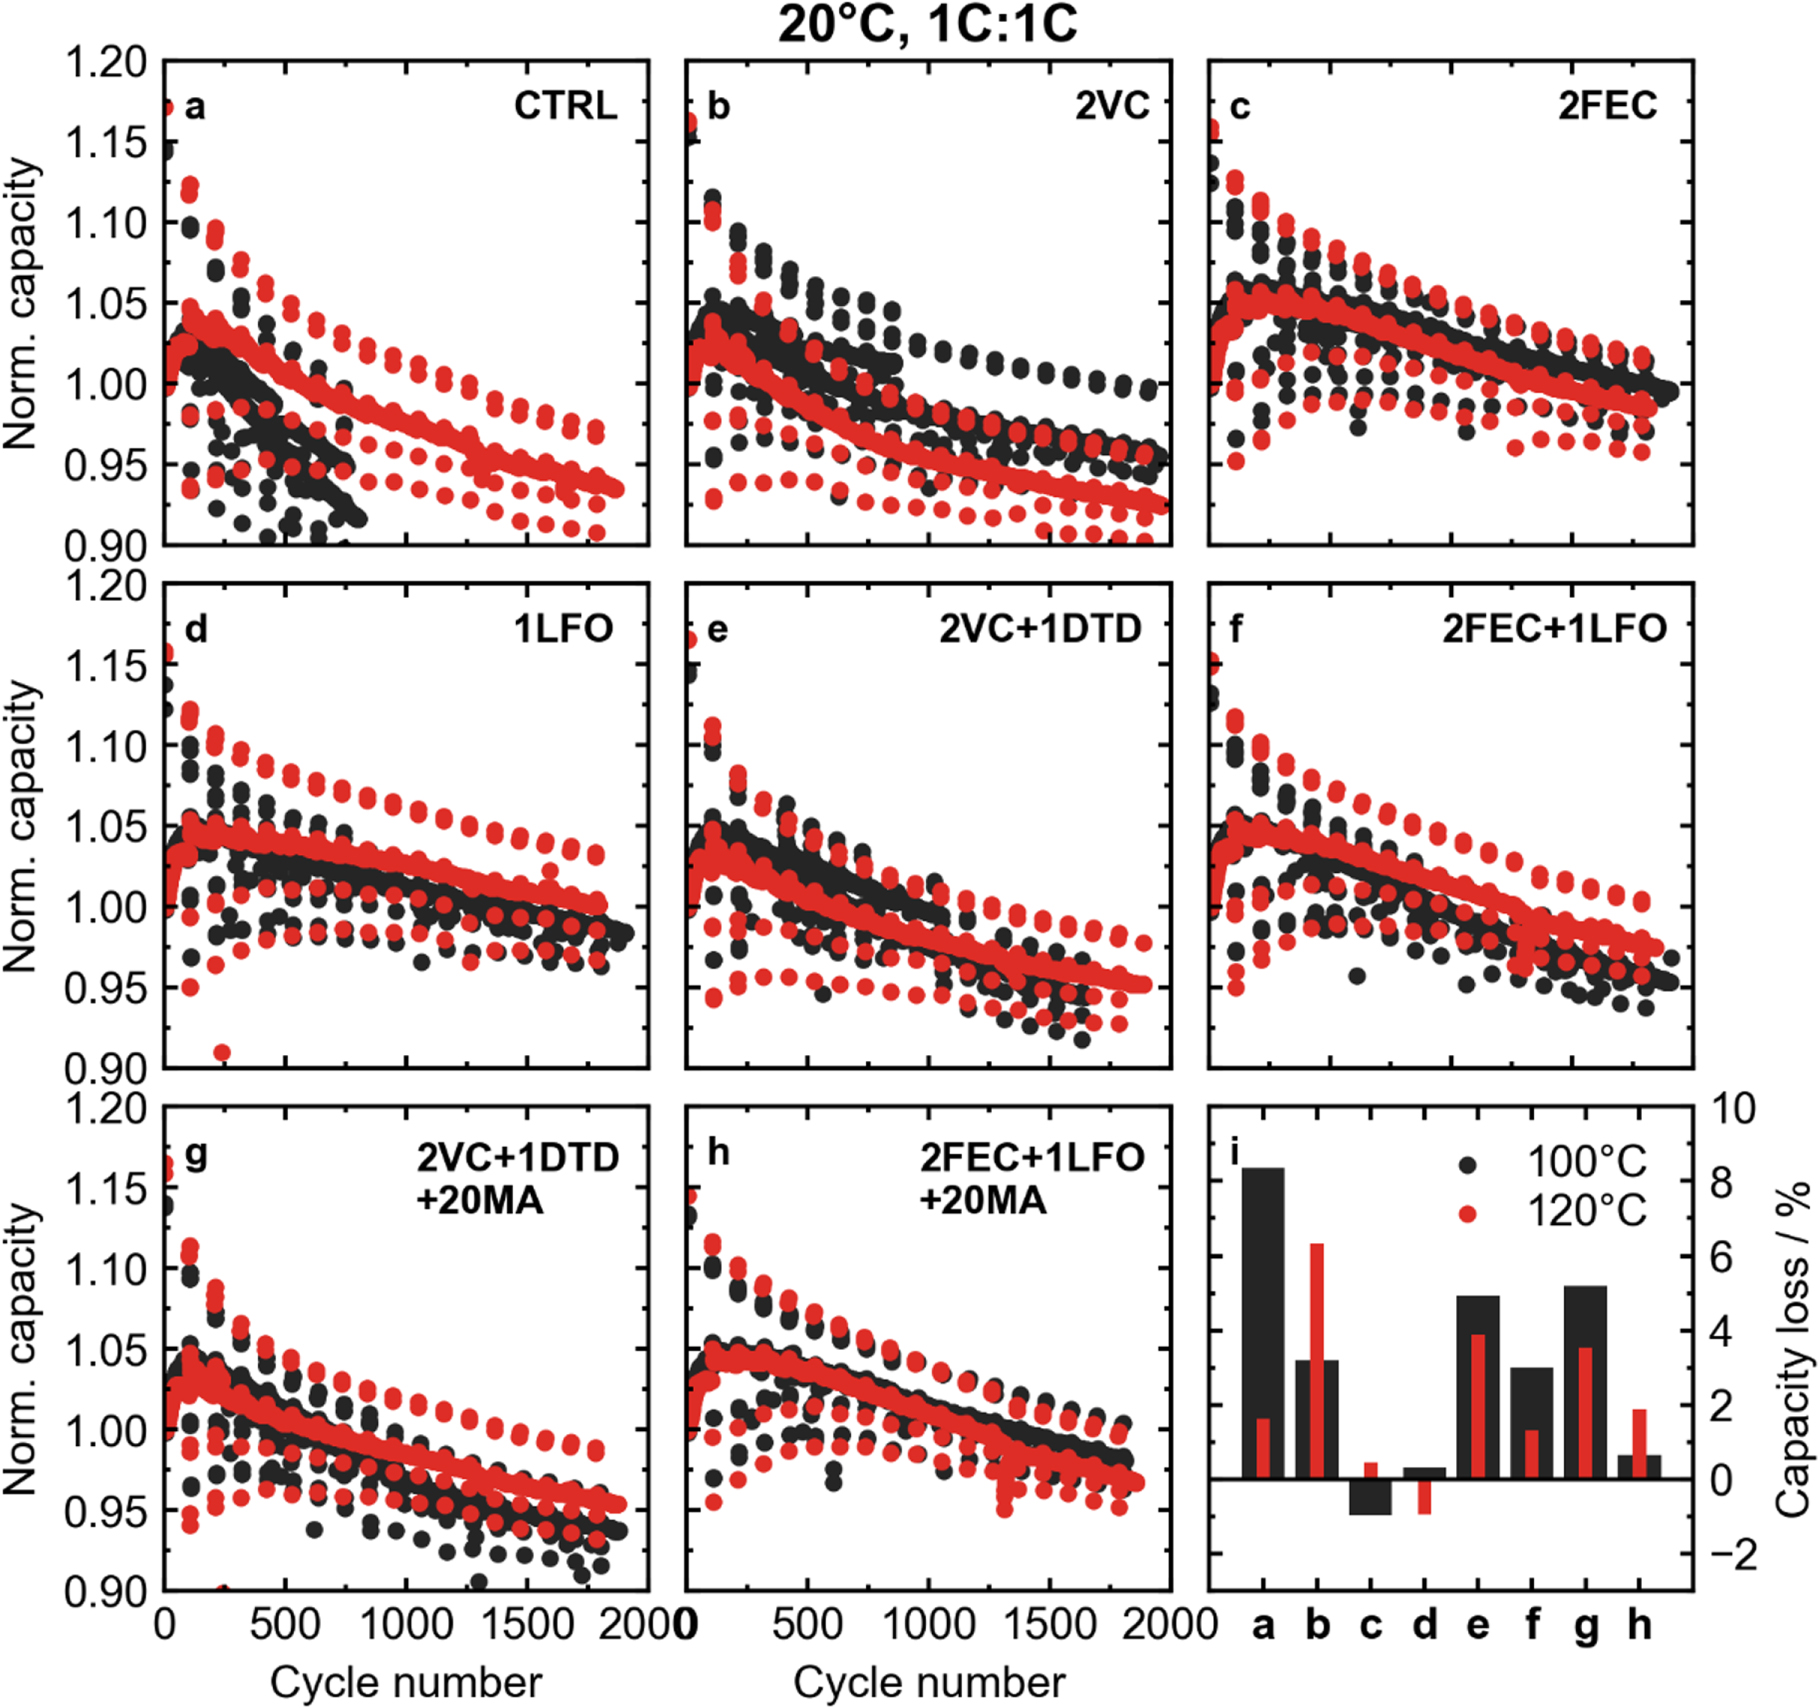
Figure 6 shows long-term cycling results for LFP cells at 20 °C. Since the rate of parasitic reactions between the electrodes and the electrolyte should be low at this temperature, cycling at high rate serves as a good test to understand kinetic limitations in the cell, including bulk electrolyte transport, and charge transfer across the SEI. Normalized capacity (normalized to cycle 5) vs cycle number is shown for different additive systems. These cells were cycled at 1C rate for both charge and discharge. Figure 6i shows percent capacity loss after 1500 cycles for cells with the different additives and vacuum drying temperatures. Overall, these cells performed well independent of the electrolyte system at 20 °C. Even cells without electrolyte additives (CTRL) dried at 120 °C had about 97% capacity retention after close to 1000 cycles. The best performing additive system at 20 °C was either 2FEC in cells dried at 100 °C or 1LFO in cells dried at 120 °C, which both had a normalized capacity above 100% after 1000 cycles.

Figure 6. Long term cycling results for LFP cells at 20 °C and a rate of 1C:1C. A "rate map" was carried out every 100 cycles to monitor low− (C/20) and high-rate (2C, 3C) capacity retention. Normalized capacity vs cycle number for cells with different additive systems: (a) CTRL, (b) 2% VC, (c) 2% FEC, (d) 1% LFO, (e) 2%VC + 1% DTD, (f) 2% FEC + 1% LFO, (g) 2% VC + 1% DTD + 20% MA, and (h) 2% FEC + 1% LFO + 20% MA. (i) Percent capacity loss for cells with different additives and vacuum drying temperatures after 1500 cycles (note: the CTRL cells are after 800 cycles). Capacity is normalized to the fifth cycle, so negative capacity loss is possible using that definition in cases where initial capacity increases were observed.
Download figure:
Standard image High-resolution imageAll cells cycling at 20 °C showed an initial increase in capacity over the first ∼100 cycles. This increase could be large, sometimes close to 5% of the initial capacity. This feature corresponded to a decrease in voltage polarization in early cycles, as can be seen in Fig. S7. Voltage polarization, ΔV, is the difference between average voltage during charge and average voltage during discharge. This quantity can be related to changes in cell impedance. This initial capacity increase has been reported in previous studies of LFP/graphite cells cycled at 1C-rate and above, where it was also related to initial decreases in impedance. 12 Other works attributed this effect to initial cracking of the carbon coating and subsequently improved penetration of electrolyte. 52 It is likely that some combination of these proposed mechanisms led to the initial capacity increase at high rate.
The impact of water contamination on capacity retention at 20 °C was minimal. There was a clear improvement in the cells with CTRL electrolyte, but for cells with electrolyte additives the difference, if any, was less noticeable. Cells with 1LFO had slightly better capacity retention after 1000 cycles when dried at the higher temperature, but cells with electrolytes such as 2VC performed slightly worse after removing excess water by vacuum drying at 120 °C. The lack of obvious differences between vacuum drying temperatures in cycling at 20 °C was expected to an extent, as the degradation of LFP is not expected to be severe at low temperature, and the rate of parasitic reactions should be low. Differences in water contamination should have more of an impact at higher cycling temperatures.
Figure 7 shows normalized capacity vs cycle number for cells cycled at 40 °C. All cells were cycled at a rate of C/3 for charge and discharge. Figure 7i shows percent capacity loss for the different cells after 600 cycles. Once again, an improvement in capacity retention for cells with the control electrolyte was seen when the cells were dried at 120 °C. Cells containing VC (2VC, 2VC + 1DTD, and 2VC + 1DTD + 20MA) did not appear to have any improved capacity retention with increased drying temperature. On the other hand, cells with electrolytes containing FEC and/or LFO showed improved capacity retention when excess water was removed at 120 °C. The biggest difference was seen in cells with 1LFO, which performed poorly when dried at 100 °C, but was almost competitive with the other additive systems when dried at 120 °C.
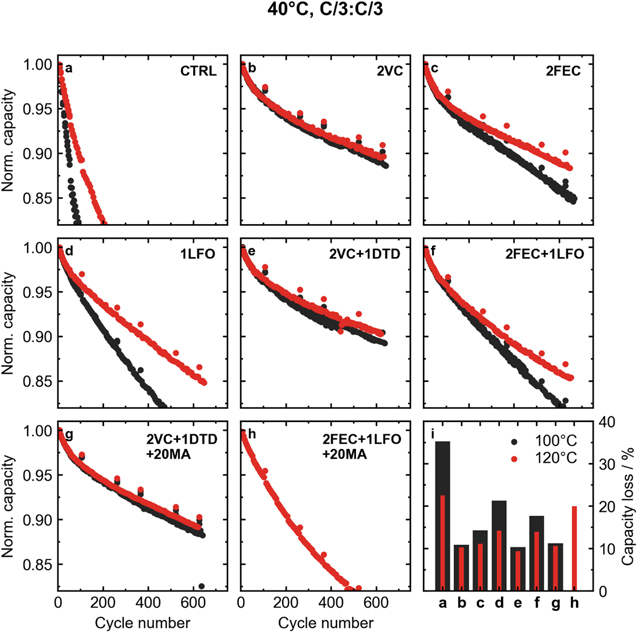
Figure 7. Long-term cycling results for LFP cells at 40 °C and a rate of C/3:C/3. Normalized capacity vs cycle number for cells with different additive systems: (a) CTRL, (b) 2% VC, (c) 2% FEC, (d) 1% LFO, (e) 2%VC + 1% DTD, (f) 2% FEC + 1% LFO, (g) 2% VC + 1% DTD + 20% MA, and (h) 2% FEC + 1% LFO + 20% MA. (i) Summary of percent capacity lost for cells with different additives and drying temperatures after 600 cycles. Note that the capacity loss for the CTRL cells is shown after 300 cycles.
Download figure:
Standard image High-resolution imageFigure 8 shows normalized capacity vs cycle number for cells cycled at 55 °C. Like at 40 °C, cells were cycled at C/3 rate during both charge and discharge. Figure 8i shows percent capacity loss after 300 cycles with the exception cells with CTRL electrolyte, which shows capacity loss after only 200 cycles. Unlike cycling at 20 °C and 40 °C, there was no significant difference in capacity retention in cells vacuum dried at 100 °C vs 120 °C initially. Further, cells dried at 100 °C and 120 °C showed nearly identical growth in voltage polarization for a given additive system, with the notable exception of 2VC (Fig. S9). Interestingly, in the 2VC electrolyte, early cycling showed the two heating temperatures to have nearly identical performance, but after ∼250 cycles the curves diverged. After close to 500 cycles an obvious improvement in capacity retention was seen in the cell heated to 120 °C. In cells with the control electrolyte, which saw dramatic improvements in UHPC cycling and long-term cycling at 40 °C, cells with and without water contamination reached 80% capacity retention after only 50 cycles at 55 °C. This suggests that the dominant mechanism of degradation at 55 °C might be different than at 40 °C, or that a new degradation mechanism emerges at this elevated temperature that is independent of water contamination in the electrode. Alternatively, the impact of water could be more severe at 55 °C, and the small amount that is still in the cell after the increased vacuum drying temperature (Fig. 1) could be enough to contribute to the severe capacity fade that is seen. While cells with several additive systems had similar capacity retention at 40 °C (2VC, 2FEC, 1LFO, 2VC + 1DTD), the 2VC + 1DTD electrolyte outperformed the other systems at 55 °C.

Figure 8. Long term cycling results for LFP cells at 55 °C and a rate of C/3:C/3. Normalized capacity vs cycle number for cells with different additive systems: (a) CTRL, (b) 2% VC, (c) 2% FEC, (d) 1% LFO, (e) 2% VC + 1% DTD, (f) 2% FEC + 1% LFO, (g) 2% VC + 1% DTD + 20% MA, and (h) 2% FEC + 1% LFO + 20% MA. (i) Summary of percent capacity loss for different additives and drying temperatures after 300 cycles (note: cell with 100 °C CTRL cell is after 200 cycles).
Download figure:
Standard image High-resolution imageHigh temperature storage
OCV storage tests were carried out at 60 °C. Cells were charged to the top of charge (3.65 V) and let rest at OCV for two storage periods of 500 h each, with checkup cycles at the end of each period to monitor reversible and irreversible capacity losses. Figure 9 shows voltage vs time for these OCV periods for cells dried at 100 °C and 120 °C. Voltage drop during storage can give an indication of the capacity loss during the OCV period. 39 For cells with a given electrolyte and drying temperature, the first storage period is shown as a solid line, and the second storage period as a dashed line. Figure 9i shows the total irreversible capacity loss over the two storage periods. This was obtained by subtracting the capacity of the discharge cycle immediately preceding the first storage period from the capacity of the second discharge after the second OCV period. Once again, the extremely poor performance of cells with the control electrolyte at high temperature was seen (Fig. 9a). While off scale in this Figure, the control cell dried at 100 °C fully self-discharged to the lower cut-off voltage (2.5 V) before the end of the first 500 h storage period. The second storage period was also poor, but the cell did not fully self-discharge. The 120 °C heated cell with control electrolyte showed slightly better performance, but was still poor compared to cells with additives.

Figure 9. High temperature OCV storage results for LFP cells vacuum dried at different temperatures. Cell voltage vs storage time for cells with different additive systems: (a) CTRL, (b) 2% VC, (c) 2% FEC, (d) 1% LFO, (e) 2% VC + 1% DTD, (f) 2% FEC + 1% LFO, (g) 2% VC + 1% DTD + 20% MA, and (h) 2% FEC + 1% LFO + 20% MA. (i) Summary of absolute irreversible capacity loss after 1000 h of storage at 60 °C.
Download figure:
Standard image High-resolution imageCells containing electrolyte additives fared much better in this test, with all cells remaining above ∼3.35 V during both storage periods. Cells that performed well in other tests showed good resistance to self-discharge in the high temperature storage tests. Further, as was seen in the 55 °C cycling tests, at elevated temperatures very little differences were seen between cells with the two drying temperatures. For most additive systems, the voltage vs time curves matched almost exactly for the two drying temperatures. One notable exception was 2VC, which showed more voltage drop after vacuum drying at 120 °C. This once again supports the notion that the high temperature degradation of LFP is likely not due to excessive water contamination when electrolyte additives are used.
A comparison can be made between the first and second 500 h OCV periods in the high temperature storage experiments. As the cells aged and the SEI thickened, one would expect that the SEI layers in a good additive system will become better passivating, and thus cell will be less prone to parasitic reactions and self-discharge. This should translate to less voltage drop in an OCV storage experiment. Indeed, for the electrolytes in the LFP/graphite system that had already been proven to perform well in other tests, including 2VC, 2FEC, and 2VC + 1DTD, less voltage drop was seen in the second storage period. This suggests a better passivating SEI as time goes on, which is a good sign for the long-term calendar life of these cells. On the other hand, electrolytes that performed relatively poorly—like 1LFO—showed greater voltage drop in the second storage period. Comparing the first and second storage periods provided yet another metric to rank the performance of different electrolyte additives in LFP/AG cells.
Discussion
Impact of water content in LFP
Figure 10 summarizes the cycling and storage performance for cells with the selected electrolyte systems CTRL, 2VC, 1LFO, and 2VC + 1DTD. As shown in the previous section, the biggest improvement in performance was seen when excess water contamination was removed by increasing the drying temperature to 120 °C in cells with the control electrolyte. This difference in performance was most dramatic at 40 °C (Fig. 10b) Drying to higher temperatures and removing even more residual water could further improve the performance of control cells, although the water content of cells dried at 140 °C is only marginally lower, see Fig. 1. Even when cycling at high rate at 20 °C (Fig. 10a) an improvement in capacity retention was seen after 1000 cycles at 1C:1C rate, from 8% capacity loss to only 2% capacity loss. However, in 55 °C cycling (Fig. 10c), there was virtually no improvement between the drying temperatures, and in high temperature storage at 60 °C the benefit was marginal, translating into only a few percent higher capacity retention after 1000 h of OCV storage. This suggests that at least in the control electrolyte, the dominant degradation mechanism is temperature and protocol dependent. At 20 °C and 40 °C, the presence of excess water seems to contribute to excessive capacity fade in the control electrolyte, while at elevated temperatures this is not the case. Similar remarks could be made about the cells with 1LFO electrolyte; increasing the drying temperature to reduce water contamination led to improved capacity retention in 20 °C and 40 °C cycling tests, but performance was essentially the same in 55 °C cycling and 60 °C storage. In cells with VC-containing electrolytes (2VC, 2VC + 1DTD, and 2VC + 1DTD + 20MA), excess water had even less of an impact on performance. These cells dried at 120 °C had worse capacity retention in the 20 °C 1C:1C cycling tests than their counterparts with more water contamination. Capacity retention in 40 °C and 55 °C cycling tests and 60 °C storage was virtually identical between cells at the two drying temperatures. The inferior performance of the 120 °C dried cells cycled at high rate at 20 °C may at first suggest that a more resistive SEI film is formed in VC-containing cells that did not contain excess water. However, Fig. S6 shows the EIS spectra of cells after formation for not only VC-containing cells but all cells tested were very similar between the two drying temperatures. Further, an increase in voltage polarization would indicate that impedance growth is a primary degradation mechanism in cells cycled at high rate and relatively low temperature. 36 However, inspecting the normalized voltage polarization at 20 °C in Fig. S7, it was seen that ΔV growth in VC-containing cells was less severe in cells dried at 120 °C. Therefore, it is unlikely that impedance growth is to blame for the slightly reduced performance of VC-containing cells at 20 °C with excess water removed.
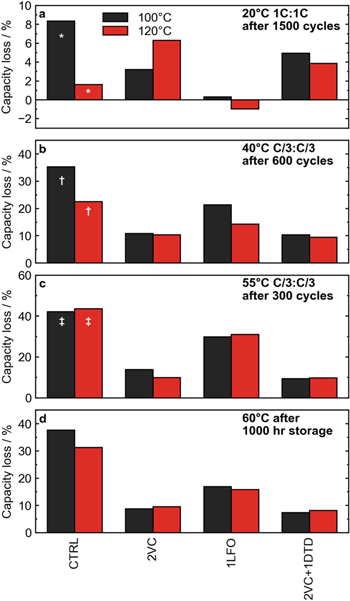
Figure 10. Summary of cycling and storage tests for key additives in cells with different vacuum drying temperatures. (a) Percent capacity loss after cycling at 20 °C at 1C:1C rate for 1000 cycles. The bars marked by * indicates only 800 cycles were completed. (b) Percent capacity loss after cycling at 40 °C at C/3:C/3 rate for 300 cycles. The bars marked by † indicates only 300 cycles were completed. (c) Percent capacity loss after cycling at 55 °C at C/3:C/3 rate for 250 cycles. The bars marked by ‡ indicates only 200 cycles were completed. (d) Percent irreversible capacity loss after 1000 h of OCV storage a 60 °C.
Download figure:
Standard image High-resolution imageFe dissolution
One of the most commonly stated degradation mechanisms for LFP is the dissolution of Fe from the cathode. This is believed to be a result of LiPF6 salt hydrolysis and corrosion of LFP surface by acidic products such as HF, and subsequent deposition of Fe on the graphite negative electrode. It was therefore crucial to understand the extent of Fe dissolution under various experimental conditions and water contents in LFP to interpret the results presented above. Scanning micro X-ray fluorescence spectroscopy (μXRF) was performed on the disassembled graphite electrodes from cells with a selection of different electrolyte additives to measure the concentration of Fe found after various cycling tests. 40,41 Figures 11a–11c show detected Fe loading on the graphite electrode as a function of cycle number for cells cycled at 20 °C, 40 °C, and 55 °C, respectively. All cells here were cycled at a rate of C/3 for both charge and discharge and were all dried at 100 °C. Separate cells were made for each datapoint seen in this graph. Figure 11 shows that at all temperatures, even 20 °C, the control cells experience dramatic amounts of Fe dissolution. This correlates well with the poor performance that was seen in the control cells at all temperatures when they were dried at 100 °C. This suggests that Fe dissolution may contribute to capacity fade when the control electrolyte is used. At 20 °C, all cells measured by μXRF containing electrolyte additives showed virtually no Fe dissolution after more than 400 cycles at C/3 (∼2500 h of testing). This trend continued in cells cycled at 40 °C, where the Fe loading detected in cells containing additives was much lower than what was seen in the control electrolyte. Cells with 1LFO, which showed relatively poor performance at 40 °C when dried at 100 °C (Fig. 7d), did show some increase in Fe loading with increasing cycle counts, showing 4.0 μg cm−2 of Fe on the graphite after around 685 cycles. Cells with VC-containing electrolytes, which showed the best cycle performance at 40 °C (2VC and 2VC+ 1DTD, Figs. 7b, 7e), showed no increase in Fe loading over 600+ cycles. Therefore, for these cells it must be concluded that Fe dissolution is not the cause of capacity fade at 40 °C. This was previously noted for VC-containing electrolytes in LFP/graphite cells 17,18 Next, looking at μXRF results for cells cycled at 55 °C in Fig. 11c, all cells show some degree of Fe dissolution after a number of cycles. The loading of Fe detected at 55 °C somewhat mirrored the capacity retention of cells in Fig. 8. Cells with 1LFO, which showed the most capacity loss of additive-containing cells at 55 °C also showed the most Fe dissolution of additive-containing cells in Fig. 11c. Similarly, cells with 2VC + 1DTD, which had the best performance at 55 °C showed a minimal amount of Fe dissolution, with only 1.9 μg cm−2 Fe detected after 700 cycles. These results showed that when appropriate electrolyte additives were used, Fe dissolution in LFP could be practically eliminated at high temperature.

Figure 11. Loading of Fe deposited on the graphite negative electrode as measured by μXRF. (a)–(c) Fe loading vs cycle number for LFP cells cycled at C/3:C/3 rate at temperatures of 20 °C, 40 °C, and 55 °C, respectively, for different additives. All cells in panels (a)–(c) were vacuum dried at 100 °C. (d), (e) Fe loading on the graphite negative electrode after cycling for ∼60 cycles at 40 °C and 55 °C, respectively. Results for different vacuum drying temperatures are shown for cells with different additive systems.
Download figure:
Standard image High-resolution imageμXRF measurements were also done on cells dried at 120 °C to consider the effect of water contamination on Fe dissolution from LFP. Figures 11d and 11e compare the Fe loading detected on the graphite electrode in cells cycled at 40 °C and 55 °C, respectively. Black bars indicate cells dried at 100 °C, and red bars indicate cells dried at 120 °C. All cells in Figs. 11d and 11e were cycled for approximately 60 cycles before disassembly. Different drying temperatures were not considered for cells cycling at 20 °C because Fe dissolution was much less severe at room temperature, as seen in Fig. 11a. At both 40 °C and 55 °C, removing excess water from LFP had an impact on the amount of Fe dissolution in cells with the control electrolyte. At 40 °C, the Fe loading on the negative electrode in cells with control electrolyte was reduced from 5.5 μg cm−2 when dried at 100 °C to only 0.2 μg cm−2 when dried at 120 °C. The effect was less dramatic at 55 °C, where the detected Fe loading was reduced from 2.2 μg cm−2 to 1.8 μg cm−2 when the higher drying temperature was used.
The trends were less clear with cells that contained additives. In all cases when electrolyte additives were used, the amount of Fe detected was much lower in cells containing additives whether or not there was water contamination in the cell. At 40 °C, only cells with the 2VC electrolyte saw less Fe on the anode at the higher drying temperature. Cells with 1LFO, 2VC + 1DTD, and 2FEC + 1LFO all had roughly the same Fe loading detected with 100 °C and 120 °C drying. At 55 °C there was a small reduction in Fe dissolution for the cells dried at 120 °C, but again the amount of Fe dissolution was much less than in cells with the control electrolyte. One point to reiterate is that these cells were in the early stages of cycling when they were disassembled for the μXRF measurement (∼60 cycles). It may take more time to begin to see more significant differences in Fe dissolution between cells with and without water contamination.
While significant Fe dissolution is detected in the cells with control electrolyte, it is still unlikely that Fe dissolution can be blamed entirely for the massive capacity fade that is observed. The performance of cells with control electrolyte was improved with the removal of water contamination, which also corresponded to a reduction in Fe dissolution, but the performance of these cells was still poor relative to cells with electrolyte additives. While the dissolution of Fe may contribute somewhat to capacity fade in these cells, it is likely Li inventory loss is the dominant capacity fade mechanism, as has been observed by other groups in LFP/graphite cells. 17,53
There appears to be two distinct regimes for the influence of water in LFP/graphite cells: one where the electrodes are poorly passivated (CTRL and 1LFO electrolytes), and another when the electrodes are sufficiently passivated (VC and FEC-containing electrolytes). In the case where the electrodes were not effectively passivated, excess water contamination led to Fe dissolution from LFP, and poor cycling performance was observed. On the other hand, when the electrodes were effectively passivated, the presence of water (up to 500 ppm) had little effect, and in some cases led to slightly improved performance under certain test conditions.
There has been some evidence in the literature that small amounts of intentionally added water could improve long-term performance of Li-ion cells, primarily with NMC-based chemistries. For example, Burns et al. found that intentionally adding 100 ppm of water to an NMC/graphite cell containing VC as an additive reduced coulombic inefficiency (CIE = 1−CE) and charge endpoint slippage compared to a VC-containing cell without added water, although the effects were minor. 33 Recall in Fig. 5 that charge endpoint capacity slippage was lower in cells dried at 100 °C, with the exception of the control electrolyte. Bernhard et al. showed that the addition of water to a carbonate electrolyte leads to an excess of H2 production on the initial formation cycle of a graphite electrode, which further leads to the production of CO2. 54 This can be seen in Fig. 2a where a large volume of gas was produced in the control electrolyte cell with water contamination on the formation cycle. This CO2 can then react to form lithium formate and lithium carbonate which can effectively passivate the graphite electrode against further electrolyte reduction. 55
Some of the benefit of adding water, intentional or otherwise, could come from the decomposition of the LiPF6 salt with water. LiPF6 is known to decompose in an equilibrium reaction

The decomposition product PF5 then can react with water

The POF3 can then further react with water to form PO2F2 − anions

It was shown by Stich et al. that the reaction between PF5 and water producing POF3 is a fast step, and that significant concentrations of HPO2F2 are detected in a carbonate electrolyte contaminated with 70 mmol l−1 of water 56 after only a few hours of storage. The addition of LiPO2F2 (LFO) has been shown in previous work to improve cell performance in NMC chemistries, 57,58 and in this work LFO improved capacity retention in LFP/graphite cells compared to the control electrolyte. It is therefore likely that cells dried at 100 °C with excess water contamination would have some concentration of PO2F2 − anions in the electrolyte after the wetting step and before the first formation cycle. The small amount of PO2F2 − anions could have a synergistic effect with other additives and help explain the slightly better performance of some cells dried at 100 °C. Further, the presence of higher concentrations of HF in the water-contaminated cells may lead to the formation of LiF on the graphite anode, which may further passivate against parasitic reactions. 59
Comparison of long-term performance with NMC/graphite cells and commercial LFP cells
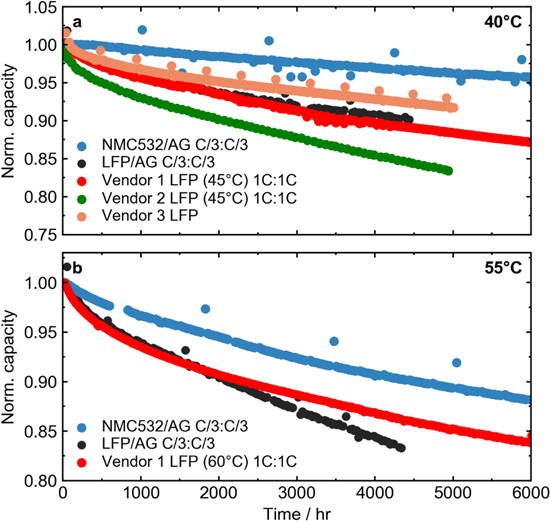
Recently, Harlow et al. demonstrated that exceptionally long lifetimes could be achieved in NMC532/graphite Li-ion cells if single crystal particle morphologies were used for the positive electrode and an appropriate electrolyte additive system was chosen. 35 It was estimated that in an electric vehicle application, these cells would last a total driven distance of 1, 200, 000 km before reaching 70% capacity when cycled at 40 °C in a worst-case scenario where every drive was of maximum range. The LFP/graphite cells used in this work had the same artificial graphite material as the NMC cells in Harlow et al., so the performance of these cells could be compared. One must realize that the cell designs differed appreciably with a positive electrode loading of 21.1 mg cm−2 (4.2 mAh cm−2) for the NMC532 cells in Harlow et al., while the positive electrode loading was 12.4 mg cm−2 (2.1 mAh cm−2) for the LFP cells studied here. This difference should favor the LFP cells.
Figure 12 compares the cycling performance of the LFP cells presented in this work (dried at 100 °C) with the NMC cells in Harlow et al. 35 Fig. 12a shows normalized capacity (cycle 5) vs cycle time for cycling at 40 °C, and Fig. 12b shows normalized capacity vs cycle time for cycling at 55 °C. Charge and discharge rates are indicated in the figure legend. Additionally, cycling results for commercial LFP from 3 vendors are shown. The additive system shown for the LFP/AG cells in this work and the NMC532/AG cells is 2VC + 1DTD (wt%), although the solvent blend is slightly different for the LFP and NMC cells (see Ref. 35). The electrolytes used in the commercial LFP cells were not specified.
Figure 12. Normalized capacity vs cycle time for cycling at (a) 40 °C (unless specified otherwise in the legend) and (b) 55 °C (unless specified otherwise in the legend) for the best LFP/AG cells studied in this work (dried at 100 °C), commercial LFP cells, and single crystal NMC532/AG cells (see Ref. 35 for more details). Charge and discharge rates for each cell is indicated in the legend of each panel.
Download figure:
Standard image High-resolution image
At both 40 °C and 55 °C, the NMC cells had much better capacity retention than all of the LFP cells shown. Differences in removing residual water from LFP, if any, were insignificant compared to the difference in capacity retention with NMC. It was shown above in Fig. 11 that Fe dissolution was virtually eliminated in LFP when the 2VC + 1DTD electrolyte was used, so degradation resulting from Fe dissolution cannot be blamed for the relatively poor performance of LFP. Figure 12 shows that the commercial LFP cells, being charged to 3.65 V, also perform worse than the NMC/graphite cells being charged to 4.3 V, indicating that even in cells optimized for commercial production, the high-temperature degradation of LFP is still a significant issue for this chemistry.
Likely culprits for the increased capacity loss in LFP compared to NMC cells are parasitic reactions leading to Li inventory loss and active material loss at the positive electrode. Alternatively, different crosstalk reactions between NMC/graphite and LFP/graphite could contribute to the difference in capacity fade between the two chemistries. Even though the average operating voltage of the LFP/graphite cells was considerably lower than in the NMC/graphite cells, the surface area of the LFP cathodes are very high (∼15 m2 g−1 vs ∼0.4 m2 g−1 for the NMC used in Ref. 35) which could increase the rate of parasitic reactions in LFP. The effect of surface area on the performance of LFP will be studied in a future publication. At this time, the main cause of high temperature degradation in LFP remains unknown (to us at least) and further study is required.
Conclusions
In this work, the effect of water contamination and different electrolyte additives on the performance of LFP/graphite cells was studied using a combination of long-term cycling tests, ultra-high precision coulometry (UHPC) experiments, and high temperature OCV storage. It was found that cells containing no electrolyte additives (control electrolyte) showed very poor performance, which could be improved if excess water was removed from the cell by vacuum drying at higher temperatures. That being said, performance of the control electrolyte was still poor even after removing water contamination, indicating poorly passivating SEI layers and Li inventory loss. On the other hand, cells containing electrolyte additives generally were not affected by ∼500 ppm of water in the cell. All cells containing additives greatly outperformed the control electrolyte in all tests, regardless of water contamination level. In some cases, including 40 °C UHPC measurements and 20 °C high rate cycling, cells containing water slightly outperformed cells where this excess water was removed.
μXRF measurements on disassembled graphite negative electrodes revealed significant Fe dissolution in cells containing control electrolyte at all cycling temperatures (20 °C, 40 °C, and 55 °C). Removing water contamination virtually eliminated Fe dissolution in the control electrolyte at 40 °C, and was reduced somewhat at 55 °C. Most electrolyte additives tested successfully suppressed Fe dissolution regardless of water content in the cell. These results suggested that parasitic reactions other than Fe dissolution are responsible for capacity fade in LFP cells containing electrolyte additives or when water contamination is removed.
Comparing cycling results with NMC/graphite cells with an identical graphite negative electrode showed that capacity fade is more severe in LFP at elevated temperature. While the exact mechanism to explain the inferior performance of LFP is unclear at this time, it could be the result of greater Li inventory loss in the LFP cells possibly caused by cross-talk reactions involving the high surface area LFP. The origin of capacity fade in LFP/graphite chemistries at elevated temperature will be studied further and in more detail in future work.
Acknowledgments
This work was funded under the auspices of the NSERC/Tesla Canada IRC program. ERL and AE thank NSERC and The Nova Scotia Graduate Scholarship program for scholarship support.