
Abstract
Possible effects of sulfur on solid oxide fuel cell (SOFC) Ni anodes have been analyzed from the thermodynamic considerations of Ni–S–C–O–H systems by constructing the predominant area diagrams as the Ellingham diagram (oxygen potential vs temperature plot) with a parameter of partial pressure ( or
or  ) of sulfur-containing gaseous species such as
  . Focus was made on the sulfur potential and its role on the sulfur adsorption on Ni, the sulfur dissolution into Ni, or the Ni sulfide formation, particularly on the eutectics formation. The important features of sulfur poisoning have been extracted and discussed as follows: (i) Under equilibrated conditions with 1–100 ppm contamination of
  around 1073 K, Ni anodes are stable against sulfide formation up to a high utilization such as 90%. (ii) When the anode overpotential is strongly related to the change in oxygen potential in the vicinity of three-phase boundaries (TPBs), Ni can be sulfurized; in worse cases, Ni–S eutectic liquids can be formed. (iii) Several factors that can lead to serious damages are discussed in terms of diffusion of sulfur inside nickel, enhancement accumulation of sulfur at TPBs due to the electrochemical oxidation of
  , and enrichment of sulfur in the lower temperature region in stacks.
Export citation and abstract BibTeX RIS
Effects of sulfur gaseous species on Ni anode performance have been well recognized.1–14 For example, Westinghouse Power Corp. (later Siemens Westinghouse Power Generation or more recently Siemens Power Generation Corp.) investigated the effect of  at concentrations of 1 ppm to several tens of parts per million in hydrogen fuels.1 Sulzer Hexis (later Hexis) also examined the effects of sulfur content in natural gases and reported their preference for high temperature operation to avoid sulfur poisoning.3 Typical effects can be summarized as follows:
- (1)At low concentrations and at high temperatures, anode performance is lowered promptly just after switching to fuel containing
 . In many cases, this lowered performance is maintained without further degradation. After switching back to the hydrogen fuel without sulfur, the anode performance recovered slowly to the initial value. It takes typically 250 h in Christiansen's experience at with fuel utilization of 75% ranging from 2 to 100 ppm in hydrogen fuels.4
- (2)At higher concentrations or at lower temperatures, effects are irreversible and some irreversible damages occur. These damages tend to appear more frequently and more significantly in carbonaceous fuels compared with hydrogen fuels.5 Some effects of incomplete reforming of methane have been observed.15
- (3)
- (4)Sulfur effects on solid oxide fuel cell (SOFC) stack performance6 are much more complicated than those on button cells.


These investigations on the effects of a sulfur compound  on the anode have been focused mainly on hydrogen or methane fuels with/without reforming.
During our own experiments on Ni–ScSZ cermet anodes with higher hydrocarbon fuels, we observed an anomalous sintering of nickel probably because of the sulfur remaining even after desulfurization of kerosene;16–20 similar sintering of nickels has been directly observed recently as a result of the nickel–sulfur interaction.21 In addition, it has also been found recently that anodes in real SOFC stacks are rather highly contaminated with sulfur even for cases where no sulfur-containing fuels are used.22 Thus, we have decided to make detailed thermodynamic analyses of the interactions of sulfur with the Ni anode and hopefully on possible mechanisms for sulfur accumulation around the three-phase boundaries (TPBs) or for enhanced sintering in nickel in the presence of sulfur. The following are the main purposes:
- (1)To provide the equilibrium properties associated with sulfur content in the SOFC fuels, particularly on the dominant species as well as the sulfur potential represented by the partial pressure of. The latter information is essential in the electrochemical environment; it is reasonably expected that at the electrochemically active sites, electrode/electrolyte materials are equilibrated with gaseous species involved with the electrochemical reactions. Actual electrochemical reactions for hydrocarbon fuels are mainly the electrochemical oxidation of to in combination with the water shift reaction or the electrochemical oxidation of CO to . Because the and systems are not necessarily in equilibrium, analyses are made not only on the or systems but also on the system.
- (2)To correlate those equilibrium properties with the chemical forms of Ni; that is, the Ni–S binary phase relations are rearranged in terms of the characteristic thermodynamic variables for SOFC operations, namely, temperature, oxygen potential, and electrical voltage. To correlate the Ni–S interaction with oxygen potential, we need to know the equilibrium behavior in the Ni–S–O–H or Ni–S–O–C systems. By using the sulfur potential, it becomes possible to consider the adsorption of sulfur on nickel and the dissolution of sulfur inside nickel at the same time with the aid of those experimental data that have been well evaluated as a function of or sulfur potential.14
- (3)To provide the basis of considering effects of SOFC operation variables such as anodic overpotential, fuel composition, and fuel utilization; here, the oxygen potential in relation to sulfur potential becomes crucial.
- (4)Finally, to combine those equilibrium properties with a proposed anode reaction mechanism within the local equilibrium approximation. In this reaction model, adsorped species are characterized in terms of the local chemical potential at adsorped sites, and the solid materials such as electrode and electrolyte materials are assumed to be locally equilibrated at respective points not only on the surface but also inside solids; this model is essentially the same as Wagner's electrochemical model for corrosion. This makes it possible to treat the mass flow on the surface as well as inside solid materials. At the electrochemical reaction sites, the equilibrium can be established including the gaseous species involved in the electrochemical reaction. At other places on the surface, the equilibrium is not necessarily established between gases and solids. The distribution of the elemental chemical potentials around the reaction sites is thus strongly affected by the electrode reaction mechanism, electrode activity, current density, and other electrochemical characteristic features. When the electrode activity is degraded, there is a corresponding change in the distribution of elemental chemical potentials. On the basis of this model, an analysis can be made on the effect of the microstructure with the aid of the surface energy affecting the deposition condition, the effect of the oxide component in the cermet anodes in its relation to the oxygen potential distribution in the TPB vicinity, and a possible mechanism for sulfur to be accumulated in the TPB area with focus on diffusion in solid nickels.


Some thermodynamic investigations8, 12, 23 have already been made for sulfur poisoning on Ni anodes; thus, the present calculations are focused mainly on the thermodynamic conditions of the appearance of Ni–S eutectics and on the solubility of oxygen, hydrogen, and sulfur in Ni metal; for sulfur, a comparison is made with the available experimental information on the adsorption. For the interpretation of observed sulfur poisoning, the irreversible process such as accumulation of sulfur at TPBs is discussed in the present investigation.
Thermodynamic Calculations and Associated Data
Calculation methods
The present construction of the chemical potential diagrams and chemical equilibrium calculations were made with the MALT/CHD/gem software package.24–26 Some diagrams were constructed with CHD program25 partly modified by one of the authors. This program is based on the polyhedron approach to constructing the generalized chemical potential diagram for multicomponent systems. This makes it possible to construct the generalized Ellingham diagram for multicomponent systems having solution phases.27 The Ellingham diagram for binary systems such as the Ni–O system is convenient for understanding the stabilities of the respective phases.28 This diagram can be regarded as the chemical potential diagram plotted in  vs
vs  . This type of diagram can also be extended to higher order systems by adopting the same approach as the generalized chemical potential diagrams for the multicomponent system; namely, the utilization of the third axis is powerful for displaying the complicated phase relations, and fixation of the chemical potential of selected species at a given value is another way of handling the multicomponent system.27
In the electrochemical potential diagram, namely, the Pourbaix diagram29 for the multicomponent system, an interesting approach has been adopted to display only the phase relations associated with the selected redox element.30 For example, the Pourbaix diagram for the  system31 is constructed to display the stabilities of the only Fe-containing species/compound; namely, those species in the
  subsystem are not explicitly shown. The construction of such diagrams is made by an algorithm, including the selection of redox element.
No such selection of redox element is made in constructing the generalized chemical potential diagrams to be utilized in the present investigation.27, 31 However, the same type of diagrams can be constructed using the generalized chemical potential diagrams as follows:
- (1)First, the generalized chemical potential diagram is constructed as the three-dimensional diagram. For the system, can be adopted as the third axis.
- (2)In this three-dimensional diagram, the sulfur-containing species appear in the higher side of the third axis; those stability areas belonging to the sulfur-containing species can be made transparent and essentially eliminated from the diagram.
- (3)When the third axis is ignored, the aimed Pourbaix diagram can be constructed as a two-dimensional chemical potential diagram.


In the present investigation, this technique was adopted frequently to construct the proper diagrams appropriate for the present purpose.
Thermodynamic data
The thermodynamic data for major compounds and gaseous species in the Ni–S–O–H–C system were taken from the main database of the thermodynamic database MALT for Windows.24
In the present investigations, focus was placed on the eutectic formation and the solubility of O, C, H, and S in solid Ni metals. These mixtures were represented in the ideal association solution model; if necessary, hypothetic constituents were introduced, and their thermodynamic properties were determined so as to reproduce the binary phase diagrams for the Ni–X ( ,32, 33 S,34–37 C,38 H 39–41) systems. Fitting was made by a trial-and-error method of determining data listed in Table I: enthalpy change for formation, entropy, heat capacity coefficients, and transition information (temperature and enthalpy) for respective states.
Table I. Thermodynamic properties of components of ideal association solutions used in the present investigation:  , the enthalpy change for formation;
  , entropy at 298 K;
  ,
,  ,
,  ,
,  , and
, and  coefficients of heat capacity equation,
  ;
;  , temperature limit of equation; and
  , enthalpy change to next equation.
| Mixture | State |
 kJ/mol kJ/mol |
 J/K mol J/K mol |

|

|

|

|

|

|

| Ref. |
|---|---|---|---|---|---|---|---|---|---|---|---|
| Ni solid solution | |||||||||||
| Ni | c1 | 0.0 | 0.0 | 49.41 | −80.92 | −7.28 | 100 | 0 | 631 | 0.092 | 22 |
| c2 | 20.42 | 10.13 | 16.07 | 0 | 0 | 1728 | 17.15 | 22 | |||
| 1 | 38.91 | 0 | 0 | 0 | 0 | 22 | |||||
| NiS in Ni | ss | −10.4 | 85.92 | 58 | 5 | −10 | 0 | 0 |
| ||
| NiO in Ni | ss | −185.7 | 15.79 | 50.65 | 8.73 | −3.08 | 0 | 0 |
| ||
| NiH in Ni | ss | 17.577 | 53.87 | 32 | 25 | −25 | 0 | 0 |
| ||
| NiC in Ni | ss | 54 | 38.87 | 39 | 14.5 | 0 | 0 | 0 |
| ||
| Ni–S–C–O liquid | |||||||||||
| Ni | c1 | 0.0 | 0.0 | 49.41 | −80.92 | −7.28 | 100 | 0 | 631 | 0.092 | 22 |
| c2 | 20.42 | 10.13 | 16.07 | 0 | 0 | 1728 | 17.15 | 22 | |||
| 1 | 38.91 | 0 | 0 | 0 | 0 | 22 | |||||

| L | −70.93 | 99.124 | 49.41 | −80.92 | −7.28 | 100 | 0 |
| ||
| NiS | c | −94.1 | 52.97 | 44.69 | 19.04 | −2.89 | 0 | 0 | 652 | 64.4 | 22 |
| 1 | 38.91 |
| |||||||||

| S | −133.0 | 78 | 64.44 | 20.75 | 2000 | 65.7 | 22 | |||
| L | 91 |
| |||||||||
| NiC | 71.93 | 55 | 55 | 0 | 0 | 0 | 0 |
| |||

| S | −872.91 | 92 | 125.9 | 41.51 | 1306 | 32.8 | 22 | |||
| L | 180 |
| |||||||||
Because the Ni–S subsystem has eutectics, this was taken into account by treating the Ni–S liquid solution as the ideal association solution among Ni(l),  , NiS(l), and
  , as given in Table I, although more sophisticated models have been applied to the Ni–S system by several authors. Because the present investigation focuses on a low sulfur content region, liquid sulfur was treated as an individual liquid that was assumed to coexist with the Ni–S solutions. For other binary systems, simple hypothetical constituents were assumed, as shown in Table I. In multicomponent liquids, no further complicated constituents were considered.
Solid solutions of nickel with S, C, O, and H were also treated as the ideal association solution in which NiS, NiO, NiH, and NiC were considered as hypothetical constituents in solid solutions. Their data are also presented in Table I; these thermodynamic data of hypothetical constituents were determined so as to reproduce the solid solubility and solid liquid equilibria reported in the literature.32–41
Sulfur in Anode Compartment
Dominant sulfur-containing species in S–O–H and S–O–C systems
Because the present investigation is focused on the sulfur behavior in fuels such as  or CO, we utilized the generalized Ellingham diagram for the S–O–H and S–O–C systems, in which gases were included as species having a selected partial pressure.
Figure 1 shows the three-dimensional chemical potential diagram for the S–O–H system. In Fig. 1, the most dominant species in the gaseous phase are plotted in the three-dimensional  diagram; the partial pressure of gaseous species belonging to the H–O subsystem (
 ,
,  , and
, and  ) is specified at 1 atm, whereas those gaseous species containing sulfur atoms are given at selected values (1 atm in Fig. 1c and
  in Fig. 1a and 1b). In any plot, the three-dimensional diagram consists of polyhedrons for sulfur-containing species and polygons for
  ,
,  , and
, and  . In Fig. 1b and 1c, those polygons for
  ,
,  , and
, and  are set as transparent in such a way where only sulfur-containing species are visible. This transparency corresponds to the treatment in the multicomponent Pourbaix diagram, as described in the previous section.
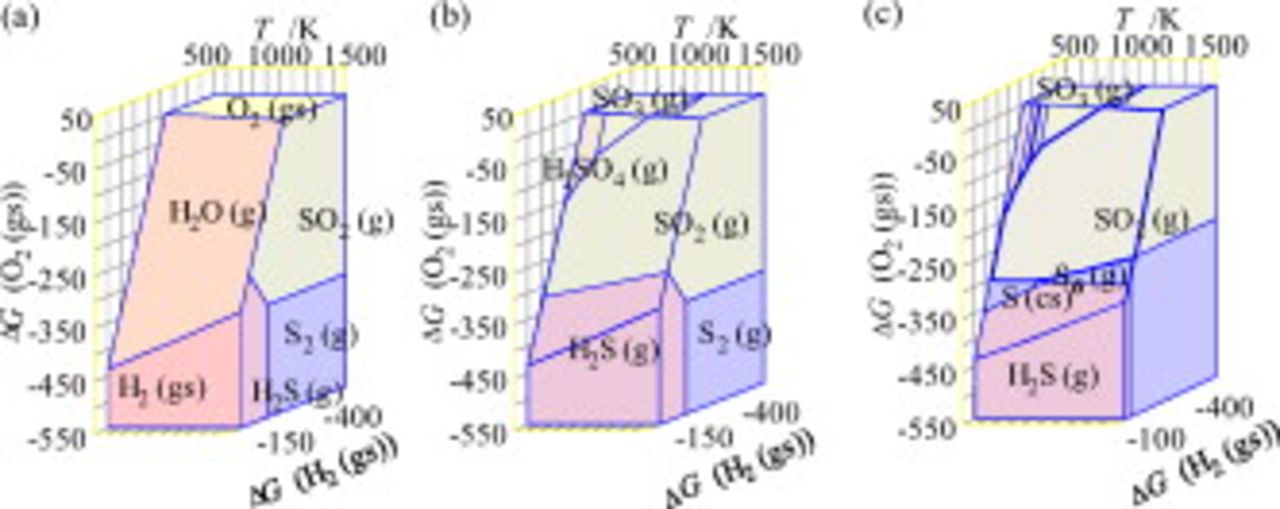
Figure 1. Three-dimensional chemical potential diagram for the S–O–H system plotted as functions of  ,
,  , and
, and  . The dominant sulfur species are shown as stability polyhedrons. (a) A diagram for gaseous species at
  , (b) the same diagram as (a) but with transparent regions for
  ,
,  , and
, and  , and (c) a diagram with gaseous species specified at
  .
.
In Fig. 2, the predominant areas for the sulfur-containing species/compounds are displayed in two-dimensional diagrams; Fig. 2a corresponds to those given in Fig. 1b and 1c. These predominant areas of the sulfur-containing species are adjacent with those for  ,
,  , or
, or  at 1 atm; therefore, the phase relations given in Fig. 2a are those in equilibrium with
  (1 atm) in the lower part of the figure or
  (1 atm) in the upper part; the borderline for the two conditions shown by the dashed line in the figure,
  , is also given inside the dominant area of
  in Fig. 2a.
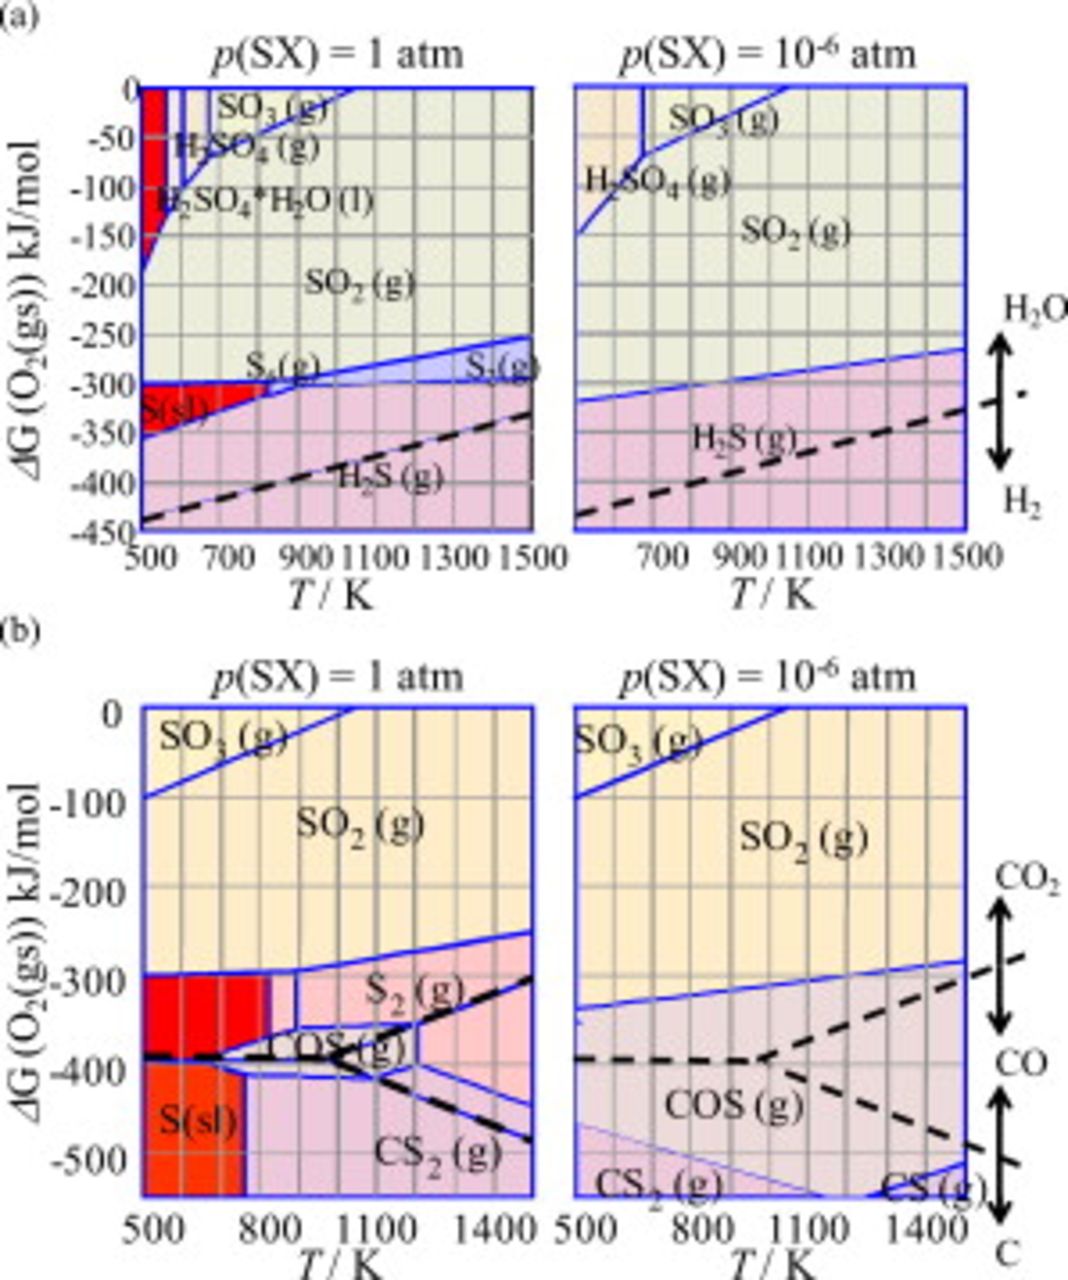
Figure 2. Predominant area diagrams for (a) the S–O–H and (b) S–O–C systems plotted as a  vs
vs  plot. The borderline between
  appears in (a), whereas three borderlines corresponding to
  , CO(g)/C, and
  appear in (b) without explicit indication. These border lines are shown by dashed lines.
In Fig. 2a for  , the species of
  has the dominant region at the oxidative atmosphere, whereas
  ,
,  , and S (condensed phase) appear in a reducing atmosphere, and
  gas becomes dominant in the hydrogen-rich atmosphere. When the impurity level of sulfur is reduced to an order of
  , the appearance of species becomes different; that is, species such as
  ,
,  , and S(condensed phase) disappear. At low sulfur concentrations, the borderline between the
  dominant and
  dominant areas becomes important. This line is represented by the following chemical reaction

In this reaction,  is contributed to the reaction instead of
  because this borderline is within the
  dominant region. As a result, the oxygen potential value for this borderline does not depend on a selected partial pressure of SX (
 and
and  ) because
  is always in unity on the borderline.
In Fig. 2b, the corresponding diagrams for the C–S–O system are displayed. Phase relations become complicated because the C–O subsystem has three predominant areas for C, CO, and  , which have a corner around
  and
and  . As sulfur-containing species,
  ,
,  , S(condensed phase),
  , COS(g), CS(g), and
  appear as dominant. When compared with the S–O–H system, the wider ranges of S(condensed phase) and
  are due to the fact that the stability of COS or
  is not significant compared with
  . For
. For  , the COS predominant area is extended in a similar manner to that for
  in the S–O–H system. However, a difference can be seen in the location of the borderline between
  and COS corresponding to the following reaction

This borderline is located in the more reductive side than the  borderline in Fig. 2a.
Sulfur potential in fuels
As described above, the sulfur potential is a key property in the present analysis. Because the chemical potential diagram is a projection of phase relations on selected chemical potential values (or intensive variables), it is possible to construct those diagrams that explicitly utilize the sulfur potential as the diagram axis variable. In Fig. 1, the sulfur potential is not used just because the Ellingham-diagram-type variables are already adopted in this investigation. Instead, chemical equilibrium calculations were made to explicitly show the partial pressure of  as a function of oxygen potential. Calculations were made on the S–O–H–C system in which a total amount of sulfur is limited to be
  in 1 mol of fuels (
 ,
,  , and C) at
  and
and  . Results are shown in Fig. 3, in which mole numbers of only those sulfur-containing species are plotted as a function of oxygen partial pressure, and the mole number of
  , which is indicated as solid squares, is roughly equal to the logarithmic partial pressure of
  because the initial mole of the fuel is set at 1 mol.
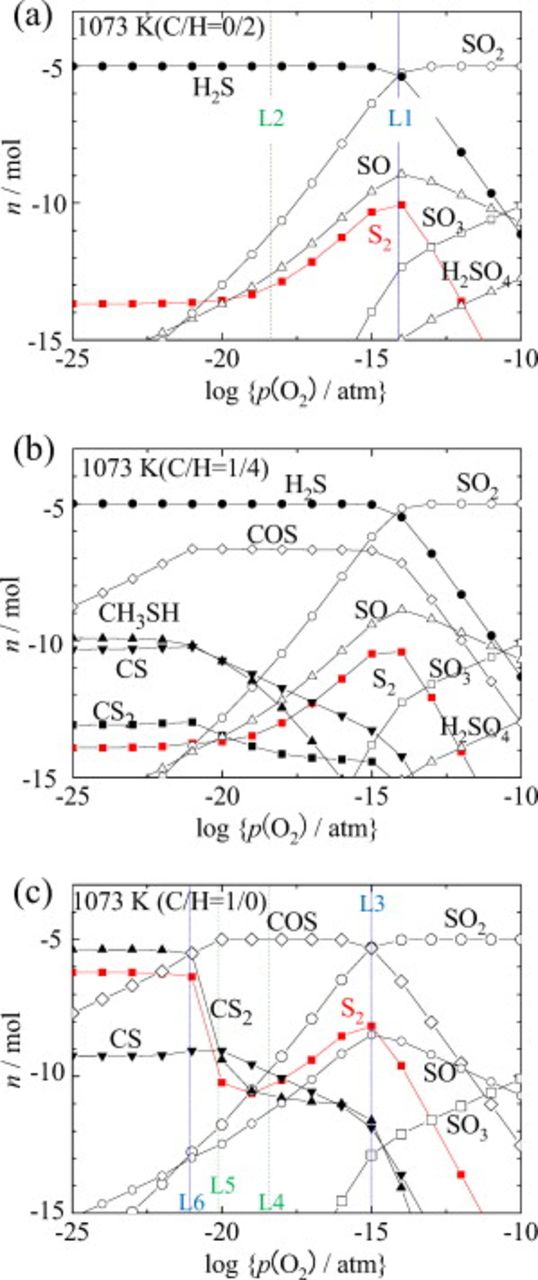
Figure 3. Chemical equilibrium calculation results for the S–O–H–C system in which total sulfur content is selected as  against the total mole of fuel (
 ,
,  , and C). (a) Hydrogen fuel
  , (b) methane fuel
  , and (c) carbon at 1073 K.
For hydrogen fuel, the dominant species changes from  in the reducing side to
  in the oxidative side. This is essentially the same as Fig. 1b and 2a, although
  is assumed in those diagrams. However, the amount of
  has a maximum in the same oxygen potential region as that appearing as the
  -dominant area in Fig. 1c and 2a. The borderline between
  and
and  is shown as line 1 (L1) at
  in Fig. 3a, whereas the borderline between
  and
and  is given as line 2 (L2) at
  .
.
For carbon fuel shown in Fig. 3c, the sulfur-containing dominant species changes from  via COS(g) to
  . Again, the
  species does not appear as the dominant species in Fig. 3c. In Fig. 2b, the oxygen potential width for the
  area at
  is larger in the S–O–C system than in the S–O–H system. Correspondingly, a maximum amount of
  on the
  borderline in Fig. 3c is higher than that in the S–O–H system in Fig. 3a. This borderline shown as line 3 (L3) at
  is about 1 order of magnitude lower than that for line 1 (L1) in Fig. 3a. In the COS dominant area, the carbon dominant chemical form changes from
  to CO and C(graphite). Their borderlines are given as line 4 (L4) at
  and line 5 (L5) at
  . About the
  amount, there appears one interesting feature in the S–O–C system; that is, the amount of
  again increases with decreasing oxygen potential down to the region where
  becomes dominant. Because the
  -dominant area in Fig. 2b is within the C-dominant region in the C–O binary system, the
  partial pressure becomes constant through the following reaction

where  has the fixed partial pressure and carbon activity is also fixed at unity. Because the results of Fig. 3c were obtained at a total pressure
  under a selected oxygen potential,
  becomes dominant around line 6 (L6) at
  and corresponds to a gaseous mixture consisting of 2/3 of COS and 1/3 of
  .
.
Figure 3b shows the sulfur-containing species for the case where  is used as fuel. When compared with Fig. 3a and 3c, the interesting features can be seen as follows:
- (1) shows higher stability compared with COS(g) and and therefore becomes dominant even in hydrocarbon fuels. The percentage of COS(g) is about 2% in maximum. The concentration of is extremely small.
- (2)Because is dominant, the borderline oxygen potential from to is about the same as that for hydrogen. Furthermore, the peculiar behavior in the carbon stable region of the sulfur potential in the S–O–C system shown in Fig. 3c [at lower than L6] disappears in the hydrocarbon system.
- (3)In the SOFC anode chamber, therefore, the partial pressure of is a good measure to make further considerations on thermodynamic equilibria associated with sulfur poisoning. Even so, when the sulfur potential becomes crucial, care must be exercised because the sulfur potential changes rather sensitively to the behavior of other substances, although the major form of sulfur is always . This is particularly true for the Ni–S interaction, as seen below.


Thermodynamic Considerations on Nickel Sulfur Interaction
Binary Ni–S system
The chemical potential diagrams were constructed for the Ni–S system and are displayed in Fig. 4. The same phase relations are plotted as the Ellingham diagram in Fig. 4a and also as the Arrhenius-type diagram in Fig. 4b.
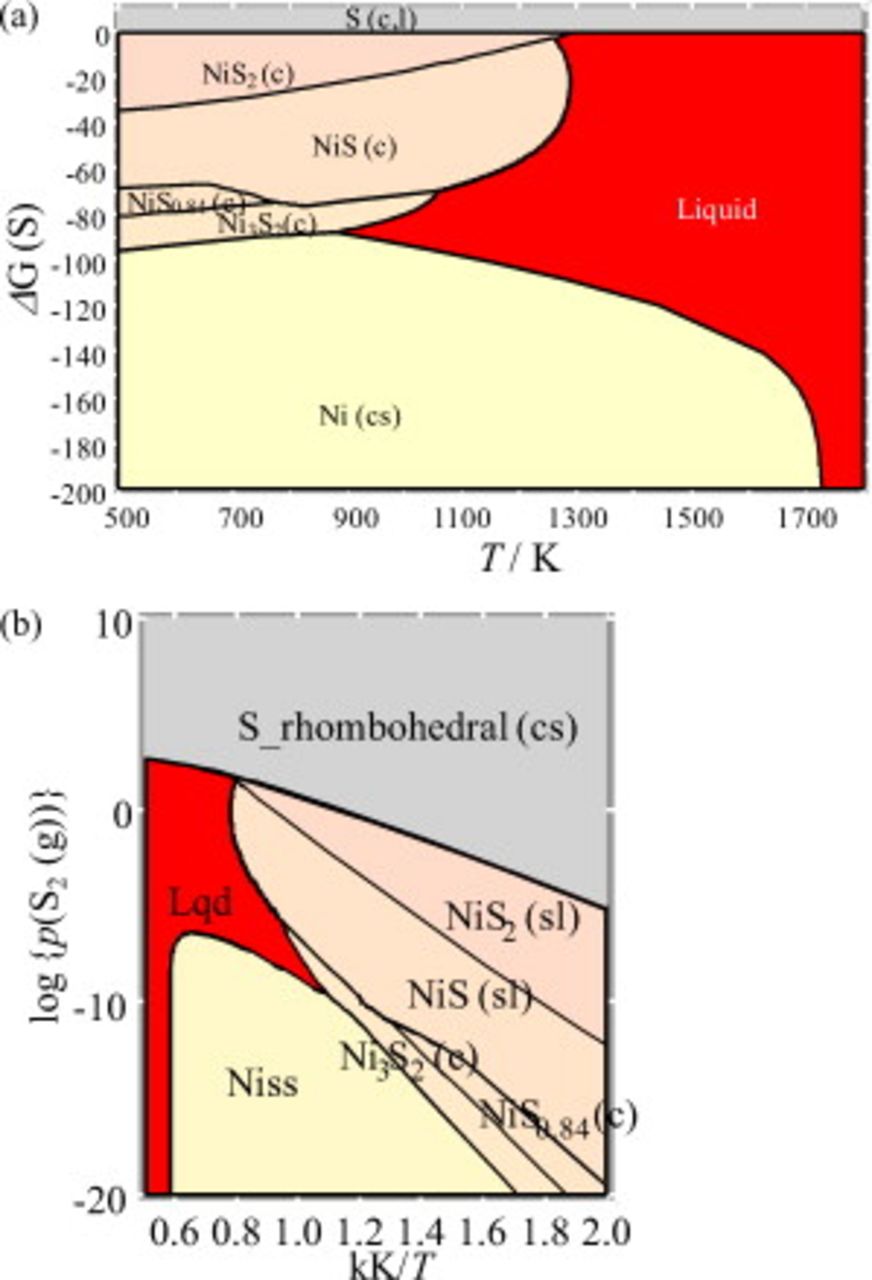
Figure 4. Chemical potential diagrams for the Ni–S system. (a) Ellingham diagram in  vs
vs  plot and (b) Arrhenius-type diagram in
  vs
vs  plot.
plot.
The most important feature in the Ni–S system is that the lowering melting temperature due to the eutectic formation is quite significant in the Ni–NiS subsystem.34, 35 Another important feature associated with such eutectics is that with changing temperature under a constant sulfur partial pressure in Fig. 4b, the liquid eutectics appear in between solid metal and solid metal sulfide. This feature plays an important role in considering the nickel sulfur interaction in the SOFC anode environment.
Equilibria in the Ni–S–O(–C–H) system
Chemical potential diagram at selected temperatures
Phase equilibria in the Ni–S–O system have been investigated well in terms of chemical potential diagrams such as a  vs
vs  plot8, 23 because this system is very important in hot corrosion science since the 1970s.42–44 In addition, the above consideration on the concentration of sulfur impurities in fuels makes it clear that in the anode environment, the partial pressure of
  becomes a key, as indicated in Fig. 3. This suggests that the variable of
  should be included in the chemical potential diagrams for the Ni–S–H–O or Ni–C–S–O–H systems; there can be several ways of constructing two-dimensional diagrams for such multicomponent systems. For example, Sasaki et al. adopted the condition of
  .8 Another method is to draw the isoactivity (isopartial pressure) lines corresponding to the selected partial pressures of
  and
and  .43 Here, such diagrams are displayed in Fig. 5. In the Ni–C–S–O–H system, two chemical potentials have to be fixed at selected values to draw a two-dimensional diagram. Here,
  and
and  are adopted; these conditions correspond to the anode atmosphere at a rather high fuel utilization. As indicated in Fig. 5, nickel exhibits a complicated liquid formation; at 1073 K, the Ni–S eutectics appear between Ni and
  and another eutectic appears between NiS and
  , whereas at 1273 K, the Ni–S eutectics extend to more wider composition regions and combined with others. The isopartial pressure lines for
  (dotted lines in Fig. 5) are straight and increase with increasing oxygen potential, whereas the isopartial pressure lines for
  (dashed lines in Fig. 5) decreases with increasing oxygen potential. As a result, those redox points, where the partial pressures of
  and
and  become equal to each other, have the maximum sulfur potential. During the fuel cell operation with fuel at a constant
  concentration, the sulfur potential increases with increasing fuel utilization. This indicates that the partial pressure of
  is determined using given partial pressures of
  and
and  as follows

Because the sulfur content in the anode environment is characterized in terms of a constant  partial pressure, Fig. 5 strongly suggests that the sulfurization of Ni can take place in the more oxidative side. The minimum partial pressure of
  corresponding to the sulfurization of Ni can be seen around
  at 1073 K. In Fig. 5c, corresponding isopartial pressure lines for COS in the Ni–S–O–C system at
  are given; in this case, the minimum partial pressure of COS corresponding to the sulfurization of Ni can be seen around
  at 1073 K.
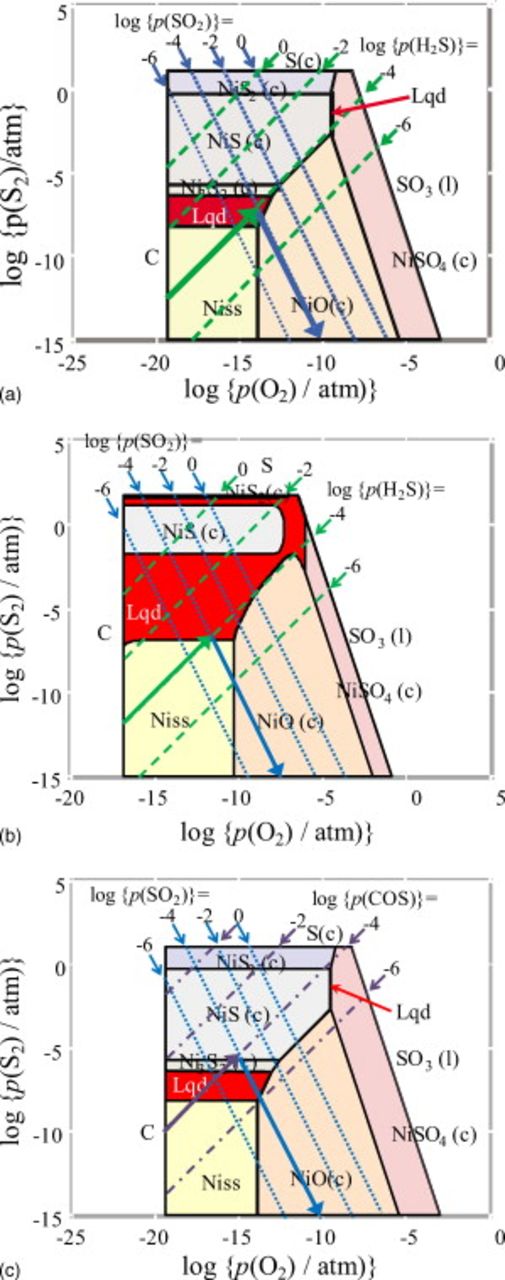
Figure 5. Two-dimensional chemical potential diagram [ vs
vs  ] for the Ni–S–O–C–H system under the condition of
  and
and  at (a) 1073 and (b) 1273 K. The isopartial pressure lines for
  and
and  are given for
  , −4, −2, 0 and for
  , −4, −2, 0. (c) Two-dimensional chemical potential diagram for the Ni–S–O–C system under the condition of
  at 1073 K. The isopartial pressure lines for COS and
  are given for
  , −4, −2, 0 and for
  , −4, −2, 0. Bold arrows show the isopartial pressure change for
  and
and  at
at  with increasing
  . Dotted line:
  . Dashed line:
  . Dashed-dotted line: COS.
Temperature dependence of sulfurization equilibria
Temperature dependence of the above phase relations was obtained as follows: In the Ni–S–O–C–H system, the partial pressures of  and
and  are fixed at 0.50 and 0.25 atm, respectively, in the same manner. Then, the chemical potential diagram of a
  vs
vs  type was constructed with a parameter of the partial pressure of SX (
 or
or  ). Figure 6 shows the results for (a)
  and (b)
  . This diagram was constructed as follows: A three-dimensional diagram was constructed by including S-containing gaseous species at the selected partial pressure (
 or
or  ). In a similar manner to Fig. 1, the dominant areas of
  and
and  were made transparent; as a result, the chemical potential diagram, without explicit indication of
  and
and  , is shown in Fig. 6.
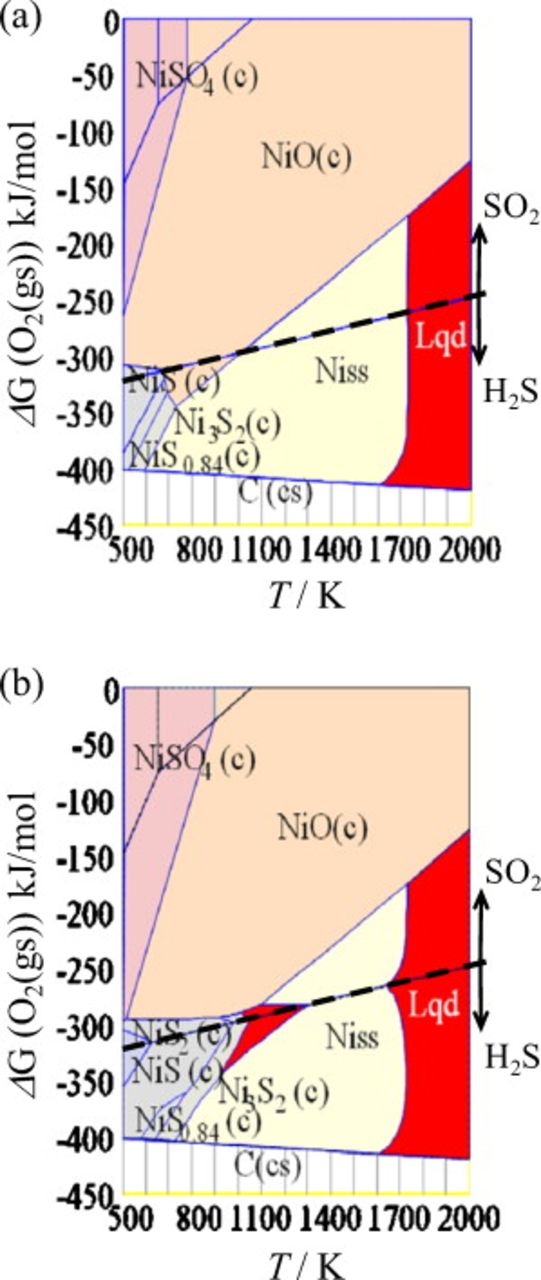
Figure 6. The Ellingham diagram for the Ni–S–C–O–H system under the conditions of  and
and  . This consists of two parts: The upper part is the
  dominant area, and the lower is the
  dominant area; the border lines are shown by dashed lines: (a)
  (
( or
or  ) and (b)
  . Liquid state appears not only around the melting temperature of nickel but also around the eutectic temperature of Ni–S system.
Figure 6a is based on the predominant species for sulfur compounds, which are given in Fig. 2; therefore, roughly speaking, this diagram indicates the most stable chemical form of Ni within the  dominant area or the
  dominant area. When compared with Fig. 5a and 5b, phase relations given in Fig. 6 correspond to those on the isopartial pressure lines for
  and
and  in Fig. 5. This clearly shows why the sulfur potential is high around the borderline between the
  dominant and
  dominant areas. Under these conditions, the sulfurization of Ni or NiO starts from the lower temperature side along the
  borderline. At
  , the sulfurization takes place below 700 K (see Fig. 6a). The eutectic liquid starts to be formed as a result of sulfurization above
  in the intermediate temperature region of 900–1100 K (see Fig. 5a). With increasing partial pressure of
  , the Ni–S eutectic stability area (formation area) is spread up to the higher temperature side. Sulfurization is most significant on the borderline between the
  dominant and
  dominant areas. Also, the stability area for eutectics is near the NiO/Ni borderline, and that is also in contact with the NiO stable area as well as the Ni stable area.
Solid solubility of sulfur and oxygen atoms in nickel as functions of temperature and oxygen partial pressure
The present thermodynamic considerations take into account the solid solubility of carbon, oxygen, hydrogen, and sulfur within the ideal association model. This makes it possible to calculate sulfur solubility as a function of temperature, oxygen partial pressure, or fuel utilization. In Fig. 7, calculation results are given as a function of fuel utilization or oxygen potential with a parameter of the partial pressure of  , namely,
  (1 ppm) and
  (100 ppm).
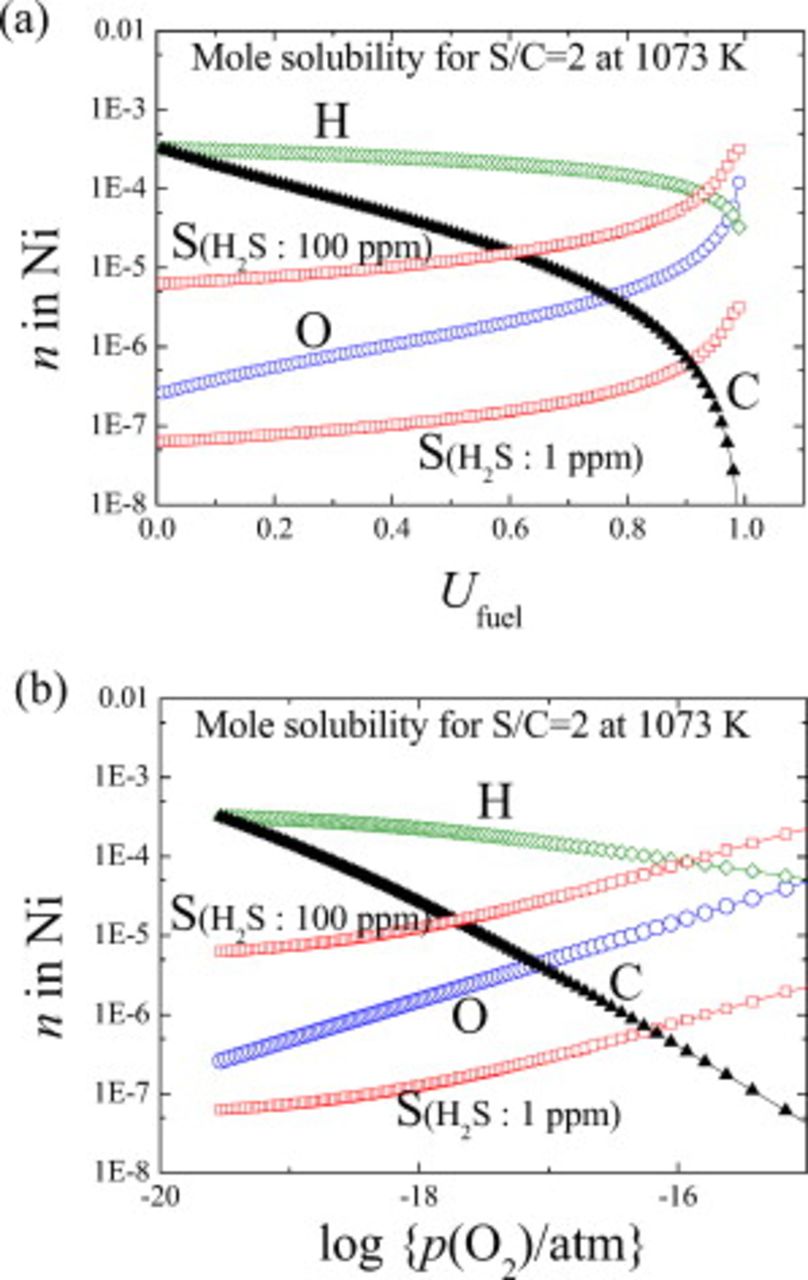
Figure 7. Solubility of sulfur, oxygen, carbon, and hydrogen in nickel at 1073 K as a function of (a) oxygen potential and fuel utilization in the hydrocarbon fuel (steam to carbon ratio is set at 2).
With increasing fuel utilization or oxygen potential, the sulfur solubility increases. This is by the same mechanism shown in Fig. 5 in which  increases with increasing
  under constant
  . For comparison, other elements such as hydrogen, carbon, and oxygen also increased, although these solubilities do not depend on the partial pressure of
  . Hydrogen concentration is rather high and insensitive to the fuel utilization, whereas carbon solubility decreases rapidly with fuel utilization. Oxygen solubility shows similar behaviors as sulfur.
The solubility of oxygen and sulfur is also shown in Fig. 8 as a function of temperature and oxygen potential, which should be compared with Fig. 6b for  . Oxygen solubility was experimentally determined along the Ni–NiO two-phase line;32, 33 although there is some discrepancy in temperature dependence between the chemical32 and electrochemical33 determination, the electrochemically determined values33 are adopted to be reproduced in the present thermodynamic modeling. Along this Ni–NiO two-phase line (bold line in Fig. 8), oxygen solubility decreases with decreasing temperature. However, in the
  vs
vs  plot, the isosolubility lines are rather flat, as shown in Fig. 8. Compared with oxygen, sulfur solubility shows stronger temperature dependence under a constant oxygen potential,
  , or a constant electrical potential referred to as
  ,
,  [referred to as
  ]
]  .
.
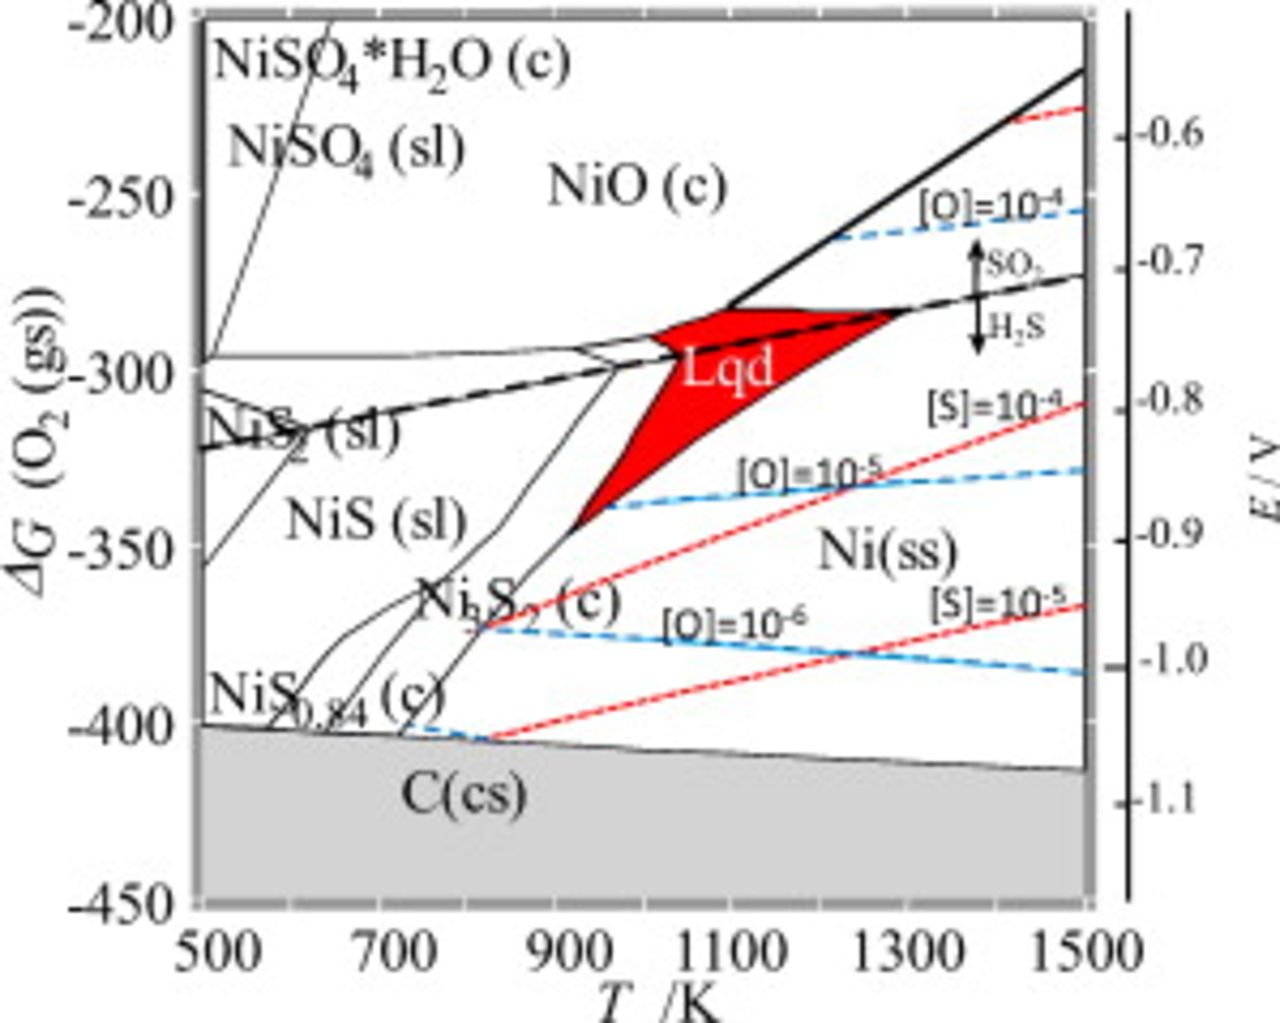
Figure 8. Solubility of sulfur and oxygen in nickel metals plotted as functions of temperature and oxygen potential in the Ellingham diagram, which consists of the upper  dominant and the lower
  dominant areas. The electrical potential given on the right side is referred to pure oxygen
  . Dashed line: Solubility of O in Ni. Dotted line: Solubility of S in Ni.
Sulfurization in the Ni–S–O–C system
The chemical equilibrium calculations given in Fig. 3c suggest that the sulfur potential as a function of oxygen potential may exhibit quite a different behavior between the H–O–S system and the C–O–S system. Here, the appearance of the Ni–S eutectics in the Ni–O–C–S system is considered. As shown in Fig. 2b, any point in the Ellingham diagram can be characterized in terms of the S-containing dominant species as well as the dominant regions for the C–O subsystem and, as a result, a stability diagram consists of many polygons and makes it complicated to draw the Ni–S interaction. Here, Fig. 9 is constructed as a combination of two three-dimensional diagrams; one is obtained by fixing at  with making the C-, CO-, and
  -dominant areas transparent, the other being
  ; the former corresponds to the lower part in Fig. 9, the latter being the upper part; a comparison between Fig. 8 and 9 indicates the following interesting features:
- (1)
- (2)Another important difference in the appearance of eutectics is the oxygen potential values. For carbon fuels, about 1 order of magnitude in the oxygen potential is shifted to the more reductive side because the dominant borderline in Fig. 9 lies at oxygen potentials 1 order of magnitude lower than that at the dominant borderline in Fig. 8, as suggested by the difference between L3 and L1 in Fig. 3.
- (3)The eutectics appear in the C-dominant region as well as in the-dominant region. This is mainly because there is a symmetrical change in the sulfur potential between the dominant region and the C(graphite) dominant region; the sulfur potential in both regions can be determined from the following reactions


These relations explain that the relation of the sulfur potential to the oxygen potential is completely inverse.
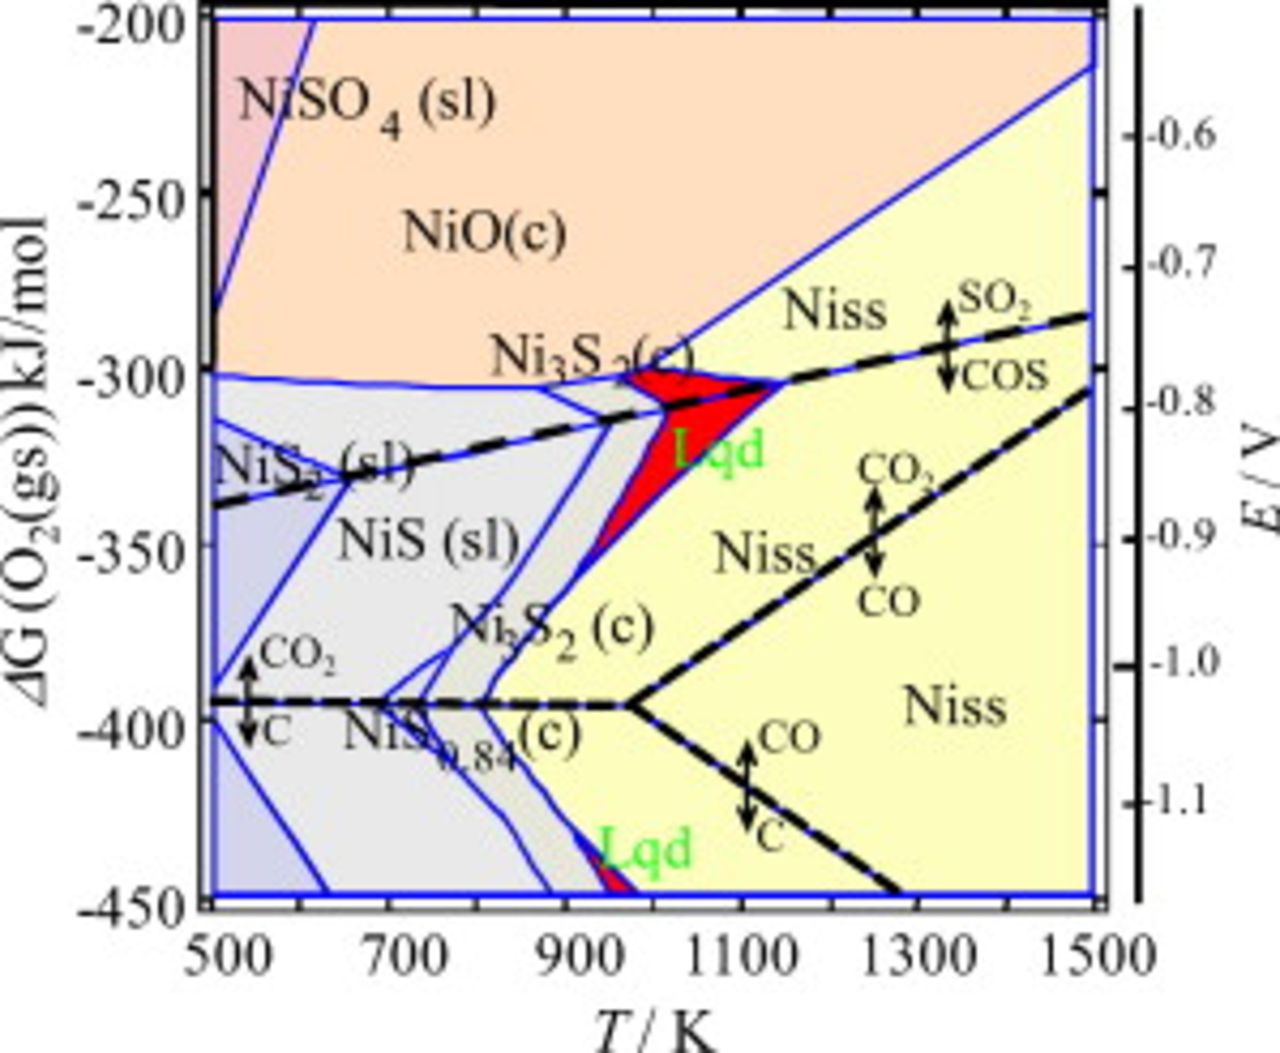
Figure 9. The Ellingham diagram for the Ni–S–O–C system consists of the upper  dominant and the lower COS dominant areas; the border line is shown by dashed line. In the COS dominant area, the dominant species for the C–O system are
  , CO, and graphite; the border lines are shown by dotted lines. The eutectic liquid appears even in the COS and graphite dominant area in addition to around the
  boundary in
  dominant region. The electrical potential given on the right side is referred to pure oxygen
  .
.
Sulfur adsorption on nickel surface
In the catalyst field, the adsorption of sulfur on nickel has been intensively investigated for a long time. Bartholomew et al.45 summarized the accumulated data in the  vs
vs  plot. More recently, Hansen14 attempted to represent the sulfur coverage on nickel with the Temkin-like isotherm. Here, in Fig. 10, his proposed data for
  and 0.6 are plotted and compared with the present phase equilibria, including the solid solubility of sulfur. Clearly, the coverage of sulfur on the nickel surface is large even with low
  , and its temperature dependence is quite steep; the coverage of sulfur becomes about 60% even though the
  concentration is only 1 ppb at 1000 K, and it increases quite steeply by decreasing temperature. In the same plot, the sulfur solubility36 exhibits inverse temperature dependence to that of the adsorption.
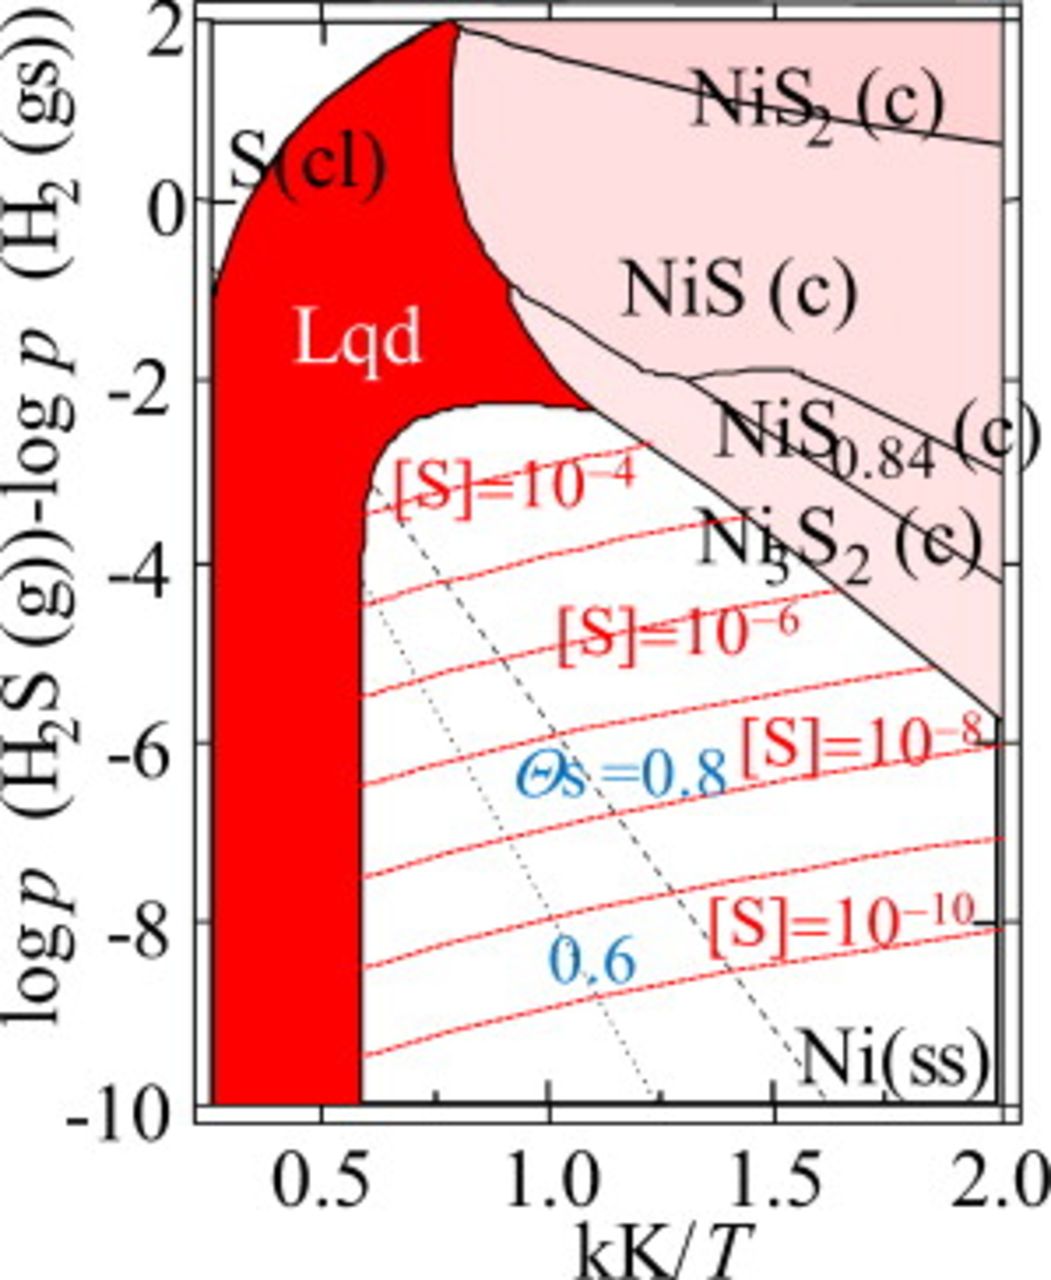
Figure 10. Chemisorption equilibria plotted in the chemical potential diagram for the Ni–S–H system,  vs
vs  plot. The present results on phase boundaries are the same as those in Fig. 4. Dotted and dashed lines for
  and 0.8, respectively, are isocoverage lines calculated from the equation given in literature.14
Ni–S equilibria as a function of fuel utilization
In a normal operation, the fuel utilization is limited at 70–90%. To examine the sulfurization equilibria at the same fuel utilization, the phase equilibria given in Fig. 8 are replotted as a function of  ; when this axis variable is equal to unity, this corresponds roughly to 90% fuel utilization. Figure 11 indicates that below 90% fuel utilization, sulfurization does not take place in the equilibrated state even for
  . Even so, in the electrochemical situation for the SOFC anode, there are several important nonequilibrium effects, such as overpotential, nonequilibrium between two
  and
and  fuel systems, and temperature distribution due to reforming reaction.
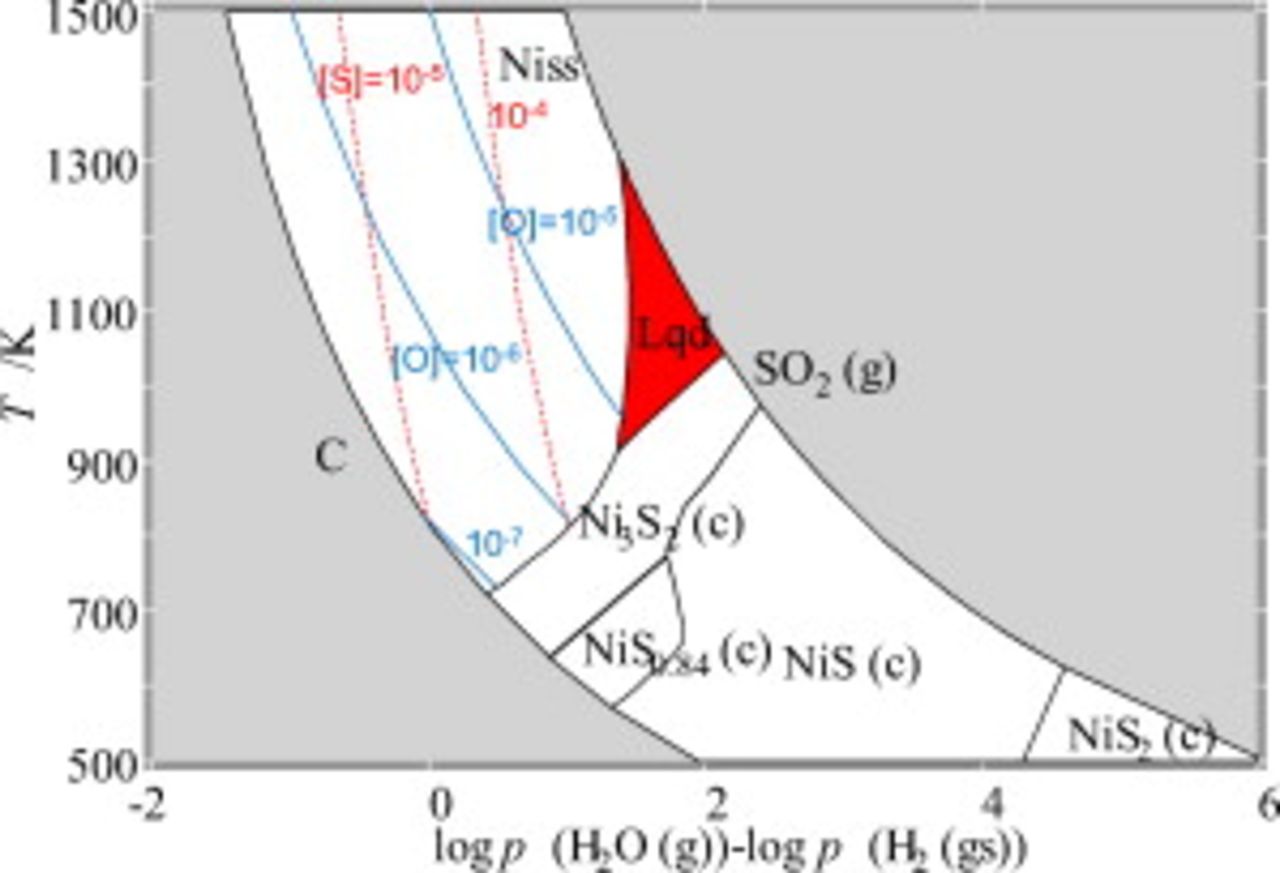
Figure 11. Solubility of sulfur and oxygen as functions of temperature and logarithmic partial pressure difference between  and
and  .
.
Ni–S Interaction under SOFC Operations
Ni cermet anode reaction mechanism
Before sulfur poisoning on the nickel anode is examined, the nickel anode reaction mechanism is described here in terms of the local equilibrium approximation for the elemental distributions in nickel and oxide [yttria-stabilized zirconia (YSZ), ScSZ, or doped ceria] in cermet anodes.
At the electrochemical reaction sites, the local equilibrium is established among the electrochemically active gaseous species and the electrode/electrolyte materials. Within the condensed materials including surfaces, we assume that the elemental chemical potentials are uniquely defined, and their change within the condensed materials is continuous. This is the same as the electrochemical treatment of high temperature corrosion proposed first by Wagner. Thus, the local equilibrium approximation makes it possible to treat the mass transfer through nickel metal or through the oxide component of cermet, although many other models of the anode reaction mechanisms46–48 consider only surface species. The present focus on mass transfer even inside solid materials is due to the following reasons:
- (1)
- (2)In our other experiments with the secondary-ion mass spectrometry technique,52–56 we observed a rather high concentration of dissolved oxygen atoms within a thin layer just below the nickel surface in addition to dissolved hydrogen or carbon atoms in the hydrocarbon fuel environment. The amount of such oxygen in nickel is enhanced under the anodic polarization55 so that we have a tentative working idea that such oxygen can contribute to the electrochemical reaction in such a way that the dissolved (or adsorbed) oxygen catalytically assists the formation of the electrochemically active hydrogen in/on nickel from hydrogen molecules.47 Such dissociated hydrogen atoms are electrochemically oxidized and emitted as water vapors at the reaction sites; such water vapors, in turn, provide oxygen atoms to be adsorped/dissolved at places other than the reaction sites.
- (3)In our electrochemical impedance analysis using hydrogen or higher hydrocarbon fuels with pelletlike disk cells with Ni–ScSZ cermet anodes, we recognized that the two observed semicircles both depend on water vapor pressure regardless of fuels (hydrogen or higher hydrocarbons).15 From this observation, the above anode reaction model can probably be applied to both hydrogen and hydrocarbon. Reforming processes57, 58 may proceed by reacting with such adsorped oxygens on nickel in a similar manner as the hydrogen dissociation process.
From the above considerations, we adopt the idea that the mass flow associated with the electrochemical reaction should be accompanied with the distribution of the chemical (or electrochemical) potentials of corresponding chemical species and therefore the elemental chemical potentials of involved elements.
Distribution of oxygen potential and associated flows of oxygen and hydrogen
Because the hydrogen formation process and the charge-transfer process both proceed in the vicinity of TPBs, a steep oxygen potential gradient corresponding to the overpotential is developed in the vicinity of TPBs. When the flow of oxide ions/oxygen atom is considered, the TPBs become the major reaction sites where almost all oxygen atoms pass through. This is schematically illustrated in Fig. 12a, where the oxide ion's flow in the electrolyte is given in terms of the electrochemical potential gradient. Correspondingly, hydrogen molecules are chemisorped on the nickel surface and dissociated hydrogen atoms go to TPBs to meet with the oxide ions and to evolve water vapors. The hydrogen potential in and on nickel should become a minimum, and the oxygen partial pressure in the gaseous phase should be a maximum in the TPB area. In Fig. 12a, the oxygen potential distribution is also given inside nickel; in Fig. 13, the distribution of chemical potential, coverage on nickel, and concentration of dissolved atoms inside nickel are shown schematically. A rather large gradient is due to the slow diffusion of oxygen atom in nickel. A more moderate distribution can be expected for the hydrogen potential in nickel because of the higher diffusion coefficient in bulk nickel; at 1273 K,  , whereas
  in Ni. Although the main hydrogen flux passes through a thin surface layer toward the TPBs, there can be some flux even inside Ni.
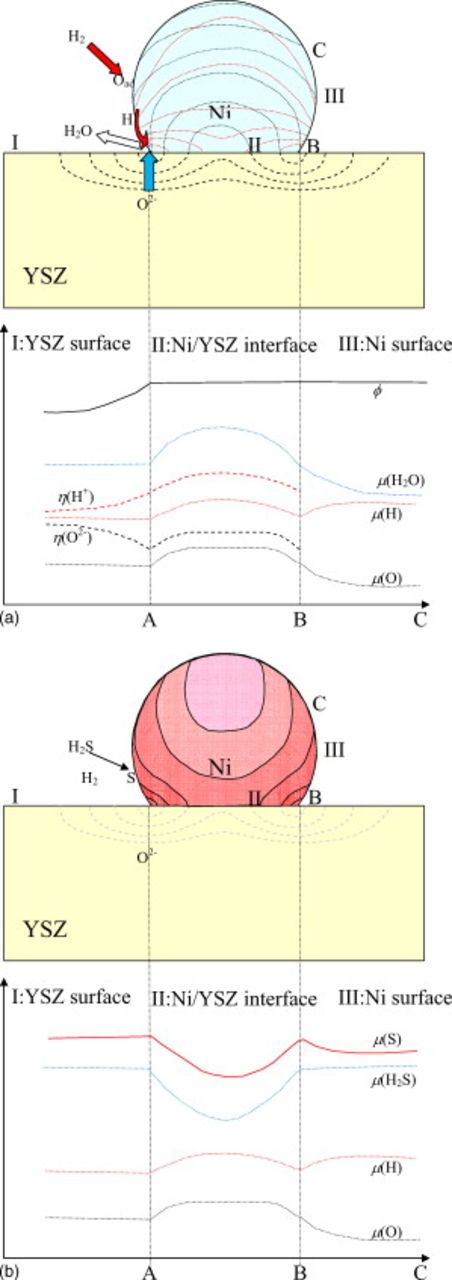
Figure 12. (a) Schematic drawing for the chemical potential distribution around the TPB vicinity in the nickel anode on the oxide electrolyte; chemical potentials of oxygen, hydrogen, and water vapors and the electrochemical potentials for oxide ions and protons are given schematically along the YSZ surface, nickel–YSZ interface, and nickel surface. (b) Possible change in sulfur potential on the nickel surface as well as inside nickel.
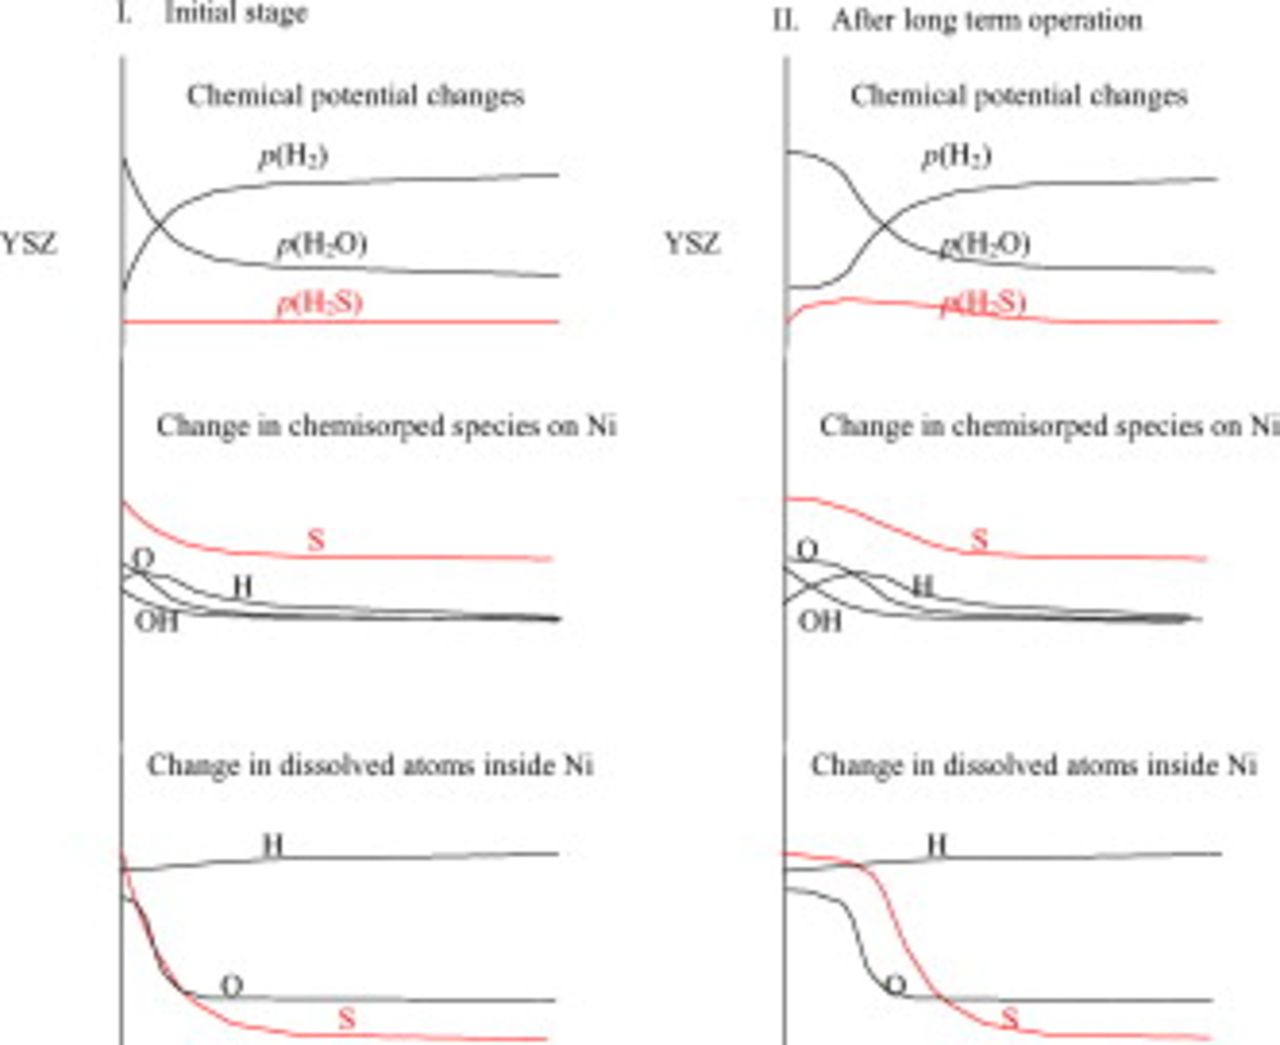
Figure 13. Schematic illustration indicating the change in concentration of chemisorped species on nickel in relation to the chemical potential change.
In the lower part of Fig. 12a, the oxygen potential, hydrogen potential, oxide ion electrochemical potential, proton electrochemical potential, and chemical potential of water vapor are also given as a function of location on (I) the YSZ surface, (II) the nickel and YSZ interface from the TPB A to B, and (III) the nickel surface from the TPB of points B to C; it is assumed that there is no potential gap across the nickel and YSZ interfaces. The hydrogen potential and the oxygen potential both have higher values at the interfaces (region II) than those at TPBs (points A and B). As a result, there is some possibility that some parts of nickel can be oxidized to be NiO even when the anode potential is lower than that for the Ni/NiO equilibrium. Also, the hypothetical vapor pressure of water has a maximum along this nickel–electrolyte interface.
Comparison with sulfur poisoning observations
On the basis of the above anode reaction model and associated oxygen potential distribution in the local equilibrium approximation, accumulated experimental results on sulfur poisoning can be considered in several points as follows.
Features of sulfur poisoning: Rapid poisoning and reversible but slow recovering
In anode working environments, nickel sulfides are not formed in a contamination range up to 100 ppm. Therefore, observed reversible degradation due to sulfur content in fuel can be ascribed to adsorbed or dissolved sulfur atoms on/in nickel. Quite recently, Hansen14 clarified the close relation between the onset of sulfur poisoning and the coverage of the chemisorped sulfur on nickel; a coverage of 0.6 is typical for the onset of sulfur poisoning so that this is plotted in Fig. 10. Here, the sulfur potential increases with oxygen potential in the  dominant area so that the coverage of chemisorped sulfur atoms should be maximized at the TPBs. The chemisorptions may affect both processes; the hydrogen formation (hydrogen molecule dissociation) should be retarded on the replacement of oxygen by sulfur on the nickel surface, whereas the water vapor emission in the TPB vicinity should be directly blocked by the sulfur atoms on nickel at TPBs. Contrary to the poisoning process, the recovering process, after switching back to no-sulfur content fuel, is a slow process in the range from several to several tens of hours.
Features of sulfur poisoning: Irreversible processes
With lowering temperature, sulfur poisoning features may change as follows:
- (1)The recovering speed will be reduced.
- (2)Irreversible phenomena appear more often.
- (3)In some cases, particularly under the galvanostatic condition, the electrical potential suddenly starts to drop, resulting in the death of cells. This behavior depends on the oxide component in nickel cermet anodes.8 Furthermore, large effects of carbonaceous fuels can be seen. In particular, when the internal reforming ability is not good enough, degradation becomes severe.5
- (4)
- (5)Although no direct evidence is available, nickel–ScSZ cermet anodes utilized in our experiments on the desulfurized kerosene lead to the decrease in the electrode activity under the galvanostatic operation and to the sintering of nickel. After several additional experiments, we came to doubt the effect of the remaining sulfur in kerosene.20


Interpretation in terms of chemical potential distributions
These degradation behaviors should be compared with the equilibrium properties described in the present investigation with the aid of the anode reaction mechanism model based on the local equilibrium approximation; particularly, the partial pressures of  ,
,  , and CO(g) or oxygen potential, hydrogen chemical potential, and sulfur chemical potential in the TPB vicinity should be crucial.
Before detailed analyses are made, the adsorption/desorption processes are first examined from the electrochemical point of view. Because the adsorption of sulfur from the  gaseous molecule on nickel is a rather fast process, this process can be described as the following reaction

From the equilibrium thermodynamic point of view, this provides the appropriateness to treat the adsorption as a function of  . Even so, this chemisorption is similar to the hydrogen gas dissociation (hydrogen atom formation) process associated with the electrochemical oxidation of hydrogen gas. This can be written as

Because H(on/in Ni) should be consumed in the charge-transfer process, the combined reaction can be written as

This is the electrochemical oxidation of  to form
  and S adsorption. This is quite similar to the electrochemical reduction process of
  in the Cr poisoning of the lanthanum strontium manganite cathode.51
In a similar manner, the desorption process can be discussed by two processes. The normal chemical process is the reverse reaction of Eq. 7. The electrochemical process available can be the following

although this reaction is not so favored from the thermodynamic equilibrium point of view. No reverse reaction of Eq. 9 is expected because such a process is electrochemical oxidation and will not proceed under the fuel cell operation mode. Here, we come to realize an important fact that the side electrochemical reaction such as Eq. 10 is irreversible, whereas a similar process of sulfur deposition such as Eq. 7 proceeds as a reversible process because no oxide ion in the electrolyte nor electron in nickel participated in the process.
For the "reversible" sulfur poisoning stage and the subsequent slow recovering stage, the followings features should be noted:
- (1)Blocking by chemisorped sulfur: As suggested by Hansen,14 the coverage of sulfur on nickel is one of the crucial measures. Because the poisoning speed of the initial performance drop is rather fast, the chemisorped sulfur blocks the critical processes of the electrochemical oxidation of hydrogen molecules or hydrocarbons. This strongly suggests that chemisorptions take place preferentially as the electrochemical oxidation of, as given in Eq. 9.
- (2)In some cases, an induction period of time is observed before a stepwise decrease in voltage. This can be explained in terms of time for sulfur to reach all available TPBs; when only a part of the TPBs are covered with sulfur, a redistribution of current density takes place so as to maintain a high voltage. Furthermore, the trapping ability of nickels may be different from anode to anode.
- (3)Slow recovery process is discussed here in terms of the reversible adsorption/desorption process or the electrochemical volatilization reaction. Desorption is a reaction of the chemisorped sulfur to be removed with hydrogen to form so that the equilibrium pressures of and and a flow rate of hydrogen are factors of determining the recovering speed. As shown in Fig. 10, an extremely low concentration of is needed to reduce the surface coverage of sulfur on nickel. In addition, the hydrogen partial pressure is small in the TPB vicinity where sulfur tends to be adsorped. However, the electrochemical oxidation reaction (Eq. 10) of chemisorped sulfur to form can also be considered as a candidate for the desorption process. As described above, this reaction is favored only in the high oxygen potential region and, therefore, the rapid removal cannot be expected. Even so, an important feature is that the removal process takes place first from sulfur near the TPBs. In view of these two different possible mechanisms, it is interesting to identify which gaseous species is dominant during the recovery process. Anyway, from the equilibrium property for the adsorption of sulfur, the slow recovering process is understandable.


Irreversible damage of nickel anodes by sulfur
To interpret the irreversible damage of nickel anodes, it must be necessary to make further considerations on other factors influencing sulfur behavior.
Diffusion
Frequently observed stepwise lowering of the voltage under the galvanostatic condition corresponds to the sudden increase in oxygen potential and associated sulfur potential in the TPB vicinity; this promotes further dissolution of sulfur inside nickels. Because this diffusion proceeds without any equilibration with gaseous species, the sulfur potential or its gradient inside nickel governs the diffusion. This is illustrated in Fig. 12b; the diffusion takes place through TPB areas as an inlet for further diffusion inside nickel toward those areas where sulfur potential is low. This implies that sulfur can be accumulated not only as chemisorped species on surface but also as dissolved atoms in the vicinity of TPBs to Ni/electrolyte interfaces. This sulfur flow is not the steady-state flow unlike the oxygen or hydrogen flows in Fig. 12, but this depends on time and, as a result, the sulfur dissolved area is spread out inside the nickel anode layer.
Although diffusion properties in the Ni–S system are not experimentally well known, the phase diagram behavior such as the formation of eutectics at relatively low temperatures suggests that nickel self-diffusion may be strongly enhanced in the presence of sulfur in this region. An important point is that such an effect of enhancing diffusion is expected in the high oxygen potential region, that is, in the TPB vicinity. Although the solubility itself is not so large, a totally accumulated amount of sulfur in the TPB vicinity increases depending on the operation time. Desorption of sulfur is therefore accompanied with the squeeze-out process of such dissolved sulfur out of the TPB area. It is expected to take a longer time than a simple desorption process.
Effects of Ni sintering
Enhanced diffusion must lead to the enhancement of sintering.21 Sintering of nickel particles gives rise mainly to two effects on the electrochemical performance. First, nickel sintering inevitably and partly destroys the percolated network of electrical path among nickel particles. Another effect is the detachment of nickel from the original position at the interface with the electrolyte. This results in the movement/disappearance of nickel particles from the bottom of the anode layer, leaving a frame structure of the oxide component alone. This should result in an increase in ohmic resistance and a decrease in TPB length and TPB distribution.
Flooding
The above considerations strongly suggest that even during the so-called reversible process, irreversible processes such as diffusion of sulfur into nickel or accumulation of sulfur at TPBs proceed. This may give an explanation for the difference between Christiansen's results4 and Nabielek and Smith's results;6 in the former, up to 100 ppm of  in
in  , the anode performance recovered to their initial value, whereas in the latter, for 30 ppm of
  in
in  , a cell was finally catastrophically dead after 290 h of operation during which the initial voltage was maintained to be 0.8 V, but the voltage dropped suddenly below 0.7 V after 130 h. Their post-test examination revealed that sulfur was accumulated as nickel sulfides at the bottom of the anode layer. Furthermore, the needlelike crystal of nickel sulfate was also detected within the anode layer. These observed features indicate that the following can be considered as a possible sequence of things that happened in the cells:
- (1)Sulfur was chemisorped on nickels and accumulated as chemisorped species.
- (2)When such chemisorped species reached almost all TPB areas, the generated voltage decreased stepwisely.
- (3)Chemisorped sulfur started to make poisoning effects to the hydrogen dissociation (hydrogen atom formation) process in addition to the charge-transfer process at TPBs.
- (4)This promotes the electrochemical oxidation of to form and chemisorped sulfur.
- (5)Parts of chemisorped sulfur diffused into nickel or partly also to the nickel–electrolyte interface.
- (6)Accumulated sulfur at TPBs eventually destroys the electrical path, and, as a result, the atmosphere inside the anode chamber becomes more oxidative enough for Ni to be sulfated.


Enhancement effects
Under the local equilibrium approximation alone, no good explanation is given for the formation of solid nickel sulfides or Ni–S eutectics at 1073 K with hydrogen containing 30 ppm of  in Julich's experiment. We need additional mechanisms to increase the sulfur potential to a level high enough for the solid sulfide or eutectics formation. At present, two possible effects can be considered:
- (1)Spread out of electrochemical reaction sites and enhanced sulfur potential due to the electrochemical oxidation of. After the adsorped sulfur occupied the original electrochemical sites at TPBs, the actual reaction sites may be spread out to the outer region from the electrolyte/electrode interface. If the contribution of the electrochemical oxidation of increases compared with the normal adsorption process, the sulfur potential can increase just because the deposition rate becomes higher than the evaporation rate. This is schematically illustrated in Fig. 13.
- (2)Accumulation due to diffusion caused by temperature difference, gravity, etc. In hydrogen fuels, is heavier than or so that the concentration can increase at the bottom of the stack where the temperature is rather low. As shown in Fig. 8, sulfur concentration in Ni can be high at a lower temperature. This suggests that sulfur tends to be accumulated in the lower temperature region.


Such mechanisms may lead the formation of Ni–S eutectics or nickel sulfide. In Fig. 5a, this eutectic phase appears along the line for  . This suggests that a big increase in sulfur potential is not needed for the eutectic formation.
Effects of hydrocarbon fuels
Comparing hydrogen and hydrocarbon fuels with the same kind of anodes, hydrocarbon fuels may provide stronger damages5 on anodes than hydrogen fuels at the same level of  contamination; this should be related to the incompleteness of the reforming process. The present investigation revealed that the Ni–S interaction in the Ni–S–C–O–H system is essentially the same as that in the Ni–S–O–H system, whereas that in the Ni–S–C–O system without hydrogen exhibits quite a different behavior; stronger interactions are expected at the more reductive (closer to the fuel cell operation) oxygen potential region. Electrochemical activities of nickel anodes are usually higher for hydrogen than for CO,58 and sulfur affects the catalytic activity of nickel for water–gas shift reactions. In view of this, when the reforming is incomplete and hydrogen concentration is lower than the equilibrium composition, sulfur poisoning may affect from the following two aspects: (i) increase oxygen potential at TPBs due to deviation in the composition from the equilibrium and (ii) decrease in hydrogen contribution to the electrochemical oxidation. The former directly increases the sulfur potential at the TPBs. The latter may cause some change in the electrochemically active species; if CO becomes a major species to be electrochemically oxidized and COS becomes the major species for sulfur contamination, the Ni–S interaction becomes more severe, as shown in Fig. 9. This is consistent with the observation that sulfur poisoning can be minimized after the completion of the reforming process.15
For Further Investigation
The present investigation has been made mainly on the basis of the equilibrium properties in the Ni–S system in the SOFC anode environments. To make those assumptions clear, which are adopted in the present investigation, it is hoped to examine the kinetic properties of nickel in the presence of sulfur; particularly, diffusion properties or wettability are highly required to understand the effects of sulfur.
In the present investigation, the role of the oxide component in cermet anodes was not fully discussed. Even so, the oxide component may significantly affect the anode reaction mechanism so that comparison among the different cermet anodes may provide good examples to further investigate sulfur poisoning.
Most recently, experimental investigations have been made on the examination of poisoning effects of impurities in coal-derived gas.59 It is hoped that the method and interpretation for the poisoning of a gaseous sulfur compound can be extended to those impurities such as Se, Sb, As, and P to obtain a more fundamental and more generalized60, 61 understanding of the interaction of Ni cermet anodes and gaseous impurities in fuels.
Conclusions
The present investigation has revealed that the sulfur potential is quite important in understanding the interaction of sulfur with nickel in the SOFC anode environments where the oxygen potential sensitively affects the sulfur potential. The construction of new diagrams for the Ni–S–C–O–H systems makes it possible to clarify the condition of the appearance of the Ni–S eutectics and the plausible effects on the Ni–S interaction. The carbonaceous fuel without hydrogen exhibits quite a different behavior against sulfur from those fuels containing hydrogen. Discussion has been made on the reversible and irreversible processes. On the basis of the local equilibrium approximation, we recognize that even during the reversible process, an irreversible process such as the sulfur dissolution and the electrochemical oxidation of  can proceed. This mechanism leads to some possibility that sulfur is accumulated around the TPB area as a result of the electrochemical oxidation of hydrogen sulfides or as a result of temperature distribution.
National Institute of Advanced Industrial Science and Technology assisted in meeting the publication costs of this article.