
Abstract
In this study, the structural degradation of a polymer electrolyte membrane fuel cell (PEMFC) cathode catalyst layer due to carbon corrosion was investigated. To oxidize the catalyst carbon support, the PEMFC catalyst layer was subjected to a 30 h accelerated stress test that cycled the cathode potential from 0.1 to  (where RHE denotes reversible hydrogen electrode) at 30 and 150 s intervals. Carbon dioxide release was measured in the gas exhaust to establish the rate and amount of carbon loss. Cyclic voltammetry, electrochemical impedance spectroscopy (EIS), scanning electron microscopy, and polarization analyses were completed to characterize and correlate the structural degradation of the catalyst layer to the PEMFC performance. The results showed a clear thinning of the cathode catalyst layer and the gas diffusion layer carbon sublayer and a reduction in the effective platinum surface area due to carbon support oxidation. The degradation of the cathode catalyst layer also altered the water management, as evidenced by an increase in the voltage losses associated with oxygen mass transport and catalyst layer ohmic resistance. There was an emphasis on the EIS measurement to further develop and verify this methodology for other degradation mechanisms.
Export citation and abstract BibTeX RIS
There are several mechanisms that can affect the performance of a fuel cell, including hydrogen and oxygen mass transfer to the reaction sites, proton conductivity through the ionomer, hydrogen and oxygen electrode reaction rates, and water management. All of these mechanisms exist within the electrode structure, which consists of a gas diffusion layer (GDL) and a catalyst layer (CL). The GDL  is often made of a carbon fiber material with a carbon sublayer consisting of carbon particles and a hydrophobic binder. The GDL serves three purposes: (i) to provide a pathway for the mass transfer of reactants (oxygen and hydrogen) and products (water) to and from the CL, (ii) to ensure structural stiffness to the membrane electrode assembly (MEA), and (iii) to provide an electrically and thermally conductive pathway between the CL and the current collectors. The porous CL
  is comprised of a platinum catalyst supported on electrically and thermally conductive carbon particles and a proton conducting ionomer. The cathode CL typically contains 20–40 wt % ionomer, which has three roles: (i) to act as a binder between the platinum/carbon particles, (ii) to provide a proton conductive link to the membrane for protonic current flow, and (iii) to make the platinum catalyst electrochemically active by transferring protons to and from the catalyst.
Unfortunately, the structure of the CL is difficult to control during manufacture; therefore, it is difficult to control the factors that affect its performance such as gas mass transfer and proton conductivity. The current method of manufacturing the CL mixes the supported catalyst powder with the ionomer solution by various mixing techniques, such as ballmilling, sonication, and impeller mixing. The resulting catalyst ink is then applied either onto the GDL to produce a gas diffusion electrode (GDE) or onto the membrane to produce a catalyst-coated membrane (CCM). The goal is to strengthen the interfaces between layers to maximize performance while using the most cost-effective manufacturing process. While most MEA developers are currently developing CCM technology, this study used a GDE structure.
Early polymer electrolyte membrane fuel cell (PEMFC) research used platinum black as the catalyst at the cathode and anode electrodes. These electrodes had very high platinum loadings  and hence were very costly. One of the ways of reducing the platinum loading was switching from platinum black to platinum supported on carbon. The smaller platinum particles on carbon enabled a reduced loading of less than
  while maintaining the required platinum surface area. Although the cost was reduced, the durability of the fuel cell was negatively impacted. At potentials greater than
  (where RHE denotes reversible hydrogen electrode), the carbon support is thermodynamically able to oxidize to carbon dioxide
  and carbon monoxide (CO) (Eq. 1, 2),1 leaving the platinum unsupported and inactive. Furthermore, due to the loss of support, the platinum particles agglomerated into larger particles, dissolved into the ionomer, or got washed out of the system2, 3


Even in the presence of platinum, the kinetics of carbon oxidation/corrosion is slow; therefore, carbon is quite stable under normal PEMFC operating conditions. In practice, elevated cathode potentials of greater than  are required to oxidize carbon at reaction rates high enough to cause significant structural degradation. Normal PEMFC operation occurs between 0 and
  ; however, upon fuel starvation or gas switching conditions (start-up and shutdown protocols), the cathode potential can exceed
  , as shown in Fig. 1.4
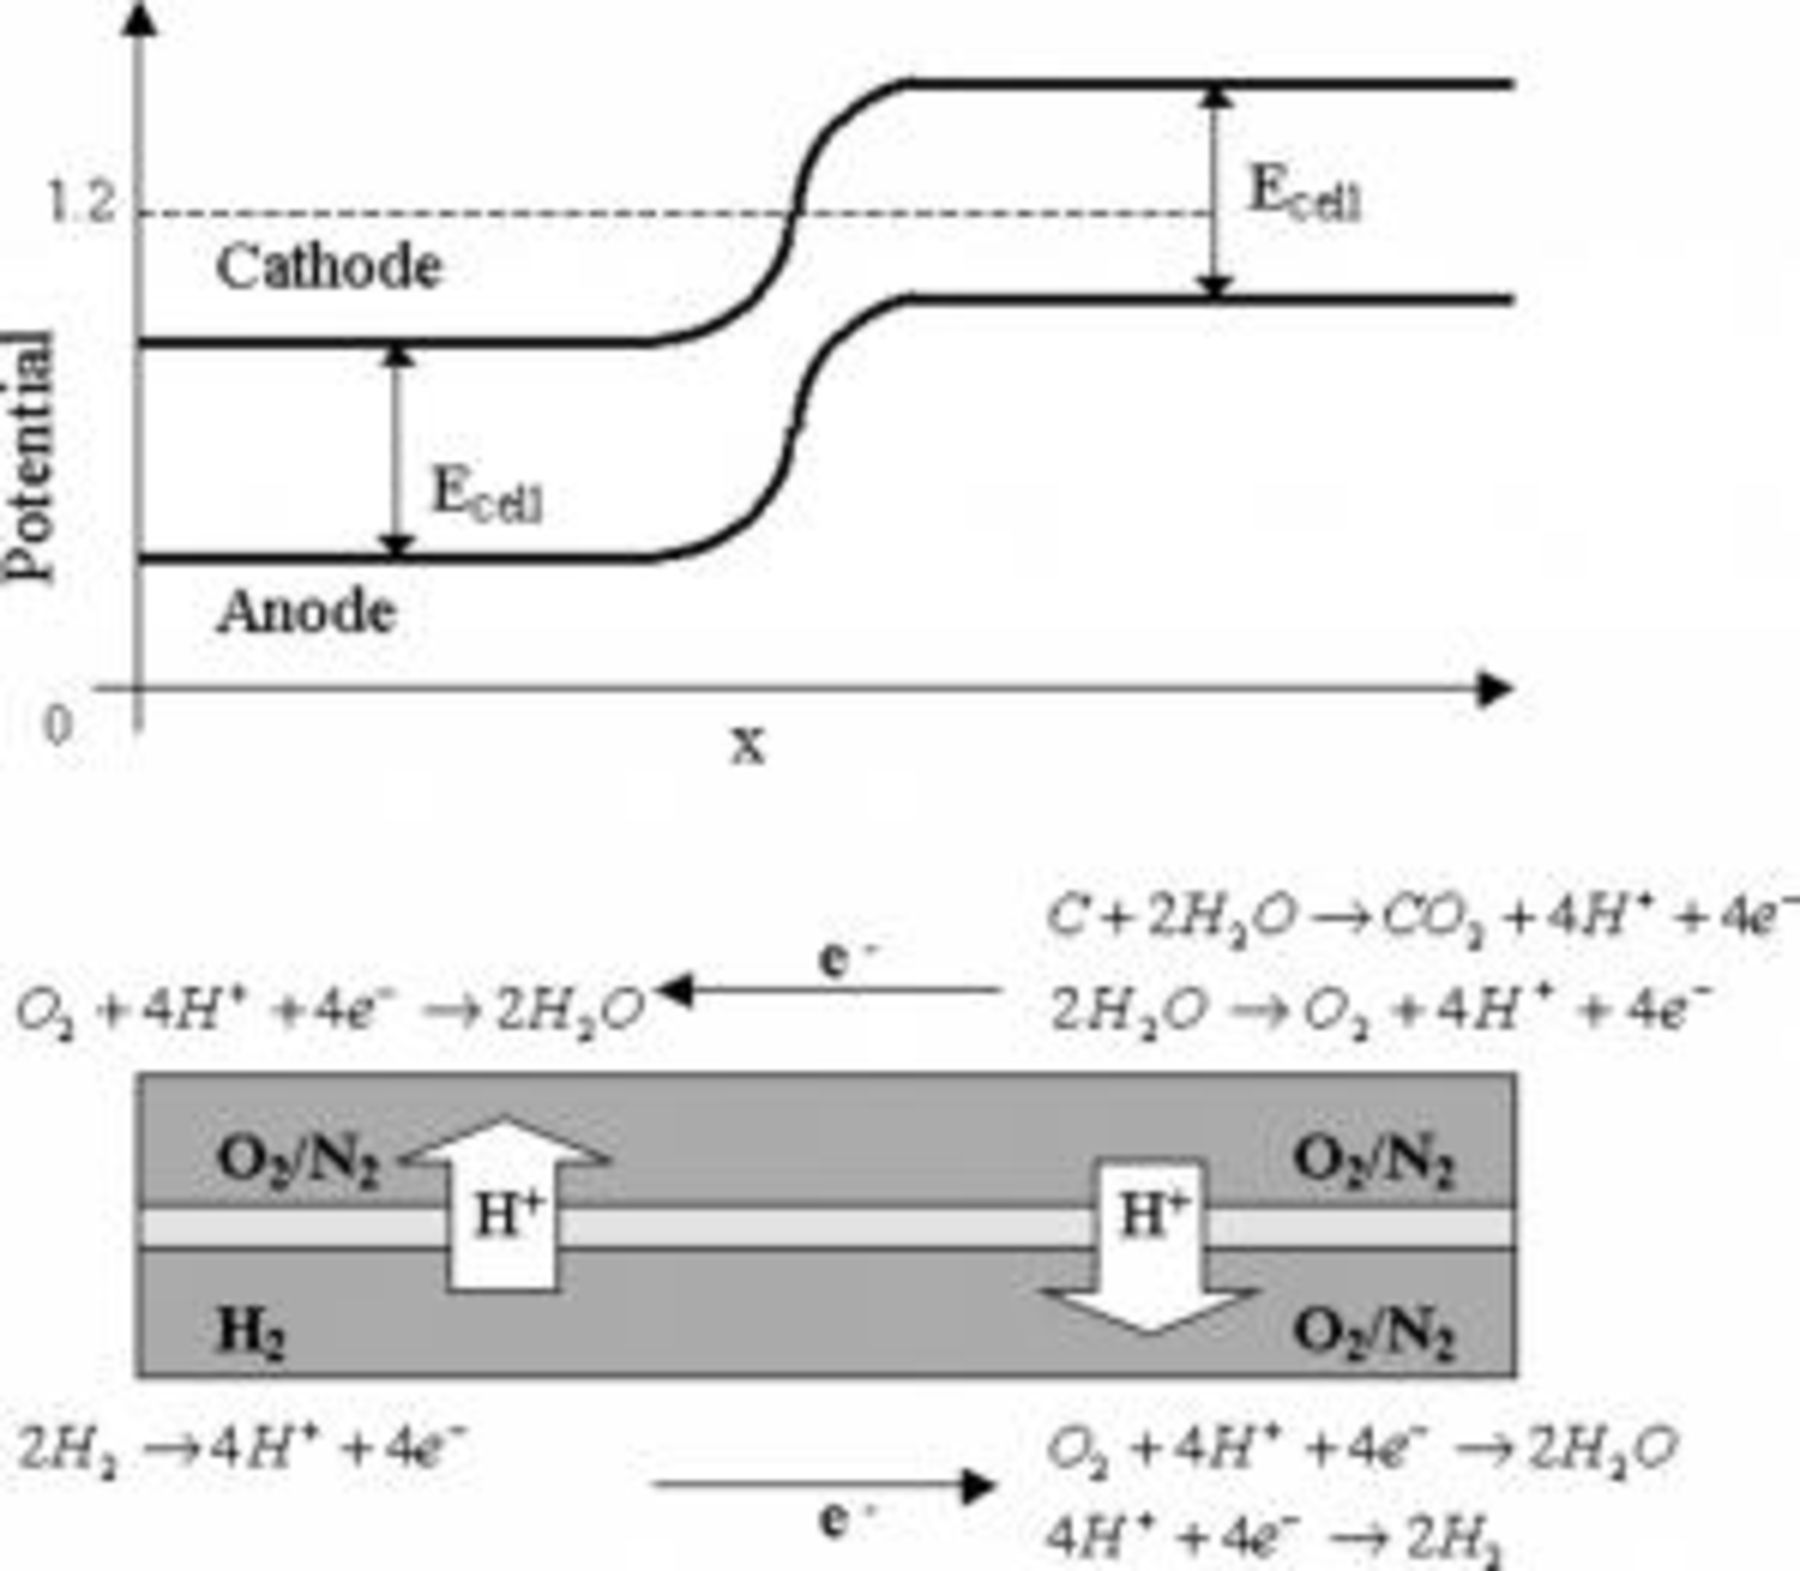
Figure 1. Carbon oxidation degradation mechanism.
When hydrogen in the anode compartment is replaced by air, or vice versa, a temporary potential gradient is formed along the anode electrode. Hydrogen oxidation occurs in the hydrogen-rich portion of the electrode, and proton and oxygen reduction occurs in the transient portion of the cell. The voltage across the MEA in the hydrogen-rich region of the anode drives the current in the air transient portion of the cell, elevating the half-cell potential on the cathode to values greater than  . At these potentials, both water and carbon oxidations take place, as shown in Eq. 1, 2, 3

Meyers and Darling5 modeled this process and suggested possible mitigation strategies to reduce the amount of carbon oxidation, including a nitrogen purge step before introducing a gas change at the anode electrode or controlling the cathode potential by shorting the cell. They calculated a reduction in the carbon oxidation through both methods, with the shorting mitigation having the greatest impact.
This phenomenon is similar to connecting a power supply to a fuel cell with air at both electrodes. The power supply voltage drives the current through the fuel cell, causing carbon and water oxidation at the original fuel cell cathode, which now in effect becomes the anode and proton, and oxygen reduction at the original anode, which now in effect becomes the cathode. Water electrolysis technology operates by the same principle, only the system is designed to maximize water oxidation and eliminate carbon oxidation. The accelerated stress test (AST) in this study used this technique by connecting a potentiostat to the fuel cell with nitrogen at the cathode electrode and hydrogen at the anode electrode. Both carbon and water oxidation reactions were forced by applying the voltage across the MEA to  .
.
The carbon lost at electrode potentials of greater than  reduces the effective platinum surface area (EPSA) and the kinetic performance and also weakens the CL structure. Once a significant amount of carbon is lost as
  and CO, the CL structure collapses and becomes thinner, leaving only the unsupported platinum and Nafion ionomer. Using electrochemical impedance spectroscopy (EIS), cyclic voltammetry (CV), and polarization analysis, the CL structure and structural degradation caused by carbon corrosion were investigated and the sensitivity of the EIS conductivity measurement to gas relative humidity (RH) and the MEA structure was evaluated. This study provides the basis for using these techniques to further characterize the structural damage to the CL.
Experimental
MEA components
MEAs for this work were prepared by bonding cathode and anode GDEs to a  DuPont Nafion membrane (two layers of DuPont NR211) at
  , 15 bar, for 2.5 min in a compaction press. The anode GDE consisted of a Toray TGP-60 carbon fiber paper with a carbon and Teflon sublayer and a graphitic carbon supported platinum (50 wt % carbon/50 wt % platinum) CL with a platinum loading of
  . The cathode GDE were similar to the anode GDE, only with a greater nominal platinum loading of
  . The ionomer content was varied between 23 and 33 wt % of the cathode CL to show differences in the CL ionomer conductivity and any influence on carbon corrosion degradation. To facilitate better bonding to the membrane, both the anode and the cathode were sprayed with an additional
  Nafion solution. It was assumed that this spray coat stayed near the surface of the CL and did not penetrate and contribute significantly to the amount of ionomer in the CL.
MEA structure
The test setup minimized the temperature, pressure, and concentration gradients along the length of the cell to achieve one-dimensional operating conditions. The MEAs had a  anode geometric area and a masked cathode with a
  geometric area, as shown in Fig. 2. The remainder of the
  cathode GDE was stripped of catalyst with tape and covered with a
  thick polyester mask. Because the CL was only slightly thicker
  than the polyester mask, even compression was achieved.

Figure 2. Cathode GDE structure. Catalyst in the unmarked section is stripped off the electrode leaving a  active area. A
  thick polyester (PET) mask covers the nonactive area. The cathode GDE is then bonded to a
  Nafion membrane
  and a
and a  anode GDE under
  and 15 bar for 2.5 min. This enables high gas stoichiometries, effectively creating zero gradient operating conditions over the cathode active area.
Operating conditions and degradation protocol
The cell was conditioned at the standard steady-state (SS) operating conditions listed in Table I. The gas flow rates correlated to a reactant stoichiometry of greater than 50, which helped create a one-dimensional environment, where temperature, pressure, and concentration gradients were minimized across the active area of the MEA. Stevens et al.6 conducted high temperature thermal stability tests on carbon supports for platinum catalysts under both dry and humidified gas conditions. They showed an increased rate of carbon oxidation under a humidified air atmosphere. Therefore, the cathode-corrosion AST was completed in an oversaturated nitrogen (cathode) and hydrogen (anode) atmosphere. The oversaturated atmosphere was designated by 120% RH, which represented 100% gas RH with additional liquid water. The voltage was cycled stepwise from the open-circuit voltage of approximately 0.15 to  for 30 and 150 s, respectively. The corrosion voltage of
  had a greater duration to accelerate the corrosion degradation. The duration at the recovery voltage
  was reduced to minimize the test time. It was assumed that most carbon was oxidized to
  as opposed to CO; therefore, the exhaust gases were monitored for
  to calculate the amount of carbon lost. Because too much flow diluted the gas stream below the limits of the Fuji Electric ZRH IR
  gas analyzer, the gas flow rates were reduced from 25 to 0.3 slpm during the AST. During the AST period, CV and EIS were done every hour or 20 cycles. The full diagnostic test protocol, which included CV, EIS, and air and oxygen polarizations, was completed at 0, 5, 10, 20, and 30 h. Scanning electron microscopy (SEM) analysis was conducted with new and degraded MEAs.
Table I. Operating conditions for the standard fuel cell operation and the corrosion AST test.
| Operating conditions | Temperature
| Pressure (psig) | Oxidant flow rate (slpm) | Fuel flow rate (slpm) | RH (%) | Current density
|
|---|---|---|---|---|---|---|
| Standard (SS) | 70 | 30 | 25 (air) | 15 
| 100 | 1.5 |
| Corrosion (AST) | 70 | 30 | 0.3 
| 0.3 
| 120 | 0 |
The fuel cell hardware used a pressurized bladder to provide compression, making contact between the MEA and the conductive flow field plates. The performance varied with bladder pressure due to the ohmic contact resistance between the plate and the MEA until the contact resistance was minimized. The bladder pressure was optimized and maintained at 80 psig to minimize the contact resistance and to prevent overcompression, which could crush the GDL material and decrease the performance and durability.
CV
Cyclic voltammograms were conducted using a Solartron SI1287 potentiostat to calculate the EPSA, the  crossover current, and the double-layer capacitance
  . Hydrogen present at the anode acted as the reference electrode as the cathode potential was cycled between 0.1 and
  . The EPSA was determined by CO stripping, assuming a charge density of
  to break the linear Pt–CO bond.7
Hydrogen crossing through the membrane was oxidized at the cathode catalyst. The corresponding  crossover current was determined from the anodic shift of the voltammograms on the current axis. The
  was determined from the cyclic voltammograms at
  due to the absence of faradaic reactions.
EIS
EIS measurements were taken by applying a 10 mV ac perturbation signal with a  dc bias potential. An SI1287 Solartron potentiostat and a 1250 Solartron high frequency response analyzer were used in a four-electrode configuration to sweep the frequency between 50 kHz and 0.05 Hz. The bias potential was applied to eliminate any pseudocapacitive effects that resulted from hydrogen and oxygen adsorption–desorption.8 ZPlot and ZView software were used to conduct and analyze the EIS spectra to determine the cell and CL ionomer resistance. Measurements were taken in a nitrogen and a hydrogen atmosphere on the cathode and the anode, respectively. Gas RHs were varied between 50 and 120% to obtain a relationship between the CL ionomer resistance and the RH over the degradation period. The EIS spectra were fitted to an equivalent circuit representing a transmission line circuit, as shown in Fig. 3.
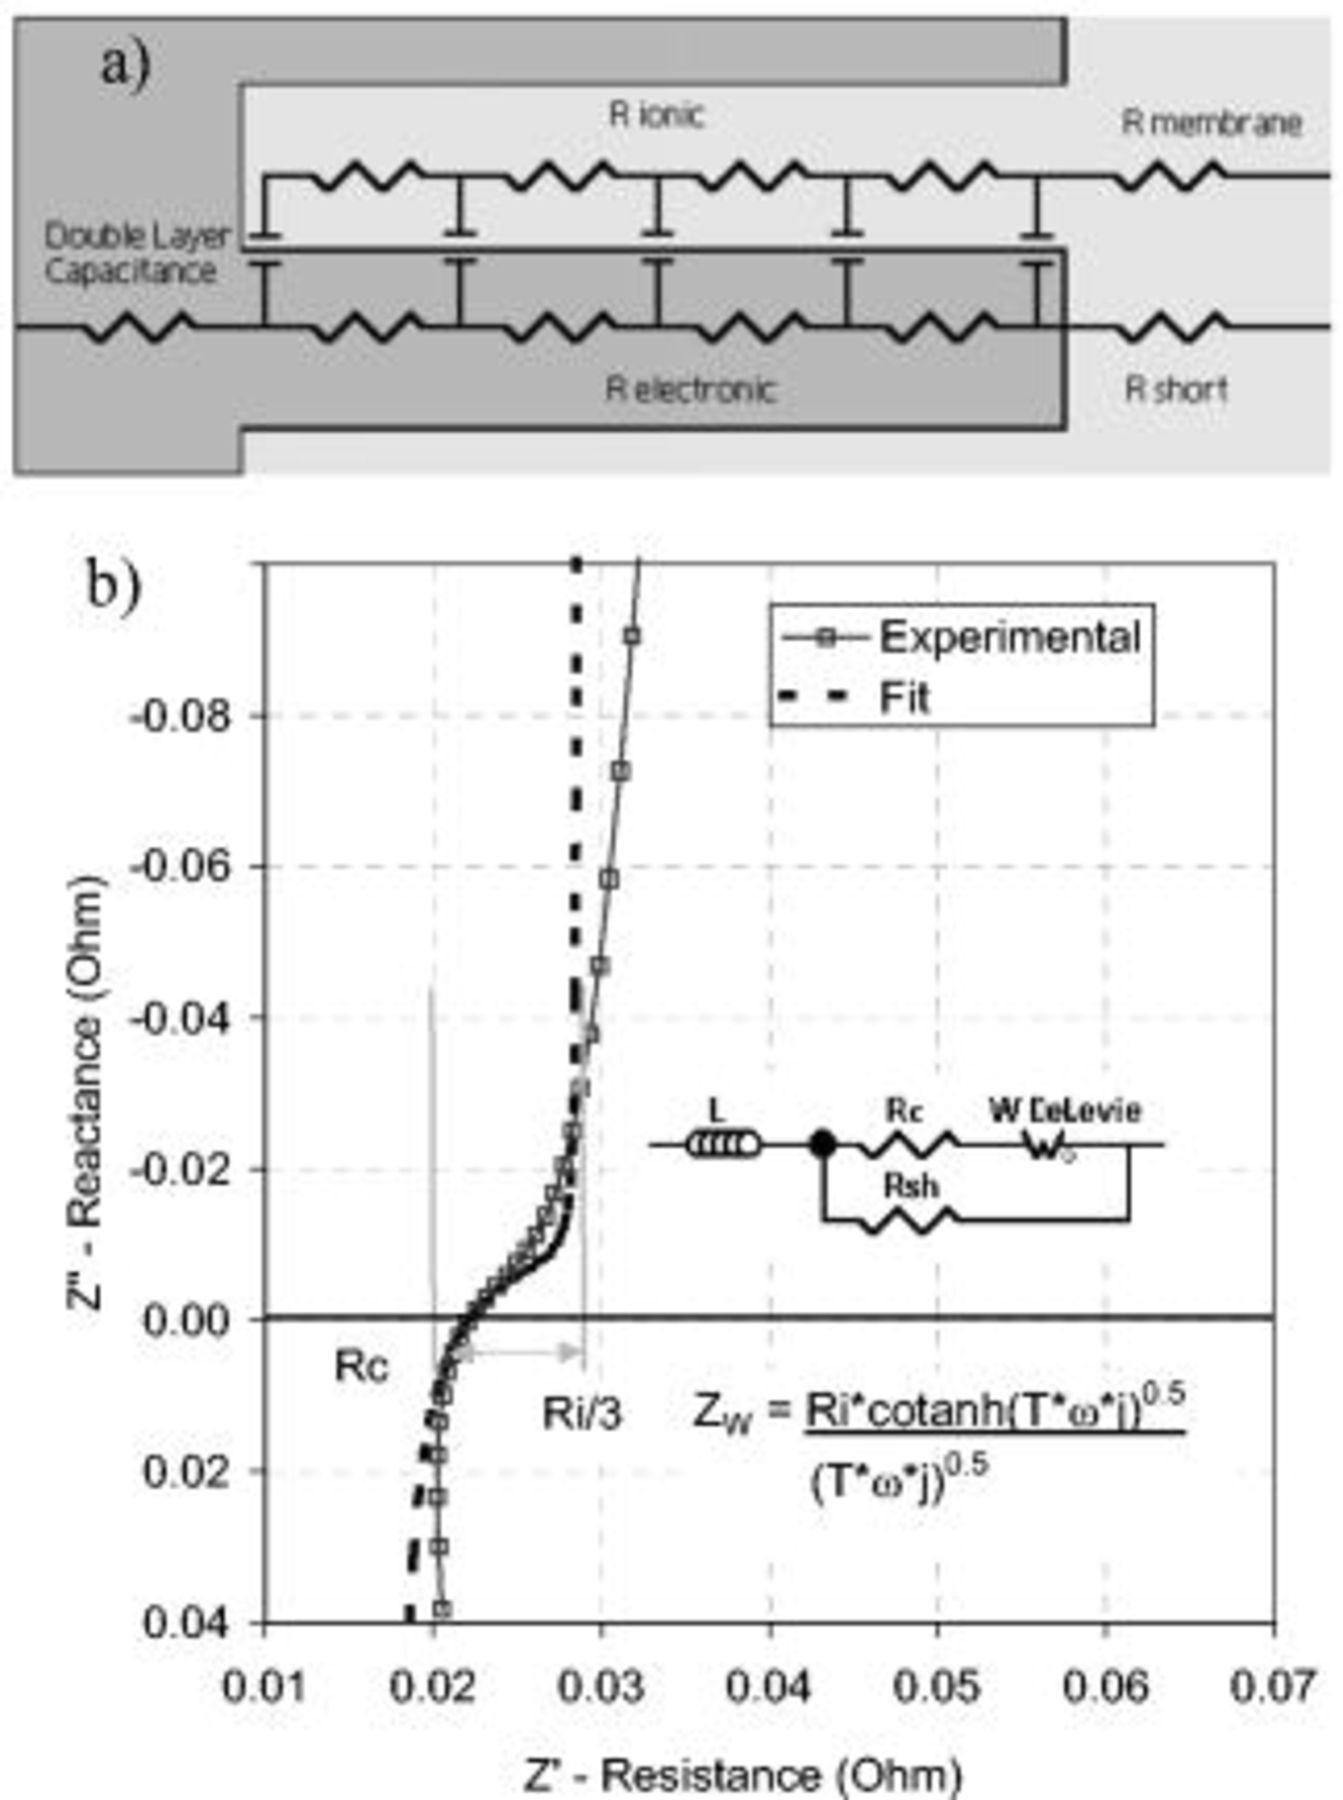
Figure 3. (a) The transmission line circuit above represents the electronic and ionic components of the cathode porous electrode and the ionic membrane in a nitrogen atmosphere. (b) The data were fitted to an equivalent circuit consisting of an inductor  , the HF cell resistance
  , shorting resistance
  , and open Warburg parameter
  . The inductance was a system artifact, and electrical shorts across the membrane caused the shorting resistance. Both have an impact on the impedance spectra and were included in the data fit. The HF cell resistance represents the membrane ionic resistance and the cell electrical resistance. The Warburg parameter represents the De Levie porous electrode behavior and defines the CL ionic resistance
  and
and  . The impedance of the Warburg parameter
  is defined by the cotanh function shown, where
  is the time constant
  and ω is the frequency.
The transmission line circuit consisted of two rails of resistive components, ionic and electronic, connected by capacitive elements that represent the  . At high frequencies, the
  offered no resistance and only the membrane and cell electrical resistances were measured (HF cell resistance,
  ). As the frequency decreased, the
  at the membrane/catalyst interface charged and created impedance. Further decreasing the frequency, the current penetrated further into the pore, measuring both the impedance of the
  of the pore wall and the CL ionomer resistance
  . Once the entire pore was measured, the impedance increased toward infinity as the capacitance became fully charged and blocked all current. This is shown in Fig. 3, with the Nyquist plot for the experimental EIS spectra and the equivalent circuit fit. The open-circuit Warburg circuit element represents De Levie porous electrode behavior9 and is described by a cotanh function. Expanding this function into a series expression, the resistance reduced to
  as the frequency approached zero. The
  term represents the time constant
  . By dividing
  by
by  , the
, the  can be calculated. In nitrogen atmosphere at
  , the limited
  crossover caused the only possible electrochemical reaction, which had an excessively high charge-transfer resistance due to the low
  concentration. The charge-transfer resistance was ignored in the transmission line circuit. The equivalent circuit also shows an inductance
  and a shorting resistance
  . The inductance is a system artifact and is often subtracted from the EIS spectra; however, it was presented here for completion. The shorting resistance represents a membrane shorting behavior that may occur in the MEA. Both the inductance and shorting resistance terms were included in the equivalent circuit to improve the fitting accuracy.
This EIS method was used to describe the ionomer resistance in the porous structure for several PEMFC CL structures with and without load applied.8, 10–13 This study used this method to understand the structural change in the CL due to the oxidation of the carbon support.
Polarization analysis
Voltage–current polarization curves were measured at the standard operating conditions listed in Table I for both oxygen and air. By measuring both the oxygen and air polarization curves under 100 and 60% RH, the kinetic, ohmic, and mass-transport performance could be evaluated over the duration of the carbon corrosion AST.
SEM
After operation, the MEAs were analyzed with a Philips XL30 scanning electron microscope to detect changes in the MEA structure due to the carbon corrosion. MEA samples were cast into epoxy pucks, polished using a Struers TegraPol-11 polisher with 120–1200 grit silicon carbide paper, and given a carbon topcoat using an Edwards Scancoat6 coater. Pictures were taken using a backscatter detector at 400× magnification and 15 kV. The membrane and CL thickness were measured and used to calculate the CL porosity and ionomer volume fraction. The ionomer conductivities were also calculated by normalizing the EIS resistance measurements by the CL thickness.
Results and Discussion
Carbon loss
The carbon dioxide in the exhaust gases was measured and the amount of carbon lost due to corrosion was calculated, as shown in Fig. 4. The rate of carbon loss was not dependent on the catalyst support loading or ionomer loading, suggesting a secondary carbon source. The CLs contained between 2 and 3 mg of carbon depending on the specific MEA tested. More carbon oxidized  than catalyst support, confirming a secondary carbon source susceptible to corrosion. This carbon source was the carbon sublayer between the CL and the GDL, as shown in the SEM analysis.
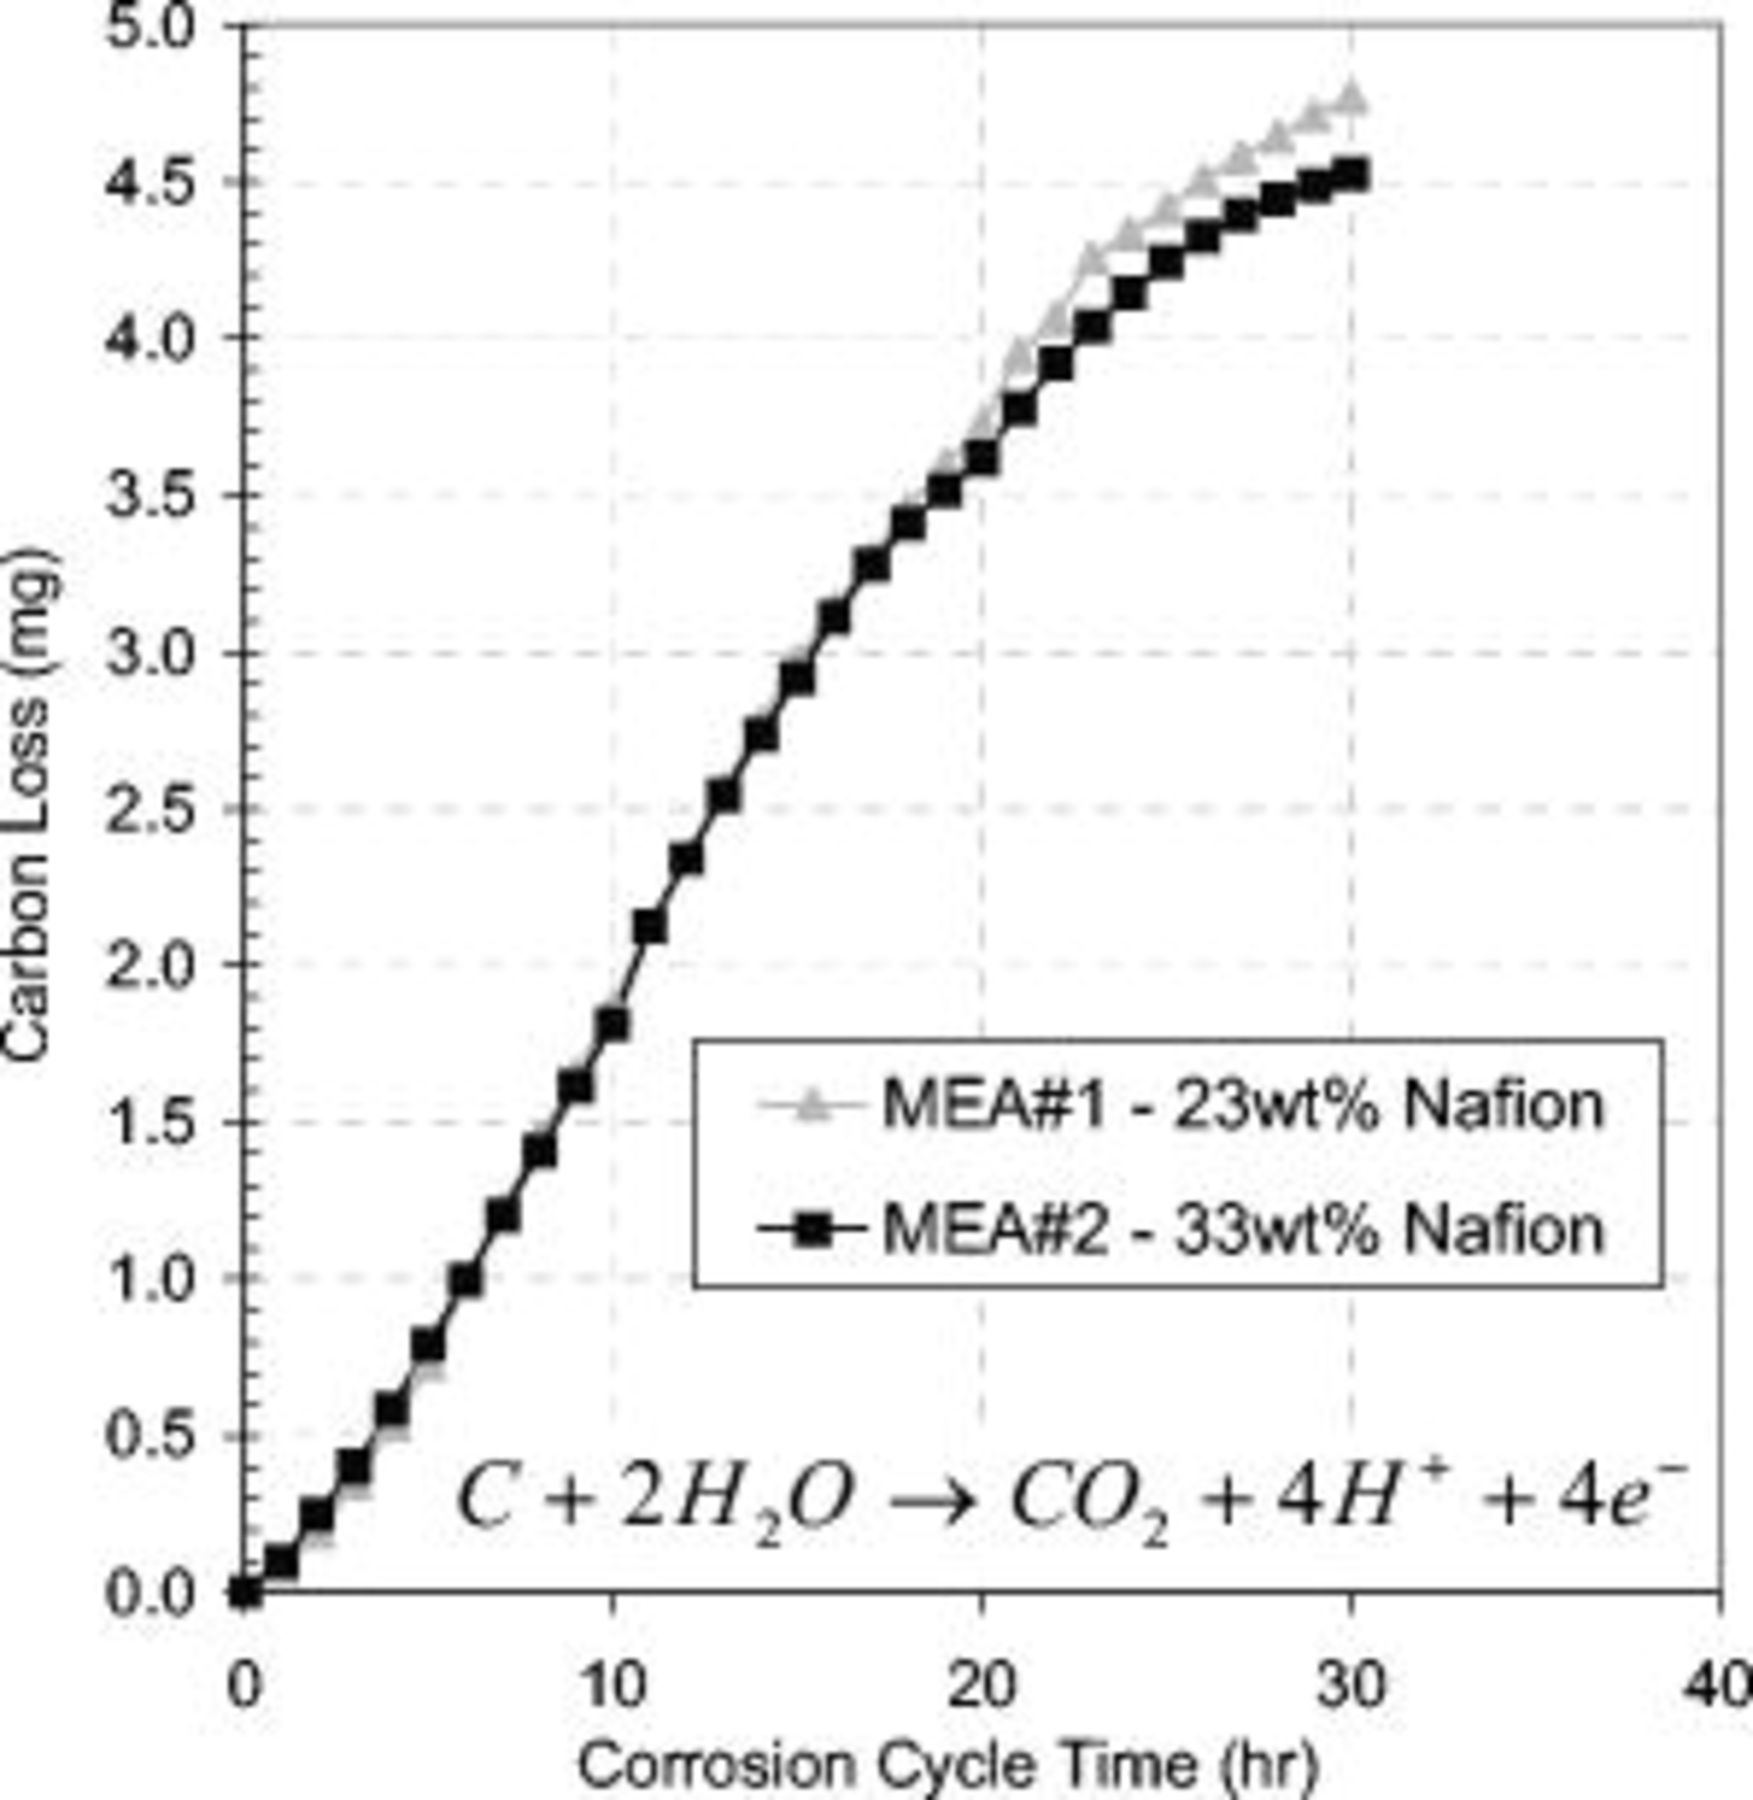
Figure 4. Cumulative carbon loss vs corrosion cycle time for MEAs containing 23 and 33 wt % Nafion in the cathode CL. The cell voltage was cycled at  in a
in a  atmosphere at the cathode and anode, respectively. Total carbon in the CLs was between 2–3 mg depending on the MEA tested; therefore, a significant amount of carbon was oxidized from another source. The cell operating conditions were
  , 30 psig, and 0.3 slpm flow rates with oversaturated gas humidity.
SEM analysis
Figure 5 shows the SEM pictures of a new MEA compared to a MEA that was corroded for 30 h of cycling. After 30 h of corrosion cycling the cathode CL was one-third of the thickness compared to the new MEA and was much brighter, suggesting a higher density of platinum. The lighter gray patches show the Teflon, which roughly marks the edges of the GDL and the interface with the carbon sublayer. The new MEA shows the carbon sublayer between the GDL and the CL, whereas after 30 h of corrosion cycling the sublayer was no longer present. This suggests that the carbon sublayer was oxidized over the degradation period. There was no significant change in the anode or membrane thickness over the corrosion period.
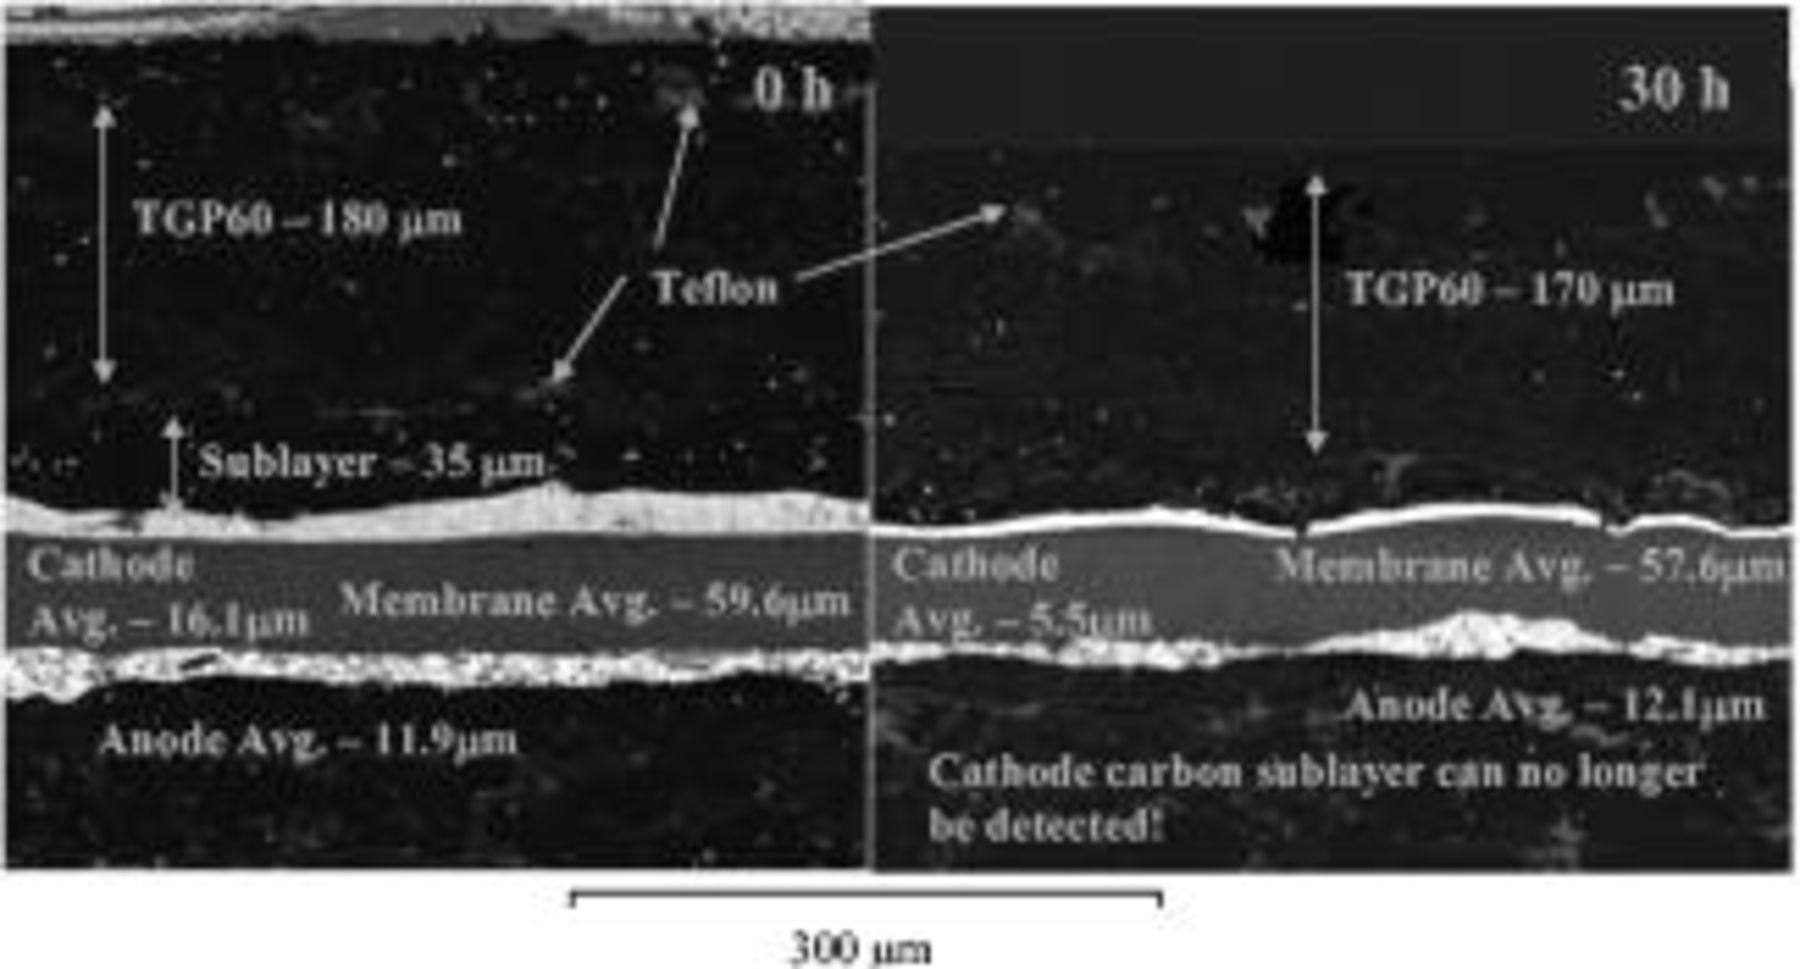
Figure 5. SEM picture comparison of MEAs at 0 and 30 h of corrosion cycling. Left image: 0 h; right image: 30 h. Cathode CL thinned by 65%, and almost all of the carbon sublayer is gone after 30 h of corrosion cycling. The cell voltage was cycled at  in a
in a  atmosphere at the cathode and anode, respectively. Operating conditions as in Fig. 4.
CV
CV was conducted as part of the diagnostic protocol at 0, 5, 10, 20, and 30 h of corrosion cycling time, as shown in Fig. 6.  increased within the first 10 h of corrosion followed by a decrease over the last 20 h. The initial increase in capacitance is believed to be due to the increased concentration of carbon corrosion products with oxygen functionalities at the surface of the carbon support that are hydrophilic and offer a greater
  .14–16 The competing effect of the loss of carbon and platinum surface area due to the loss of the carbon support decreased the
  over time. At 8 h, these opposing effects became balanced and a maximum capacitance occurred. Loss of carbon became the dominant mechanism after 8 h of corrosion cycling, and
  decreased over the remaining corrosion period. This effect is shown clearly in Fig. 7 and was also demonstrated by EIS. Evidently, there was an offset between the CV and EIS measurements, suggesting an inaccuracy. Because the heterogeneous and nonideal EIS results were modeled to a homogeneous ideal structure, this offset was not unexpected. The data from the CV response is believed to be more accurate; however, because the capacitance values obtained from EIS were within the same order of magnitude and sensitive to the effects of degradation, the EIS results were validated.
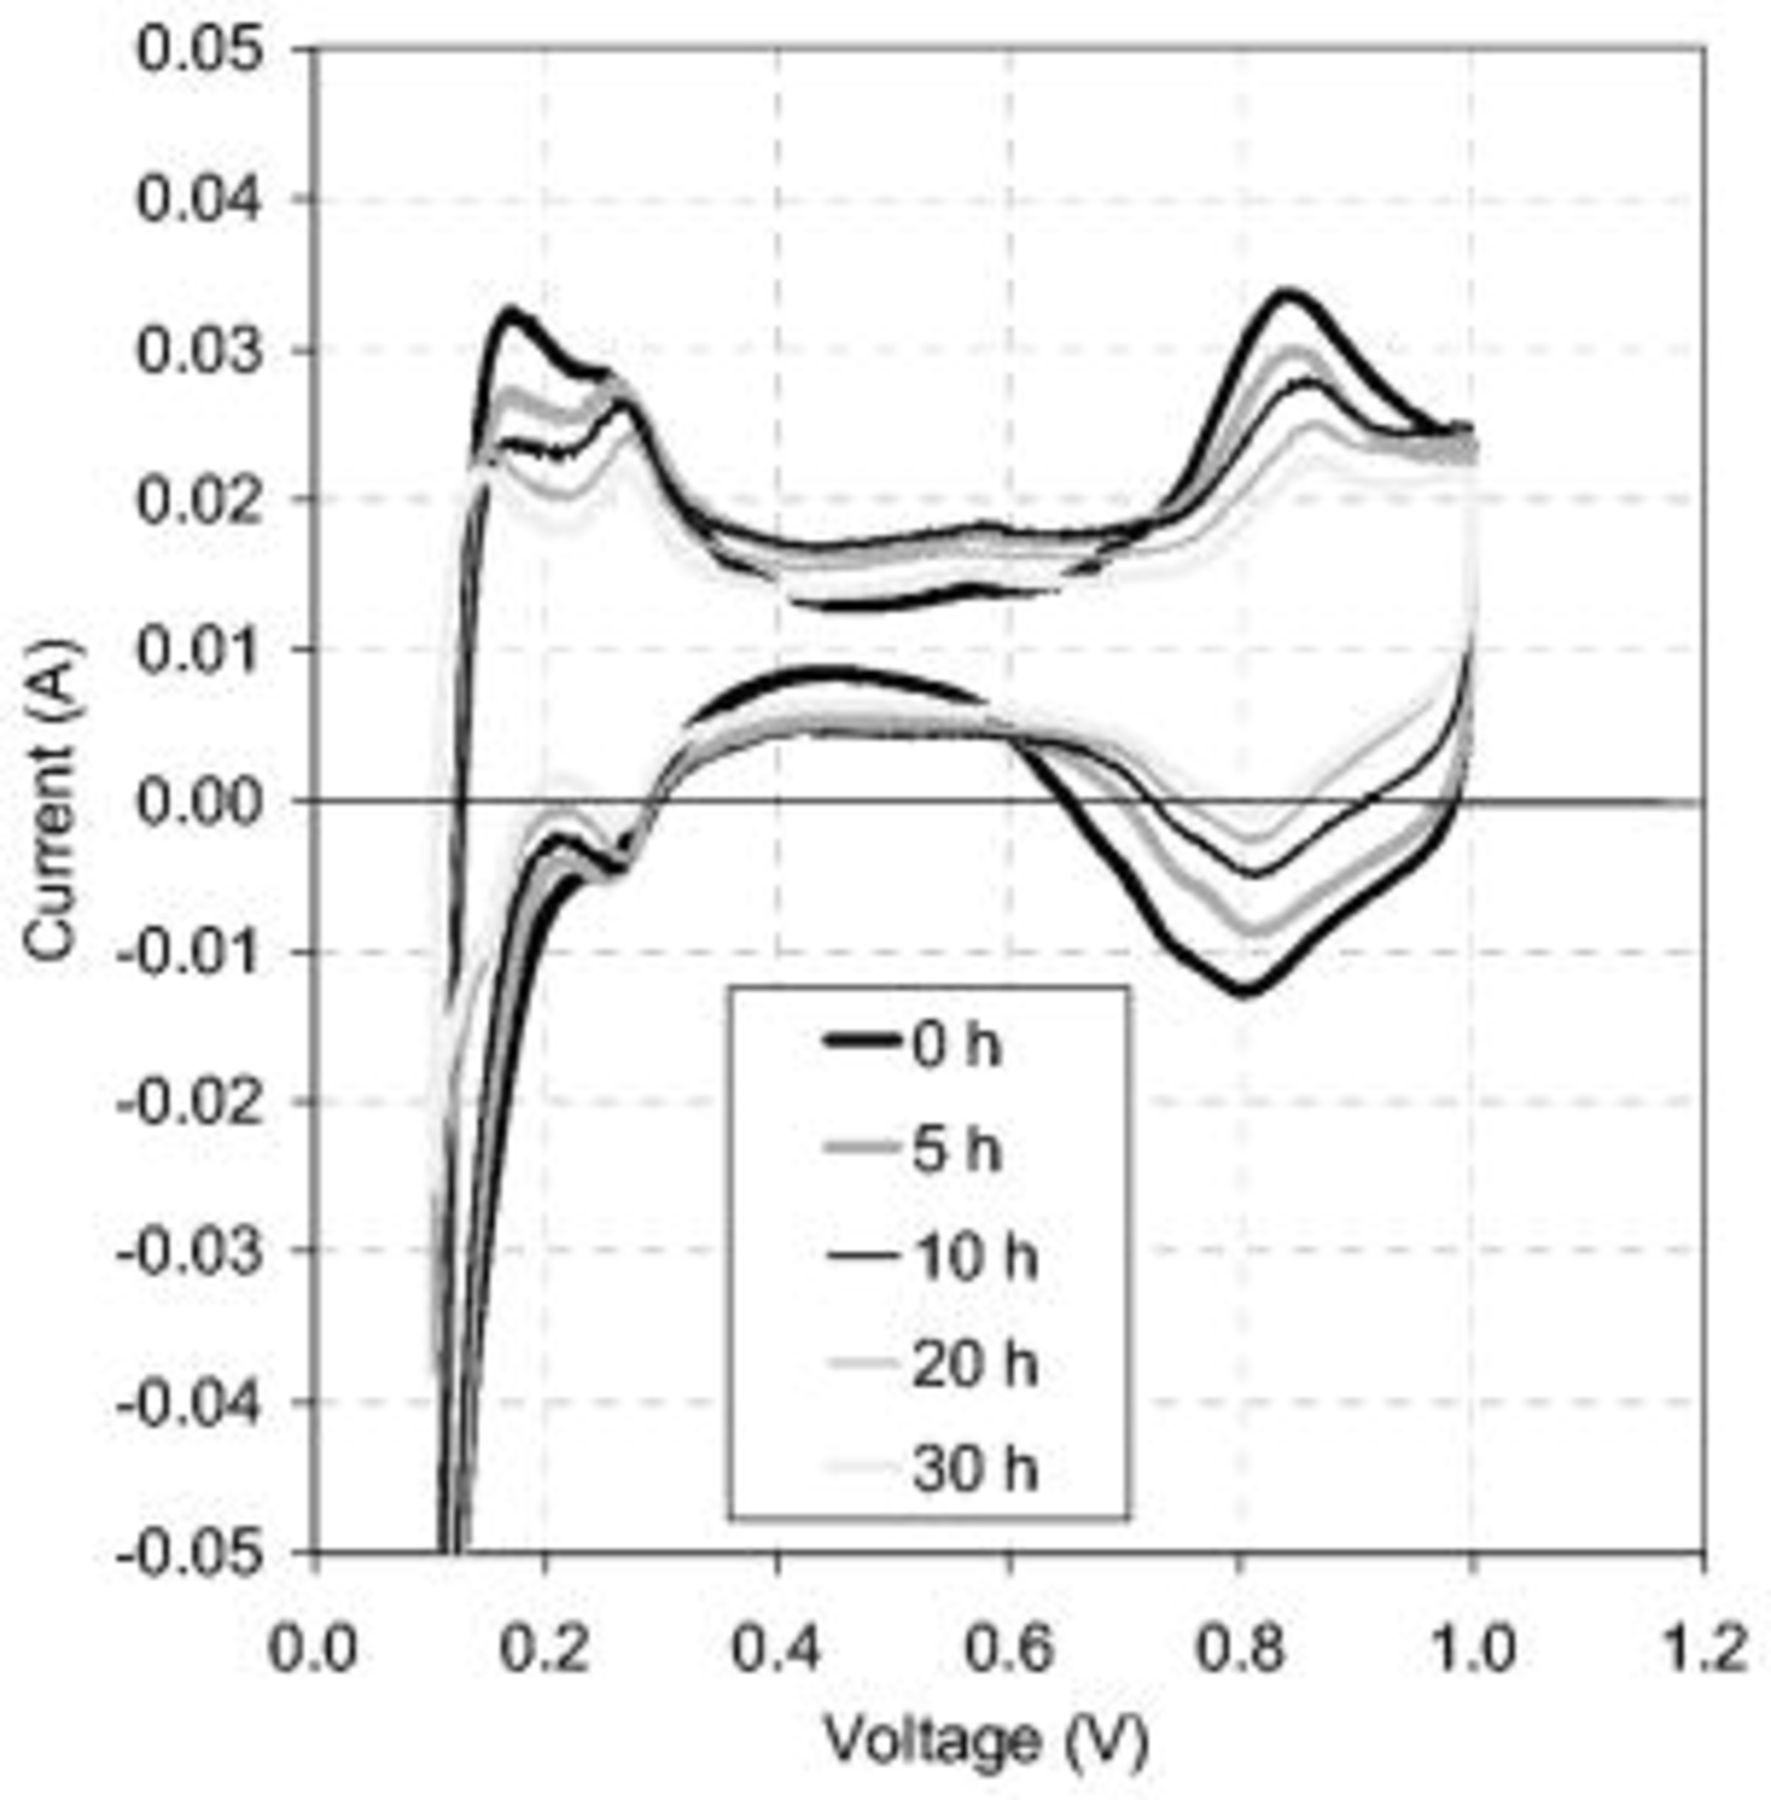
Figure 6. Cyclic voltammograms are compared over the corrosion period. The  increased over the first 10 h and then decreased over the last 20 h. The cell voltage was cycled at
  in a
in a  atmosphere at the cathode and anode, respectively. Operating conditions as in Fig. 4.
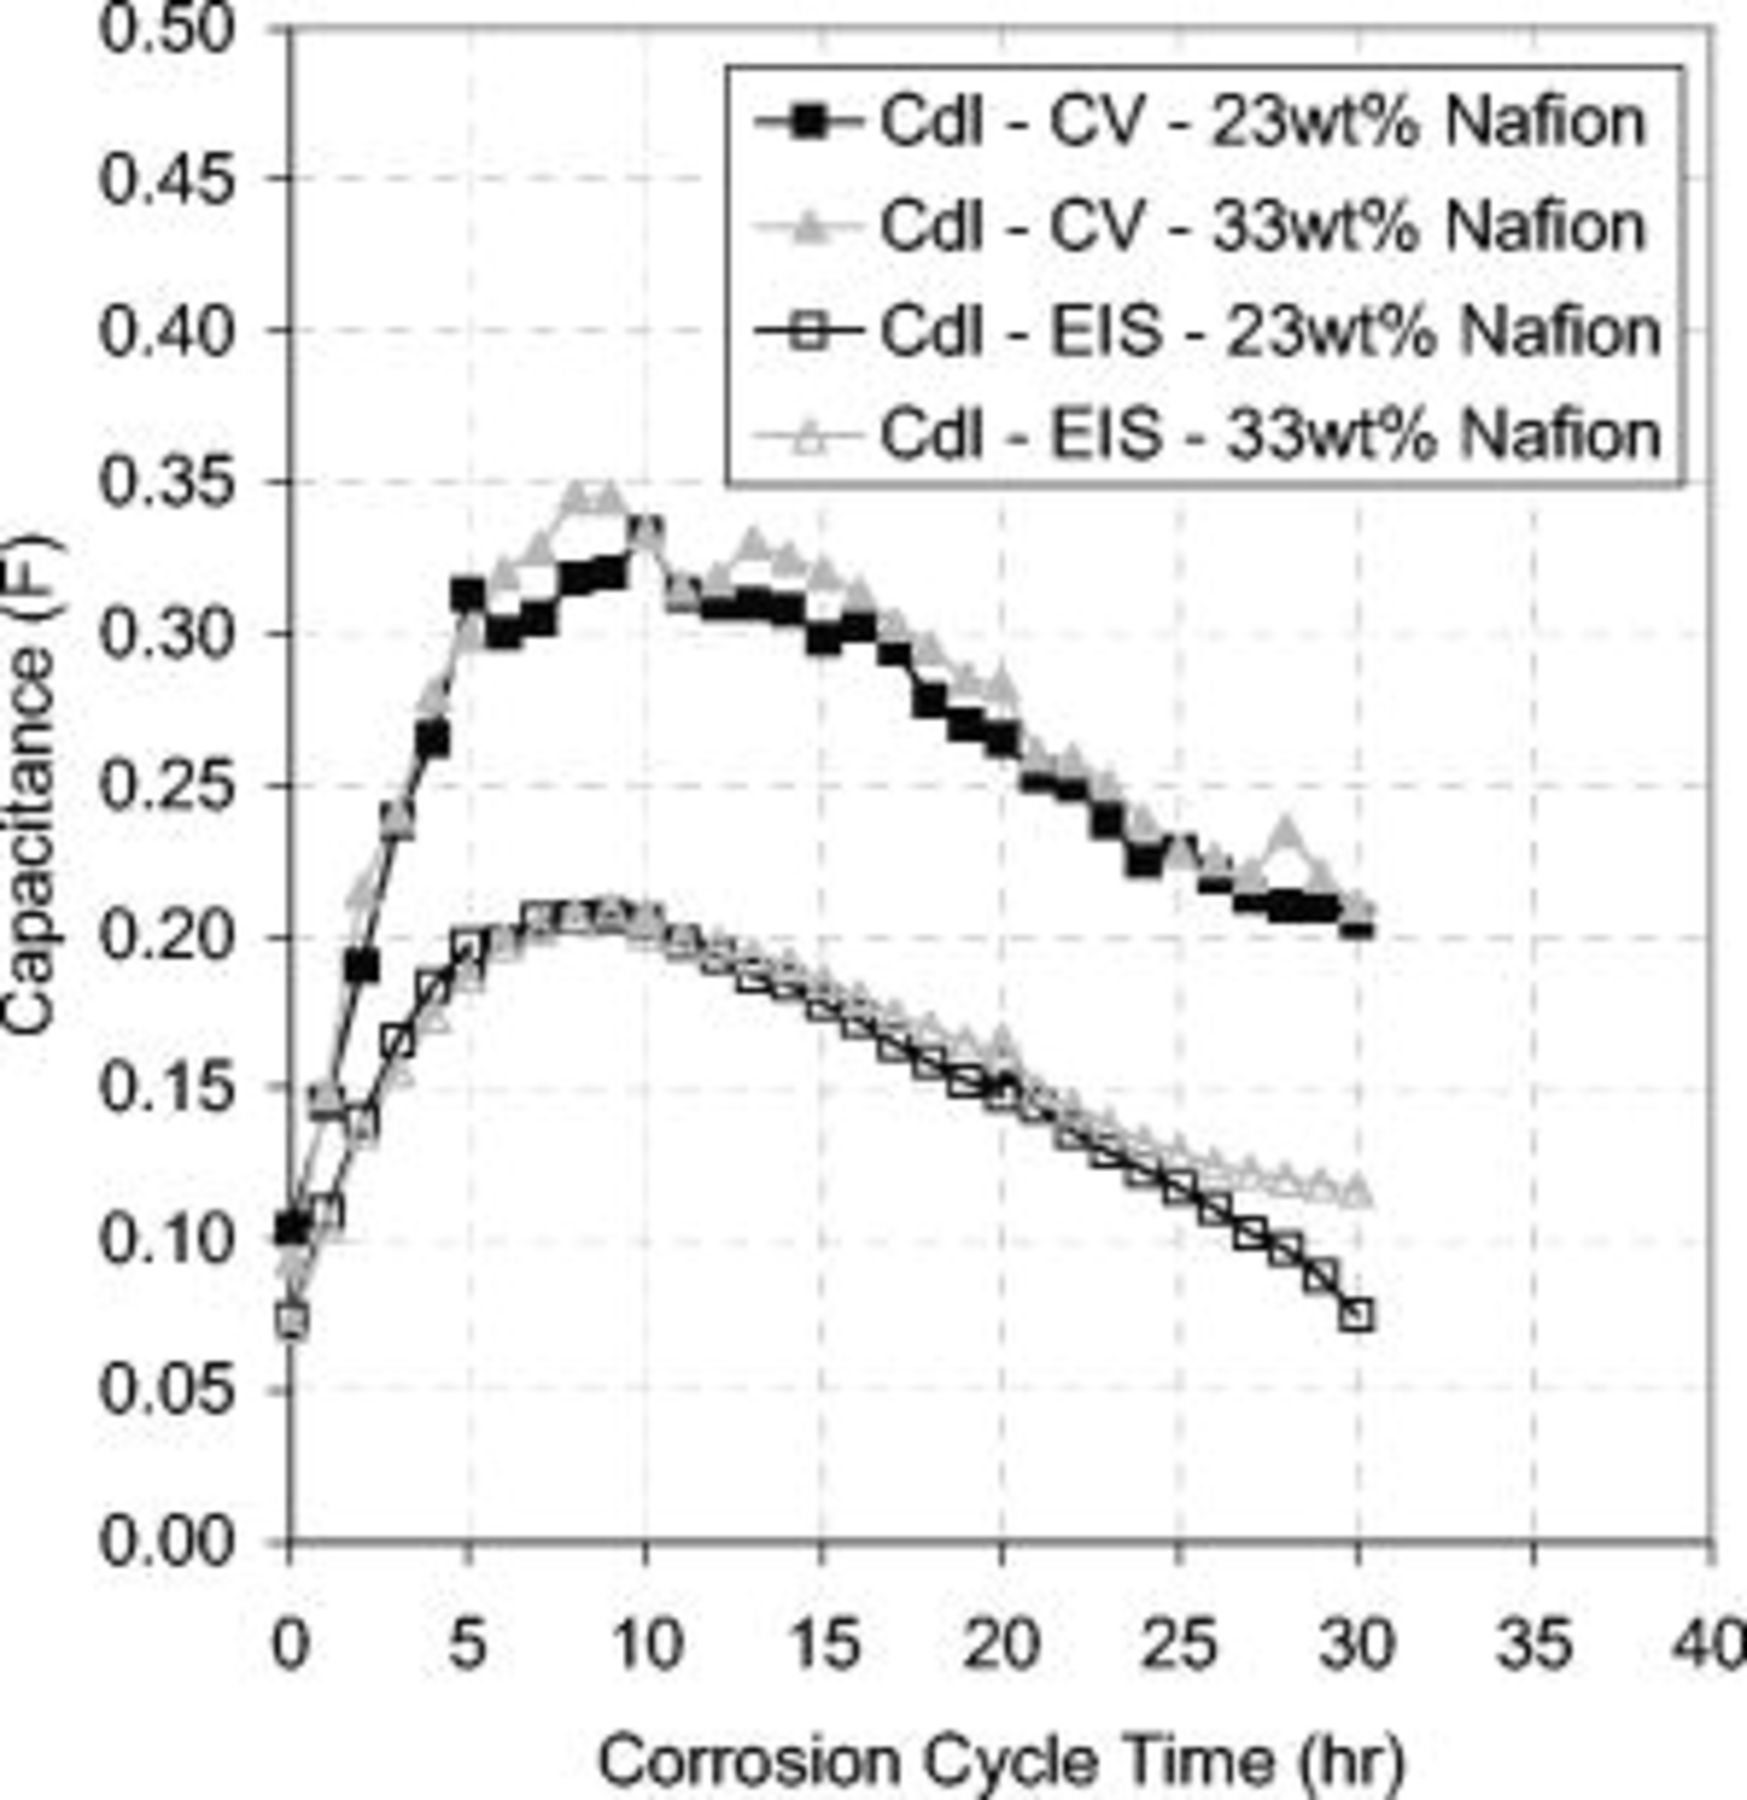
Figure 7. Change in the  over the corrosion period. Solid symbols:
  obtained from CV. Unshaded symbols:
  obtained from EIS De Levie time constant parameter. No difference between MEAs with different ionomer contents. Both measurements show the same trend with an initial increase in capacitance over the first 10 h, followed by a gradual decrease over the remaining corrosion period. The cell voltage was cycled at
  in a
in a  atmosphere at the cathode and anode. Operating conditions as in Fig. 4.
The CVs in Fig. 6 show decreased  adsorption/desorption and Pt oxide peaks over the degradation period, signifying a reduction in the platinum surface area. The first observable
  adsorption/desorption peak decreased more than the second, suggesting a preferential degradation of the Pt(110) crystal face compared to Pt(100) and Pt(111). Grgur et al.17 showed a Pt(110) crystal face to be the most kinetically active with the greatest exchange current density and, therefore, to have the greatest impact on the kinetic performance. Carbon monoxide stripping quantified this reduction in the EPSA, as shown in Fig. 8. The EPSA decreased by 56% over the corrosion period for both the 23 and 33 wt % ionomer CLs. Debe et al.18 found similar results when cycling between 0.6 and
  under a
 anode conditions. At
  , they calculated a reaction rate constant of
  , using a first-order kinetic rate model described in Eq. 4, 5

where  is the normalized EPSA,
  is the minimum normalized EPSA,
  is the rate constant, and
  is the number of cycles.
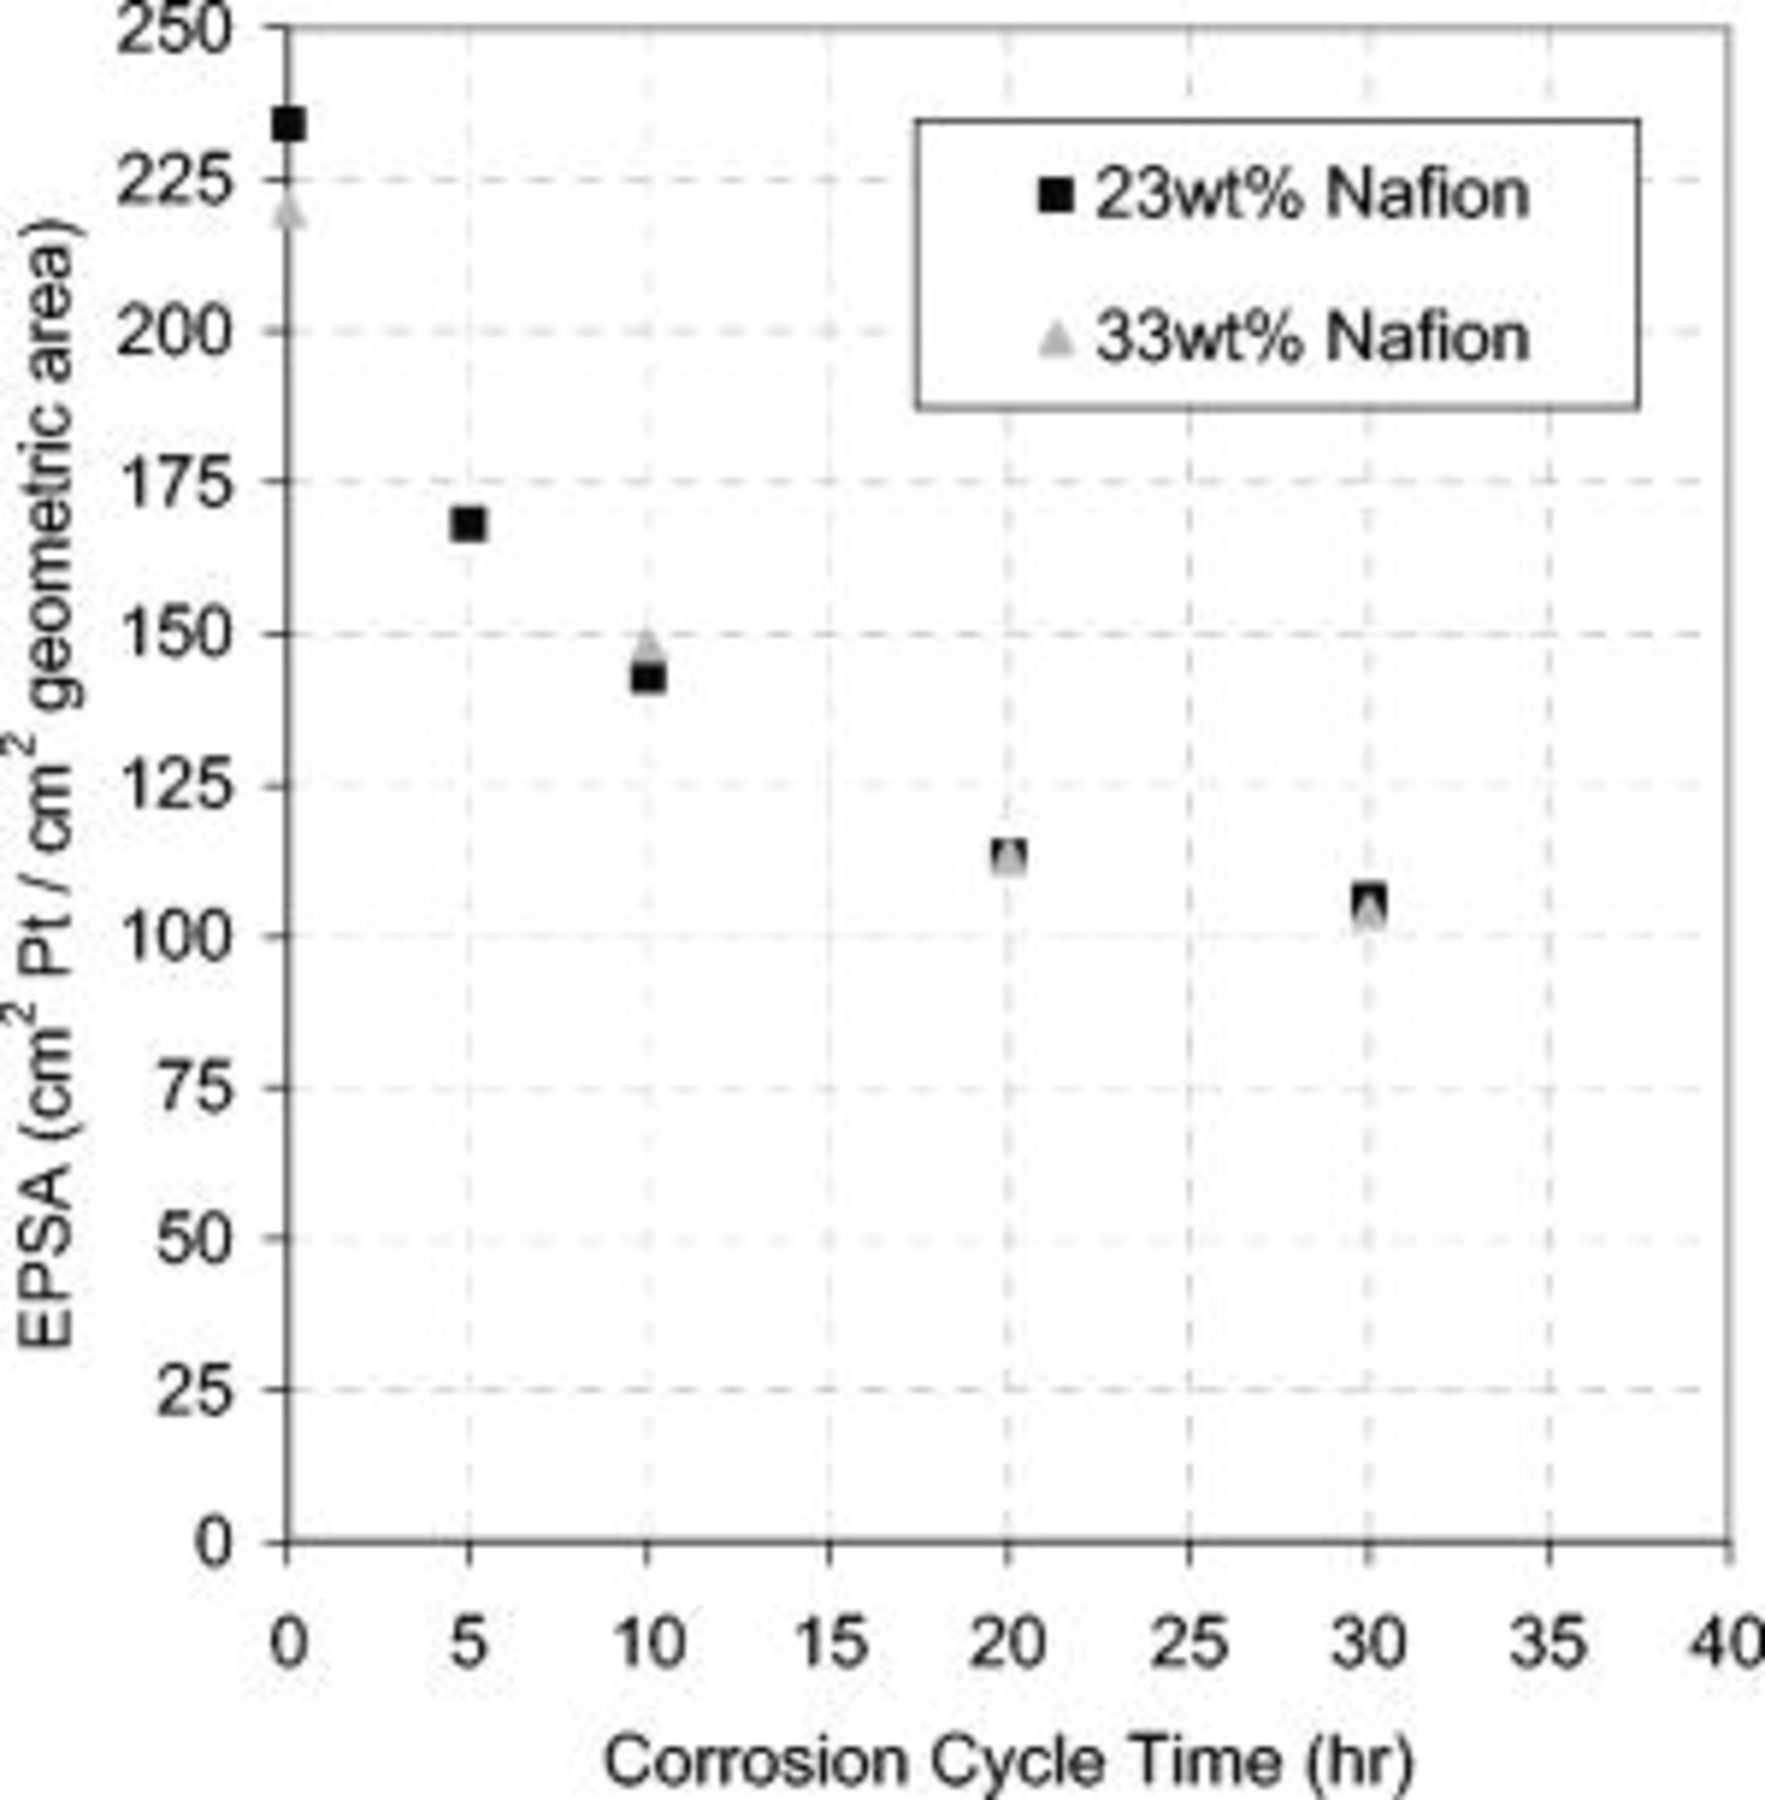
Figure 8. Decrease in the EPSA during carbon corrosion testing for both 23 and 33 wt % ionomer CLs. The cell voltage was cycled at  in a
in a  atmosphere at the cathode and anode. Operating conditions as in Fig. 4.
By plotting the left term in Eq. 5 against the number of cycles and taking the slope, the reaction rate constant was calculated for the data presented in Fig. 8. The reaction rate constant,  , was higher than Debe et al. 's results, which was expected due to the greater voltage limits of
  used for this AST.
The decrease in platinum surface area was due to varying degrees of platinum agglomeration, washout, dissolution into the membrane, and possible catalyst islanding. Catalyst islanding is defined as a lack of ionic and electronic connectivity to the electrode, rendering the catalyst inactive. Significant platinum migration into the membrane has been shown in SEM pictures5 as a bright white band in the membrane, which was not evident in this study. Some studies have shown the location of this platinum band to be a function of the hydrogen and oxygen gas crossover and therefore can be manipulated by the gas partial pressures.19, 20 The absence of platinum in the membrane in this study suggests that the AST conditions were not conducive to significant platinum migration into the membrane. Considering the catalyst was rarely exposed to voltages where Pt becomes thermodynamically unstable,21 this result was expected. The reduction in the CL thickness shows that oxidation of the carbon support caused the CL to collapse into a much denser network of platinum and ionomer with limited porosity (see Fig. 5). Therefore, the dominant mechanisms for the decreased EPSA are likely platinum agglomeration and possibly catalyst islanding. Debe et al. showed supporting X-ray diffraction data, which resulted in similar platinum peak intensities before and after a 90% EPSA loss. This signified very little change in the amount of platinum in the electrode.
EIS
It is well known that polymer electrolyte membranes require water to achieve their high proton conductivity, which is directly related to the inlet gas RH.22 Figure 9 shows experimental EIS spectra measured as a function of the nitrogen and hydrogen gas RH. The shapes of the curves were very similar; only the high frequency intercept to the real axis (HF cell resistance) increased, signifying increased membrane resistance. Also, the approximate 45° linear regions extended with lower RH, indicating increased CL ionomer resistance.
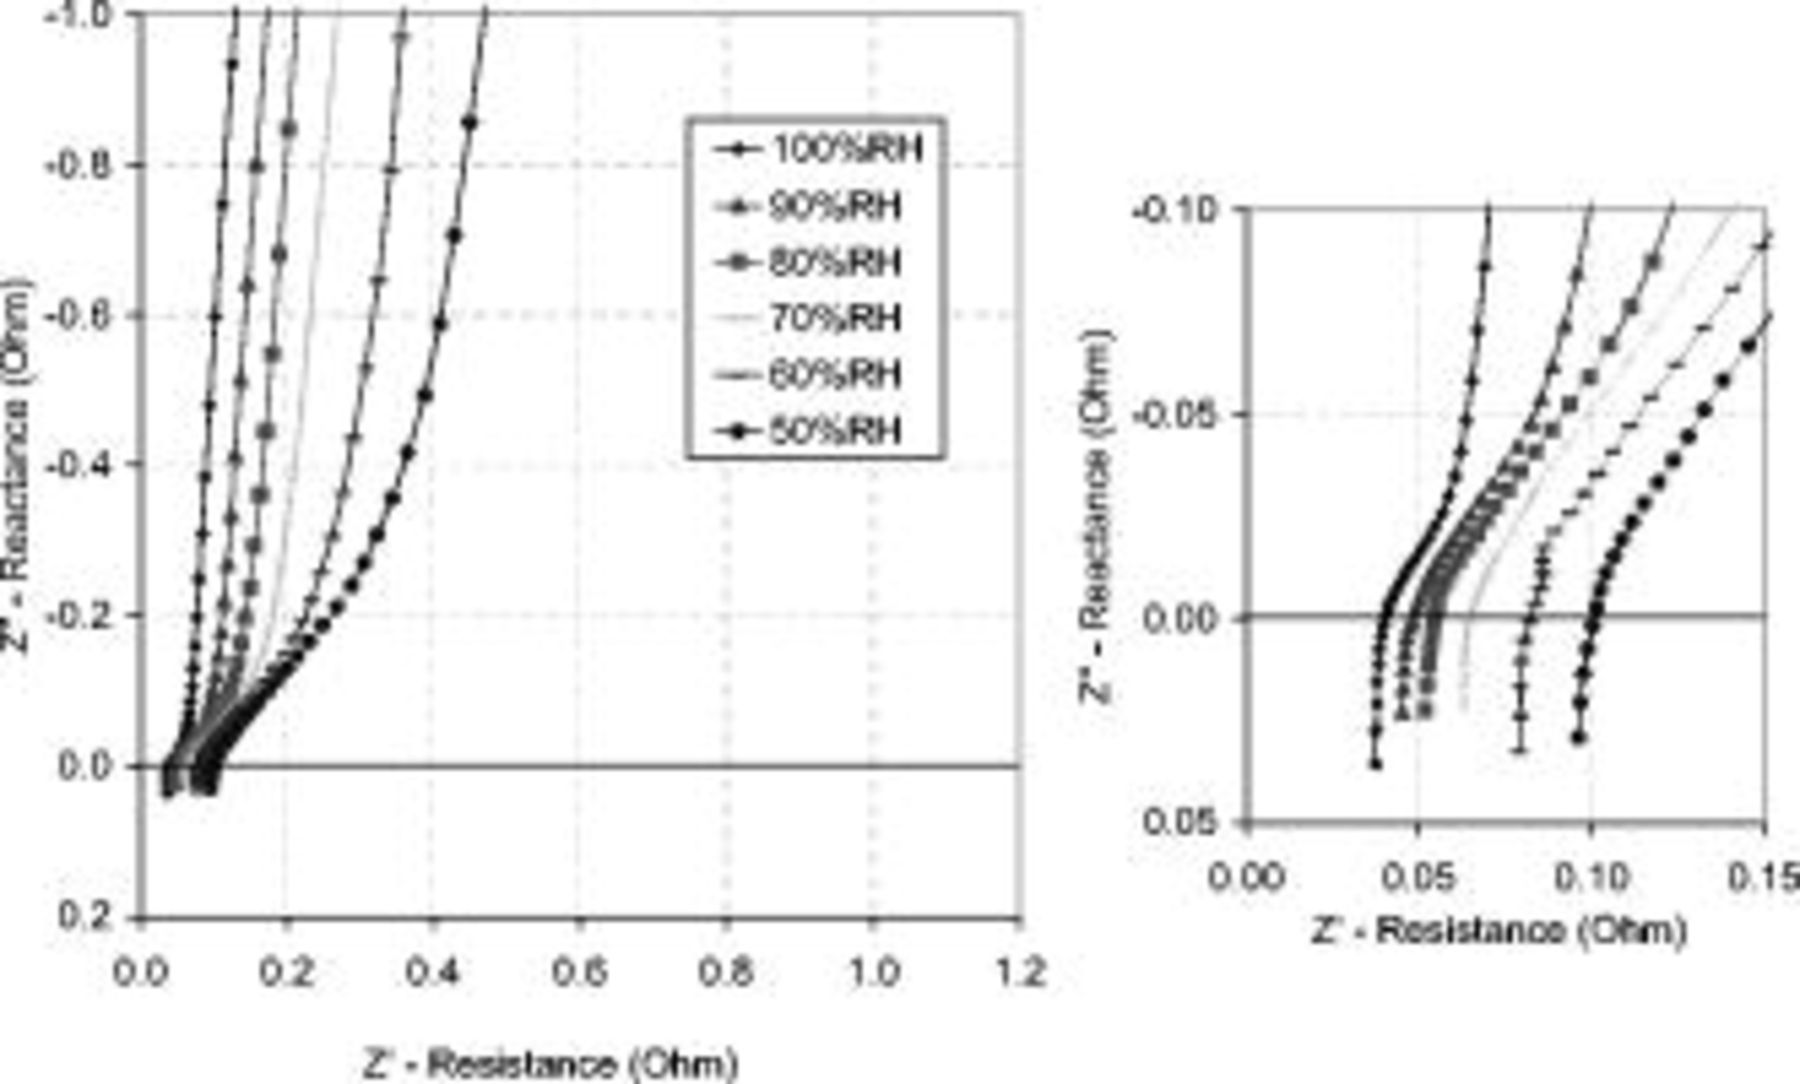
Figure 9. Effect of RH on the EIS Nyquist plot: Right side shows the high frequency intercept. As expected, decreasing the RH increased the HF cell resistance  and the CL ionic resistance
  . The positive reactance signifies an inductance
  , which is an artifact of the measurement system. EIS measurements used a 10 mV ac perturbation signal with a
  dc bias potential at a 50 kHz–0.05 Hz frequency range. Operating conditions as in Fig. 4.
The data from Fig. 9 were modeled with an equivalent circuit consisting of an inductor, resistors, and a Warburg element described above. The difference between the modeled fit in Fig. 3 and the data in Fig. 9 was noted. The experimental data showed a slight slope in the high impedance region signifying a nonideal fit to the given equivalent circuit. The equivalent circuit described in Fig. 3 assumes a network of cylindrical pores with a homogeneous diameter, as defined by the cotanh function originally described by De Levie. However, the CL is a heterogeneous porous network with varying pore shapes and sizes. Some research has shown how different pore sizes and pore shapes can alter the shape of the impedance response.23–26 The geometry can change the ratio between the  and the CL proton resistance and therefore change the shape of the Nyquist plot. This can explain deviations that occur between the experimental data and the model fit.
Several published models27–29 have used Bruggeman's relationship to describe the proton conductivity in the porous CL, as defined by Eq. 6

where σ is the conductivity (S/cm), ε is the ionomer volume fraction, and τ is the tortuosity factor equal to 1.5.
Based on this relationship, decreasing the ionomer volume fraction decreases the CL ionomer conductivity. This is demonstrated in Fig. 10, comparing the CL ionomer conductivity between the 23 and 33 wt % ionomer MEAs. The ionomer volume fraction was calculated based on the known amounts and densities of carbon  , platinum
  , and ionomer
  in the CL and the CL thickness measured from the SEM analysis. The ionomer volume fractions for the 23 and 33 wt % CLs were 0.10 and 0.17, respectively. The experimental values follow Bruggeman's relationship very well using a tortuosity factor equal to 1.5, except in the oversaturated gas humidity condition where the model deviates from the experimental data. In oversaturated conditions, several factors may contribute to the deviations shown in Fig. 10. Ionomer swelling due to increased water uptake can change the CL ionomer volume fraction and tortuosity and may change the pore shape and size distribution sufficiently to introduce greater deviation from the ideal equivalent circuit data fit. Liquid water alone may also contribute to the proton conductivity in the CL.
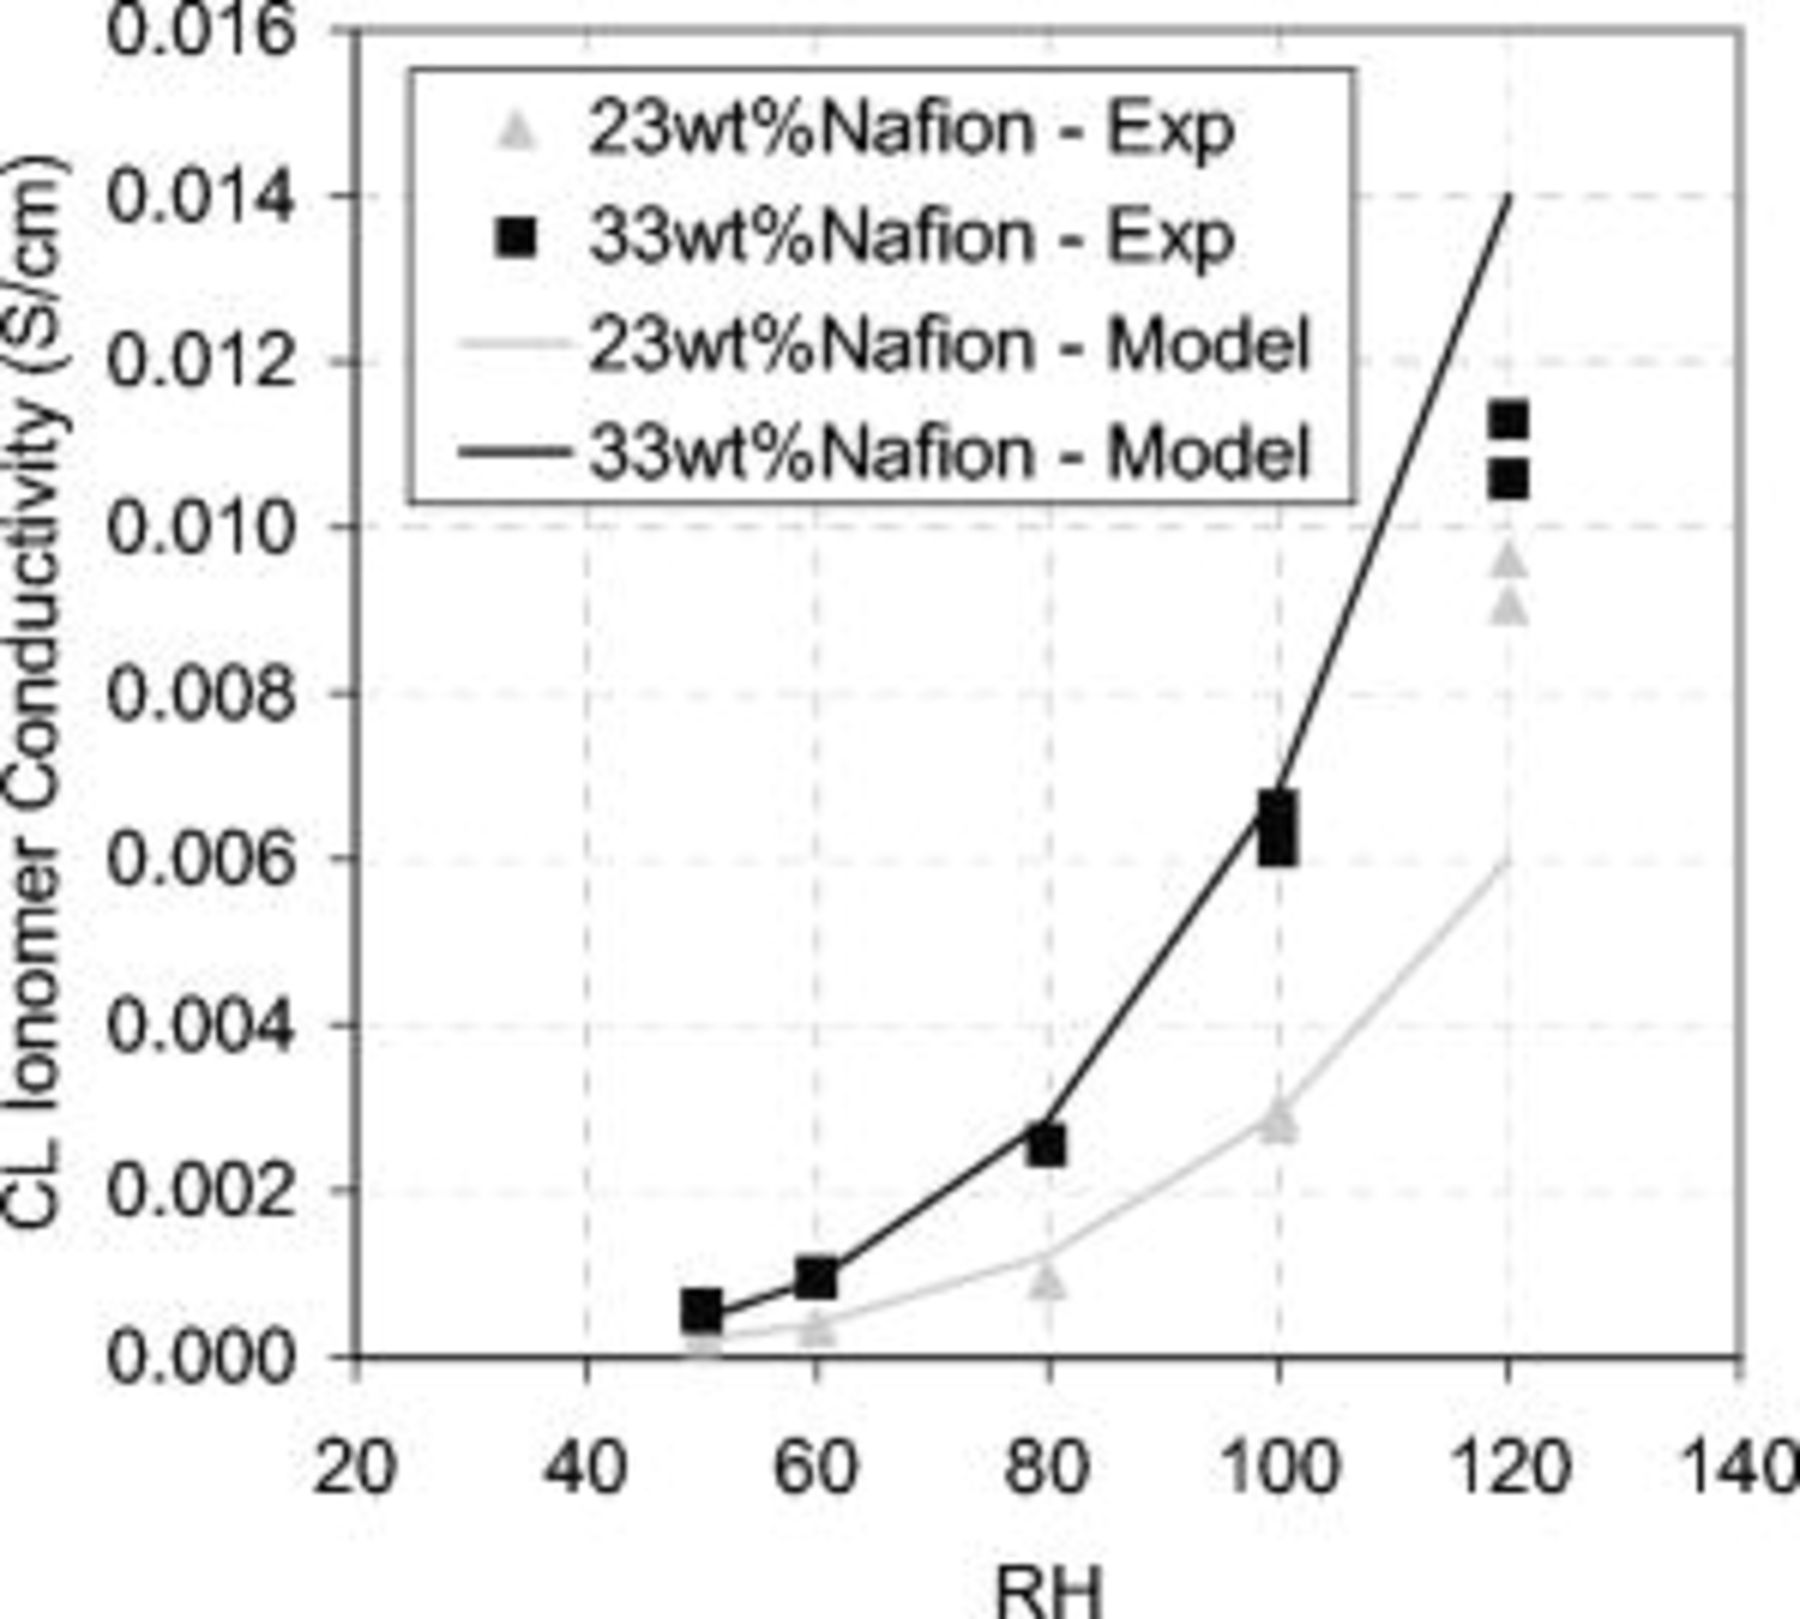
Figure 10. CL ionomer conductivity derived from the CL ionic resistance  for 23 and 33 wt % Nafion content. Values were calculated using the CL thickness measured by the SEM. Symbols represent experimental data; lines represent model fit to Bruggeman's relationship4 with a tortuosity of 1.5, and based on bulk conductivity values from Zhou et al.22 EIS measurements were performed using a 10 mV ac perturbation signal at a
  dc bias potential at a 50 kHz–0.05 Hz frequency range. The cell operating conditions were
  , 30 psig, and 25 slpm flow rates with varying gas humidity.
Makharia et al.13 used similar EIS methods under current operation to measure the resistances in the cell. The HF cell resistance  was similar; however, because Makharia used different ionomer contents, the CL ionomer resistance could not be directly compared. Makharia had 7 and 15 vol % ionomer resulting in 240 and
  , respectively. This study had 10 and 17 vol % ionomers resulting in 256 and
  , respectively. Given the greater ionomer contents in this study, these values are higher than Makharia's, which could be caused by the different CL structure (GDE vs CCM), the lower temperature (70 vs
  ), or the test method (without and with current operation).
The HF cell resistance and CL ionomer resistance were measured by EIS every hour (20 cycles) during the AST and every 10 h as part of the full diagnostic testing (see Fig. 11). Under the AST conditions, both the 23 and 33 wt % ionomer MEAs exhibited the same trends, where the catalyst ionomer resistance and HF cell resistance increased. This increase was likely due to loss of water from carbon and water oxidation.1–3 After the SS diagnostic testing, the MEA rehydrated and the resistance decreased, as shown by the discontinuities at 10 and 20 h in Fig. 11. The rate of resistance increase during the AST increased with greater degradation. This suggests either (i) an increase in the reaction rate of carbon and water oxidation or (ii) less water in the catalyst and membrane layers.
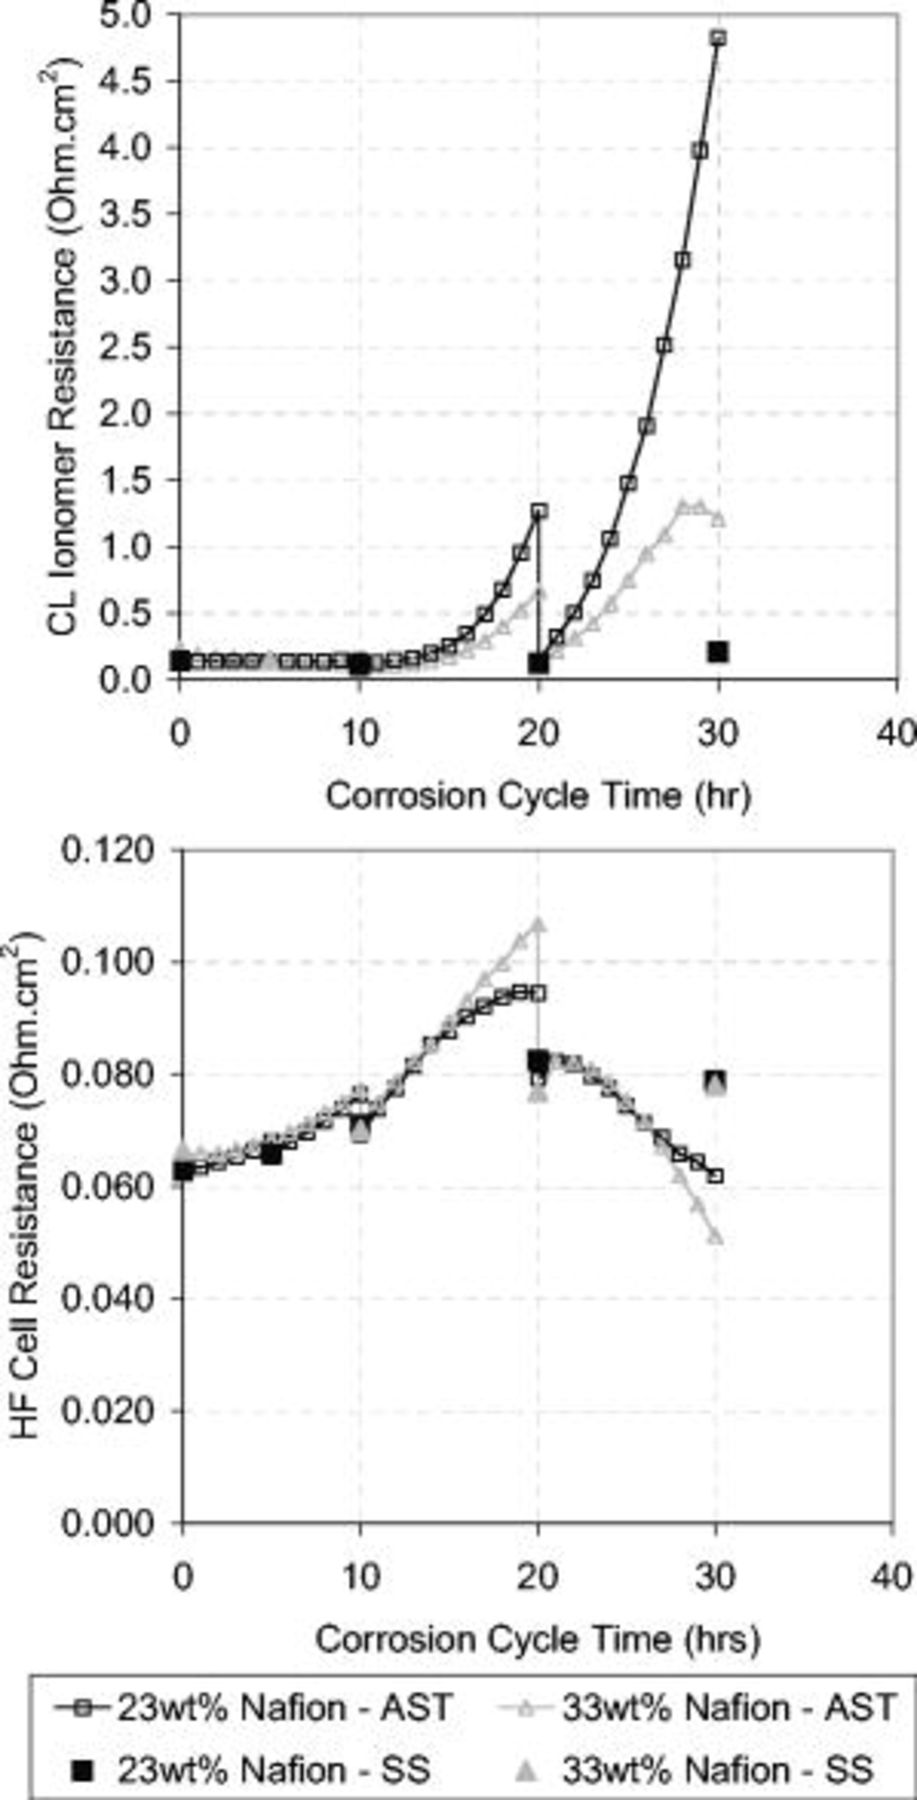
Figure 11. Comparison of EIS resistance measurements performed during the AST (AST, every 1 h; open symbols) and the SS diagnostics (SS, every 10 h; closed symbols). Top graph: CL ionomer resistance. Bottom graph: HF cell resistance. EIS measurements used a 10 mV ac perturbation signal with a  dc bias potential at a 50 kHz–0.05 Hz frequency range. The cell operating conditions were
  , 30 psig, 0.3 slpm (AST), and 25 slpm (SS) flow rates with oversaturated gas humidity.
After 20 h of the corrosion AST, the HF cell resistance measured during the AST started to decrease. The reason for this was not verified; however, it is speculated that this decrease was caused by the compaction of the MEA due to the degradation of the cathode CL and carbon sublayers.
Figure 12 shows the impedance spectra at 0 h and after 30 h of corrosion cycling. Unlike in Fig. 9, the shapes of the curves are different. This may signify a different pore shape and size distribution, as discussed previously.
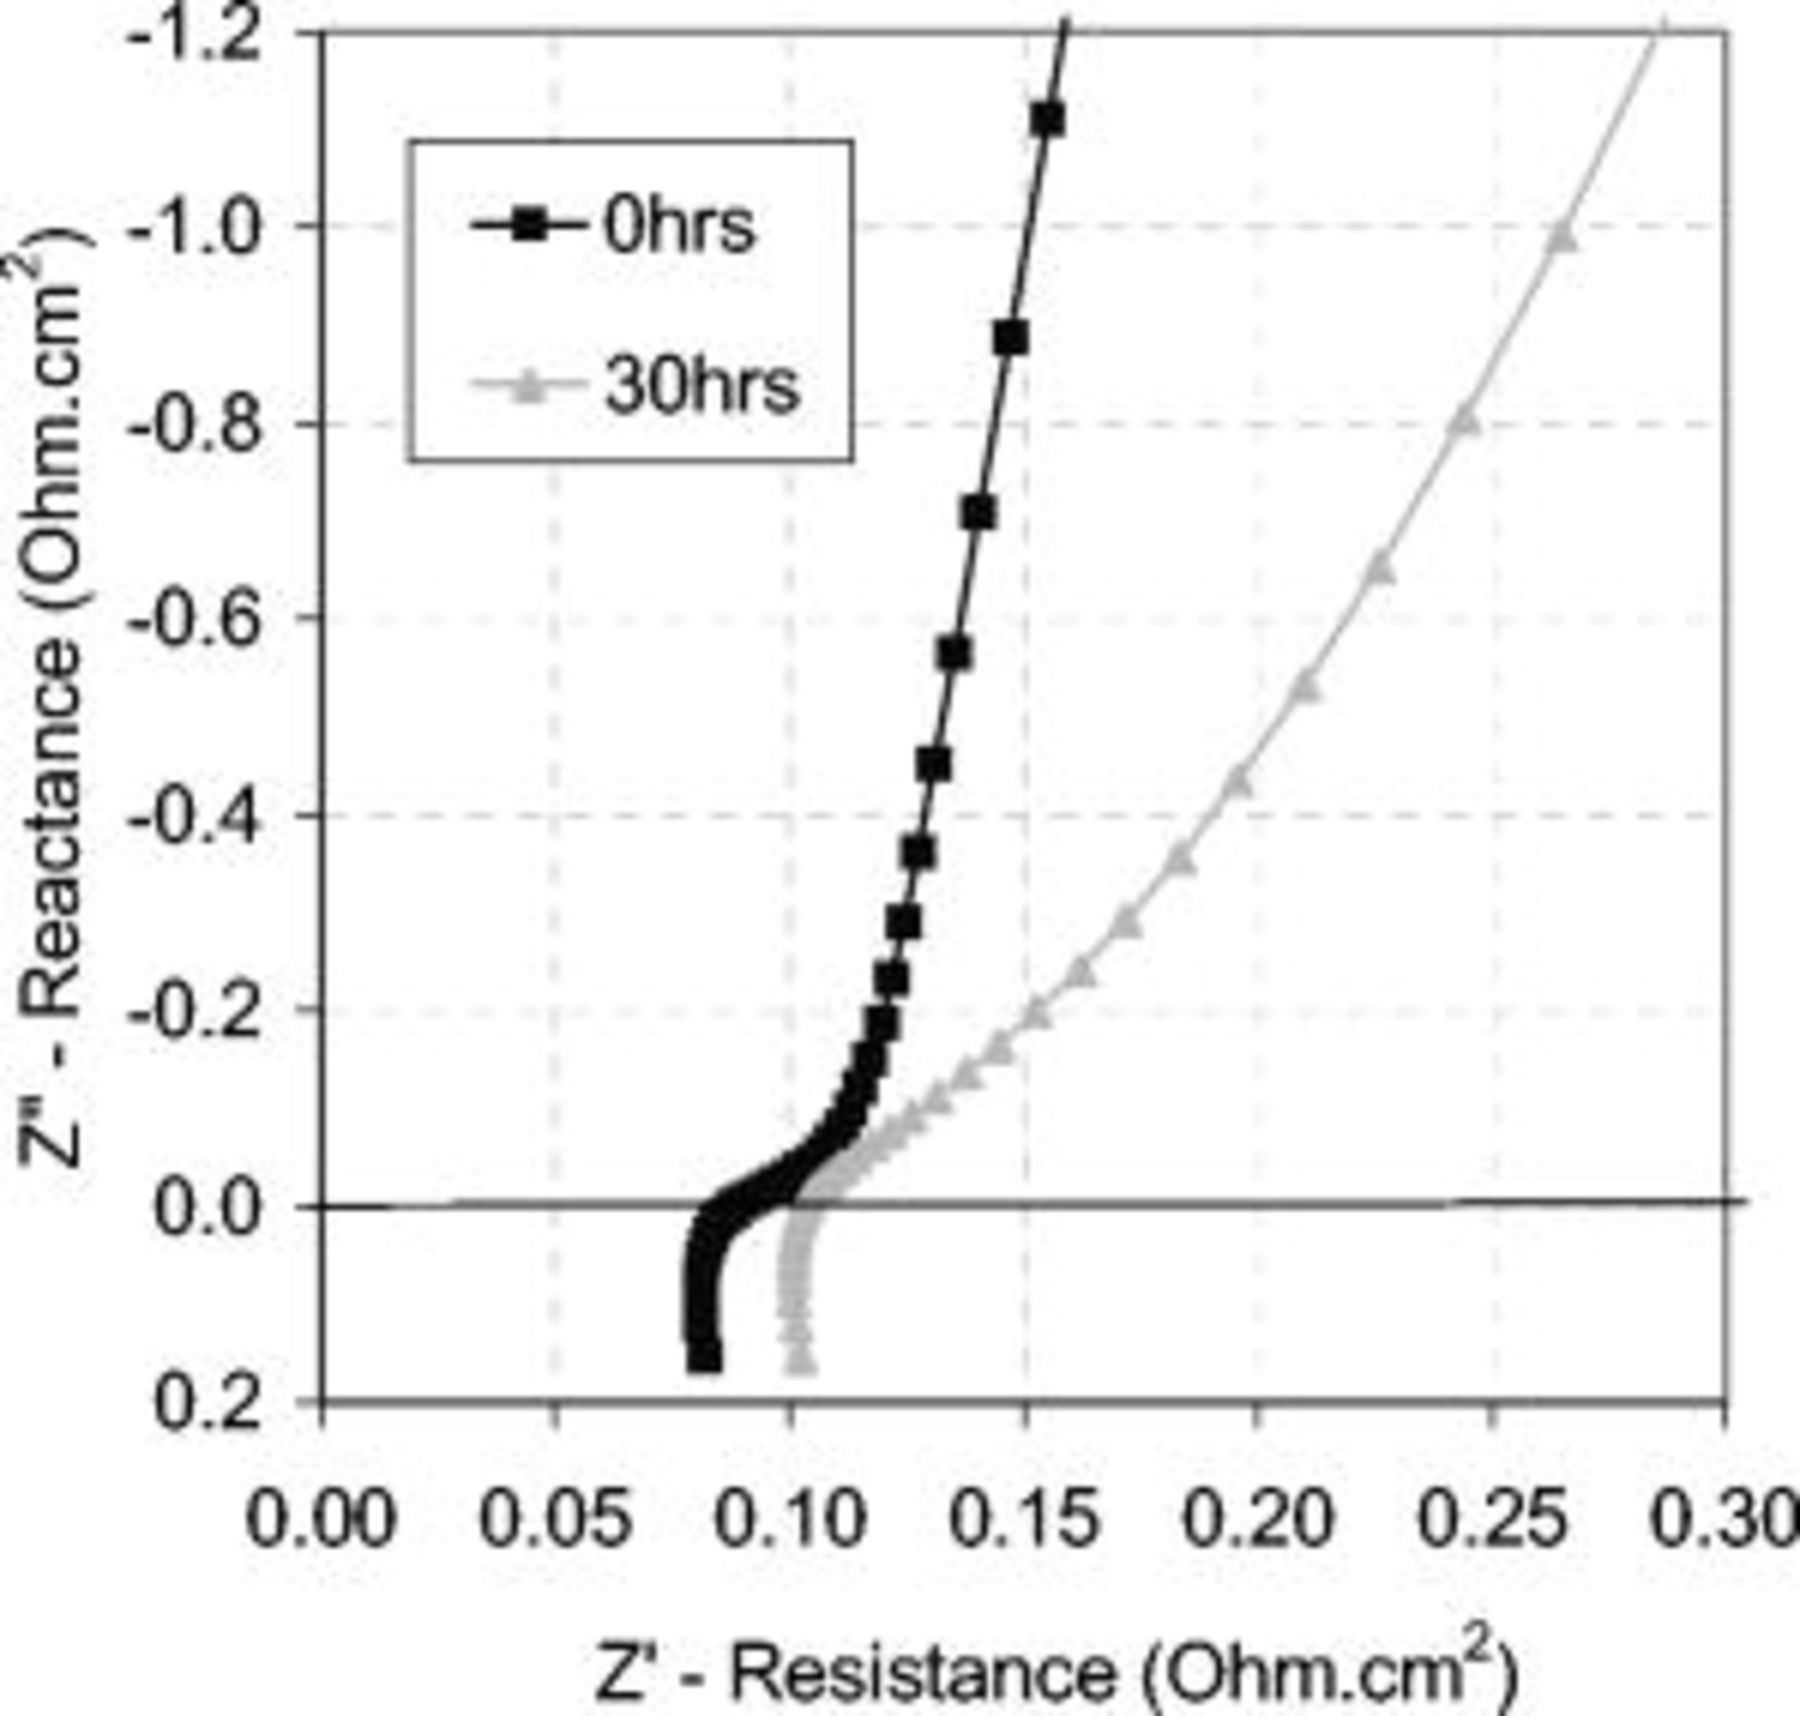
Figure 12. Impedance spectra taken at 0 and 30 h of corrosion cycling show an increase in the cell resistance at the high frequency intercept of the  axis, an increase in the CL ionomer resistance, and a change in the shape of the curves. Keiser et al. showed how pore shape can alter the impedance characteristic,23 so the change in the low frequency region could reflect changes in the pore structure of the CL. EIS measurements used a 10 mV ac perturbation signal with a
  dc bias potential at a 50 kHz–0.05 Hz frequency range. The cell operating conditions were
  , 30 psig, and 25 slpm flow rates with oversaturated gas humidity.
The HF cell resistance measured under SS conditions increased over the degradation period and was most evident at subsaturated gas RH, as shown in Fig. 13. This occurred with both 23 and 33 wt % ionomer catalyst structures. The HF cell resistance can increase by the following mechanisms: (i) loss of carbon decreasing electronic connectivity between carbon particles, making the CL more electrically tortuous, (ii) decreasing ionic connectivity between catalyst particles and membrane, (iii) increased interface resistance due to layer separation/delamination caused by carbon loss, and (iv) contaminants released from the carbon support oxidation could bind to the membrane sulfonic acid sites via a cation exchange process. This last mechanism would decrease the ion exchange capacity and lower the water content in the membrane.30 The hardware compression sensitivity showed that the cell performance became more sensitive to compression over the corrosion period. SEM pictures showed the disappearance of the carbon sublayer over the 30 h corrosion period. Both results support mechanism (iii).
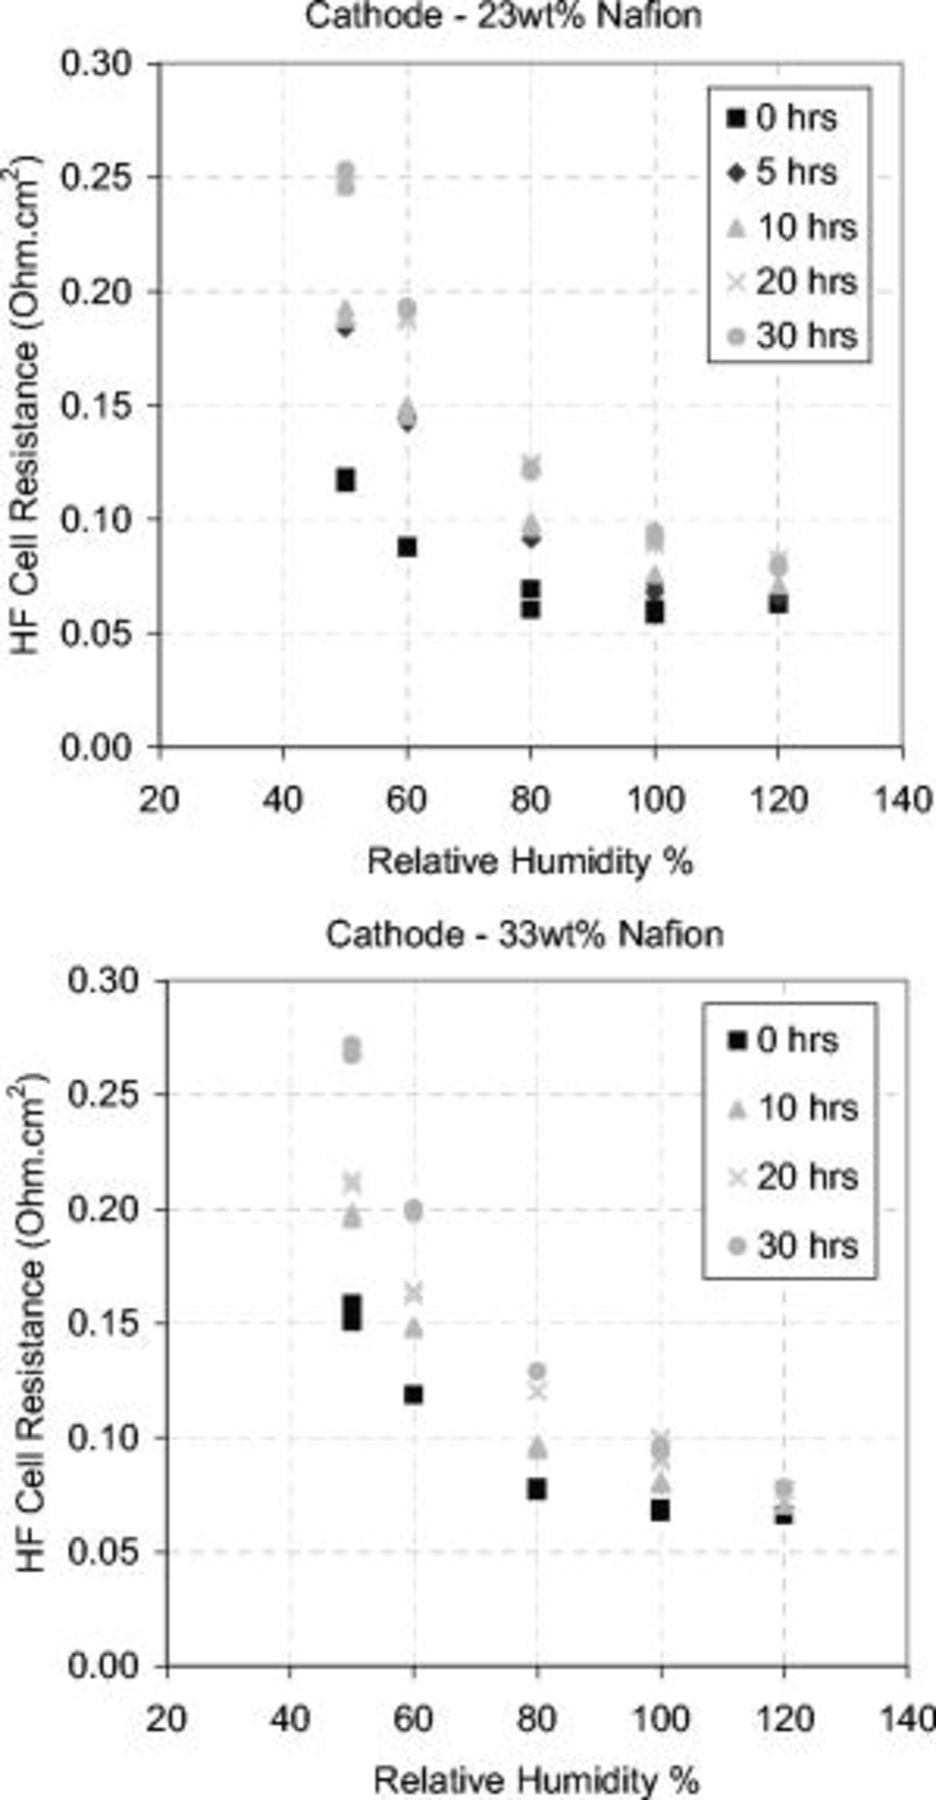
Figure 13. HF cell resistance vs RH over the corrosion period. Top graph: 23 wt % Nafion cathode. Bottom graph: 33 wt % Nafion cathode. Both MEAs showed an increase in the HF cell resistance over the 30 h degradation period. EIS measurements used a 10 mV ac perturbation signal with a  dc bias potential at a 50 kHz–0.05 Hz frequency range. Operating and EIS conditions as in Fig. 12.
Under SS conditions, Fig. 14 shows that both the 23 and 33 wt % ionomer CLs decrease in ionomer resistance over the AST period. The effect was greater in the 23 wt % ionomer CL because this MEA started out with a higher resistance due to its lower ionomer volume fraction. However, both MEAs reached a very similar proton resistance after 30 h of corrosion cycling. As the carbon support corroded, the CL lost its structural integrity and collapsed. This reduced the porosity of the CL and created a very thin compact layer of ionomer and platinum. The ionomer volume fraction increased and the resistance decreased, changing the CL ionomer conductivity.
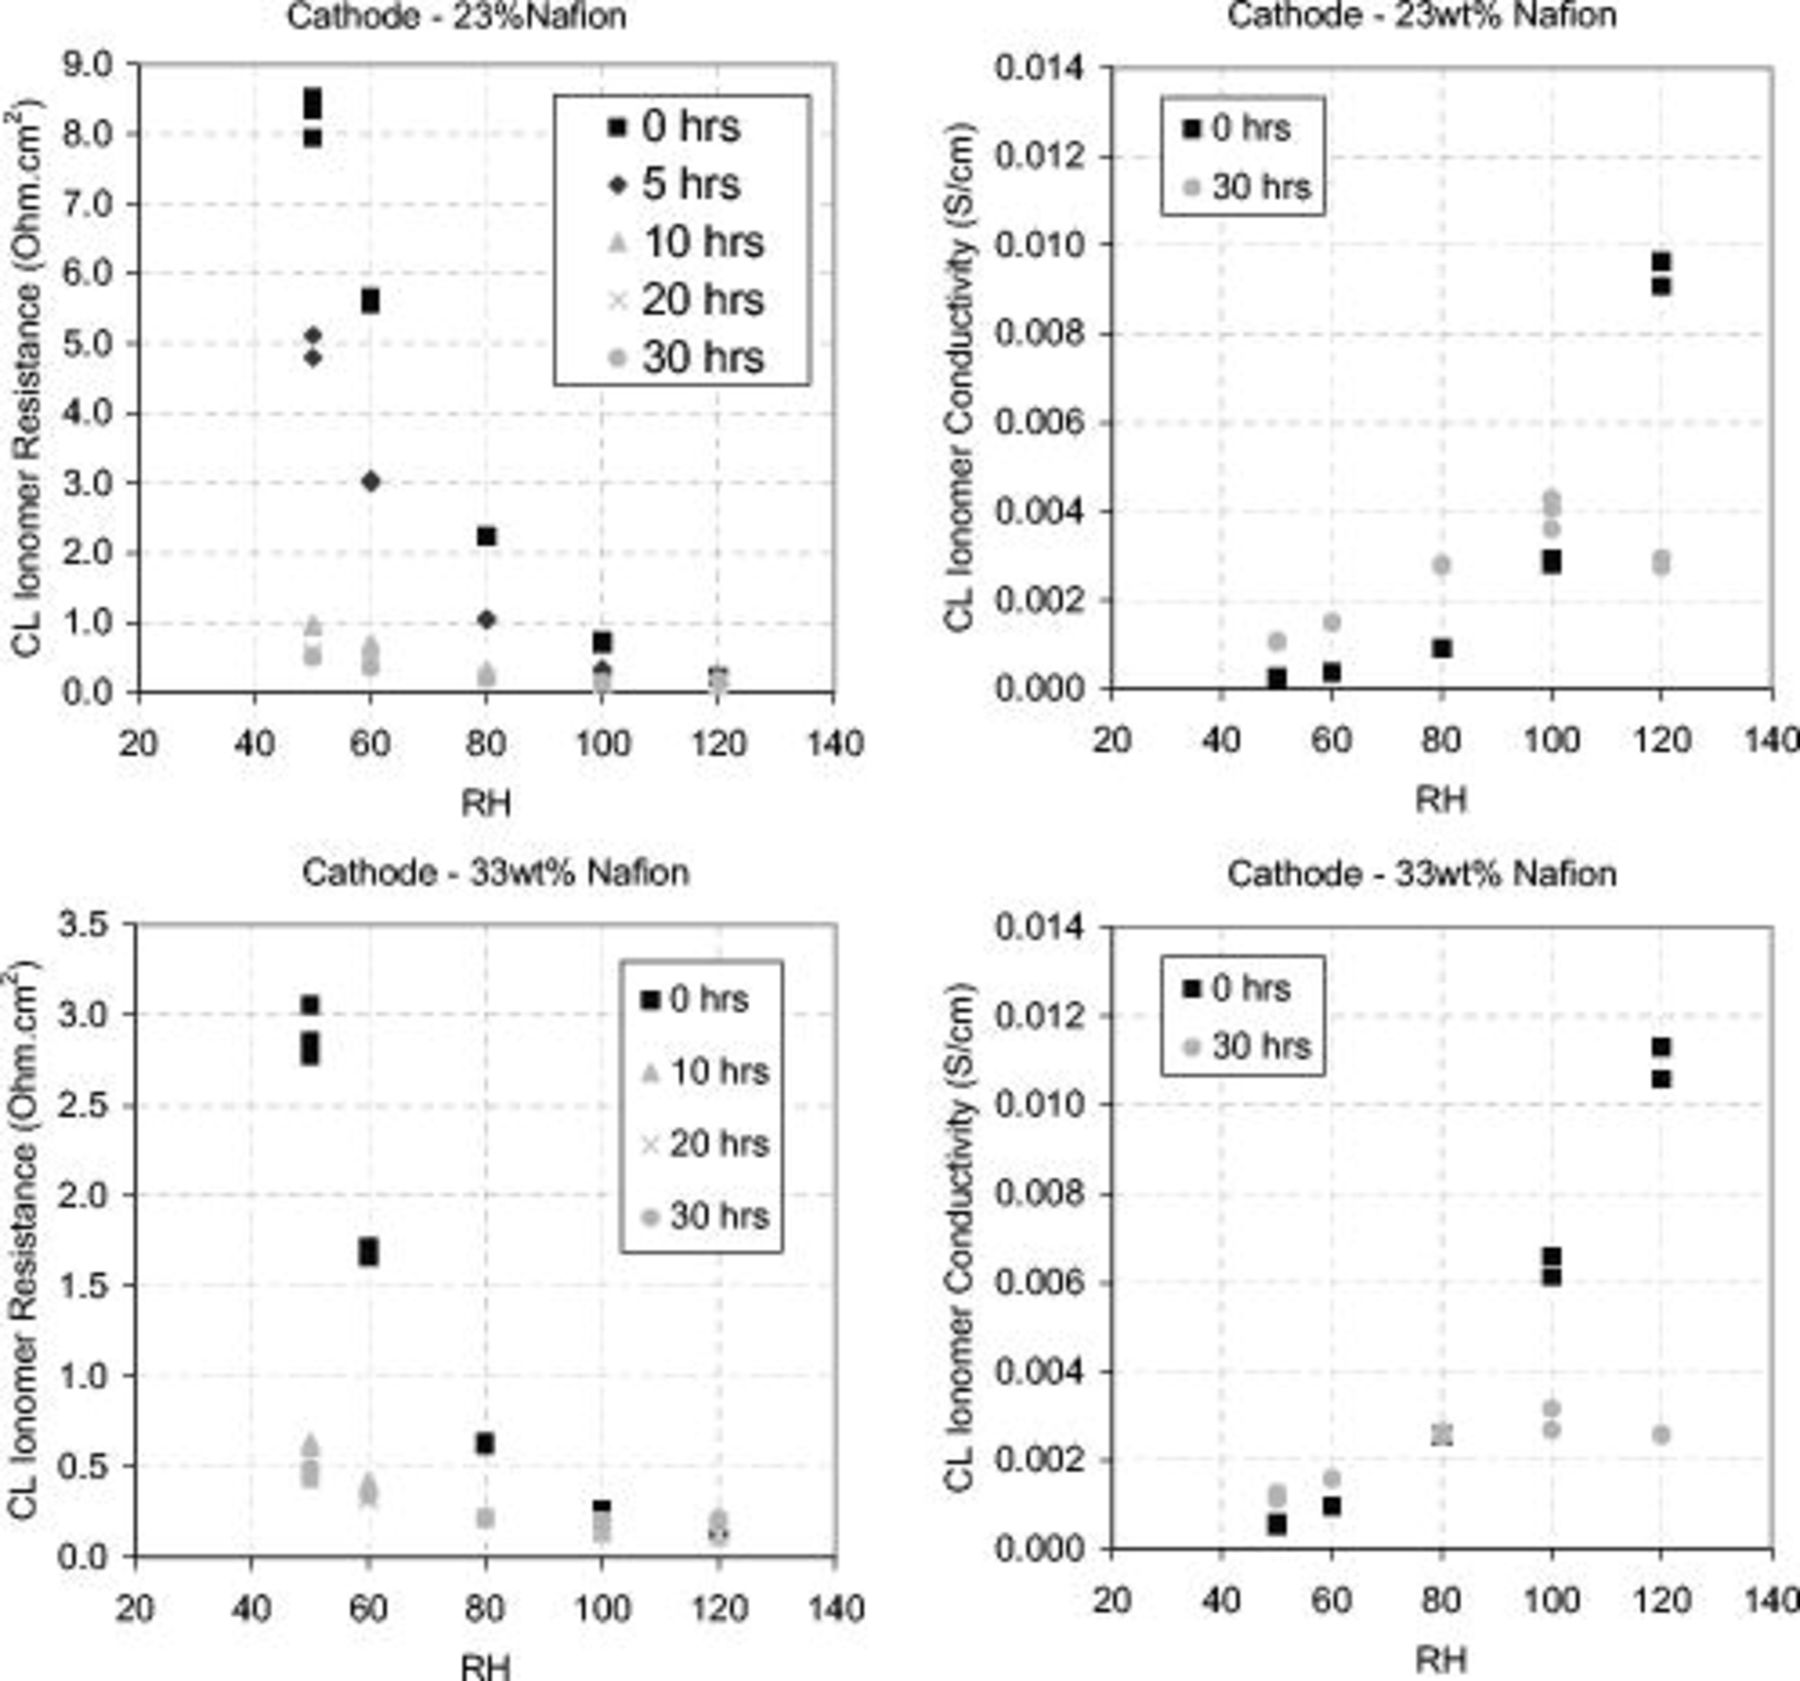
Figure 14. Changes in CL resistance and CL conductivity over the corrosion period as a function of gas RH. Left graphs: cathode CL ionomer resistance. Right graphs: CL ionomer conductivity. Top graphs: 23 wt % Nafion cathode. Bottom graphs: 33 wt % Nafion cathode. Both CLs decrease in ionomer resistance as expected due to reduced CL thickness. Ionomer conductivity (calculated using CL thicknesses at 0 and 30 h) increases in undersaturated gas humidity conditions and decreases in oversaturated gas humidity conditions over the corrosion 30 h corrosion period. Operating and EIS conditions as in Fig. 12.
Figure 14 shows the conductivity of the 23 and 33 wt % ionomer CLs at 0 and 30 h of corrosion cycling. At subsaturated humidification the conductivity increased over the corrosion period; however, at saturated humidification the conductivity decreased. The increased conductivity under subsaturated conditions can be explained by the compaction of the CL and increased ionomer volume fraction. The decrease in conductivity at saturated conditions suggests a significant change in the water management. Assuming that the equivalent circuit and model fitting were valid, it is hypothesized that the decrease in conductivity at saturated conditions was a result of the inability of liquid water to penetrate and humidify the CL due to the collapsed platinum/ionomer CL structure.
The corrosion of the carbon in the sublayer would leave a porous Teflon network. Similar to GoreTex material, the degraded structure blocks liquid water but is porous enough to allow water vapor to diffuse and humidify the layer. GoreTex is made of a hydrophobic porous Teflon material,31 which repels liquid water but allows smaller water vapor molecules to pass through and remain breathable. This hypothesis is supported by the polarization analysis.
Polarization analysis
Air and oxygen polarization curves were completed with saturated (100%) gas RH, at periodic intervals over the corrosion AST for both 23 and 33 wt % ionomer structures. Despite the increased CL ionomer conductivity in the 33 wt % ionomer CL, both CL structures demonstrated similar performance and performance degradation. Figure 15 shows the oxygen and air polarization curves for the 23 wt % CL after 0, 10, and 30 h of corrosion. An operating ohmic resistance of  was obtained from the saturated oxygen voltage performance. Without any mass-transport limitations, the operating ohmic resistance is expected to be the summation of the membrane resistance, cell electrical resistance, and 1/3 of the total CL ionomer resistance.13 This was verified by summing the EIS HF cell resistance
  and 1/3 of the CL ionomer resistance
  for a total of
  .
.
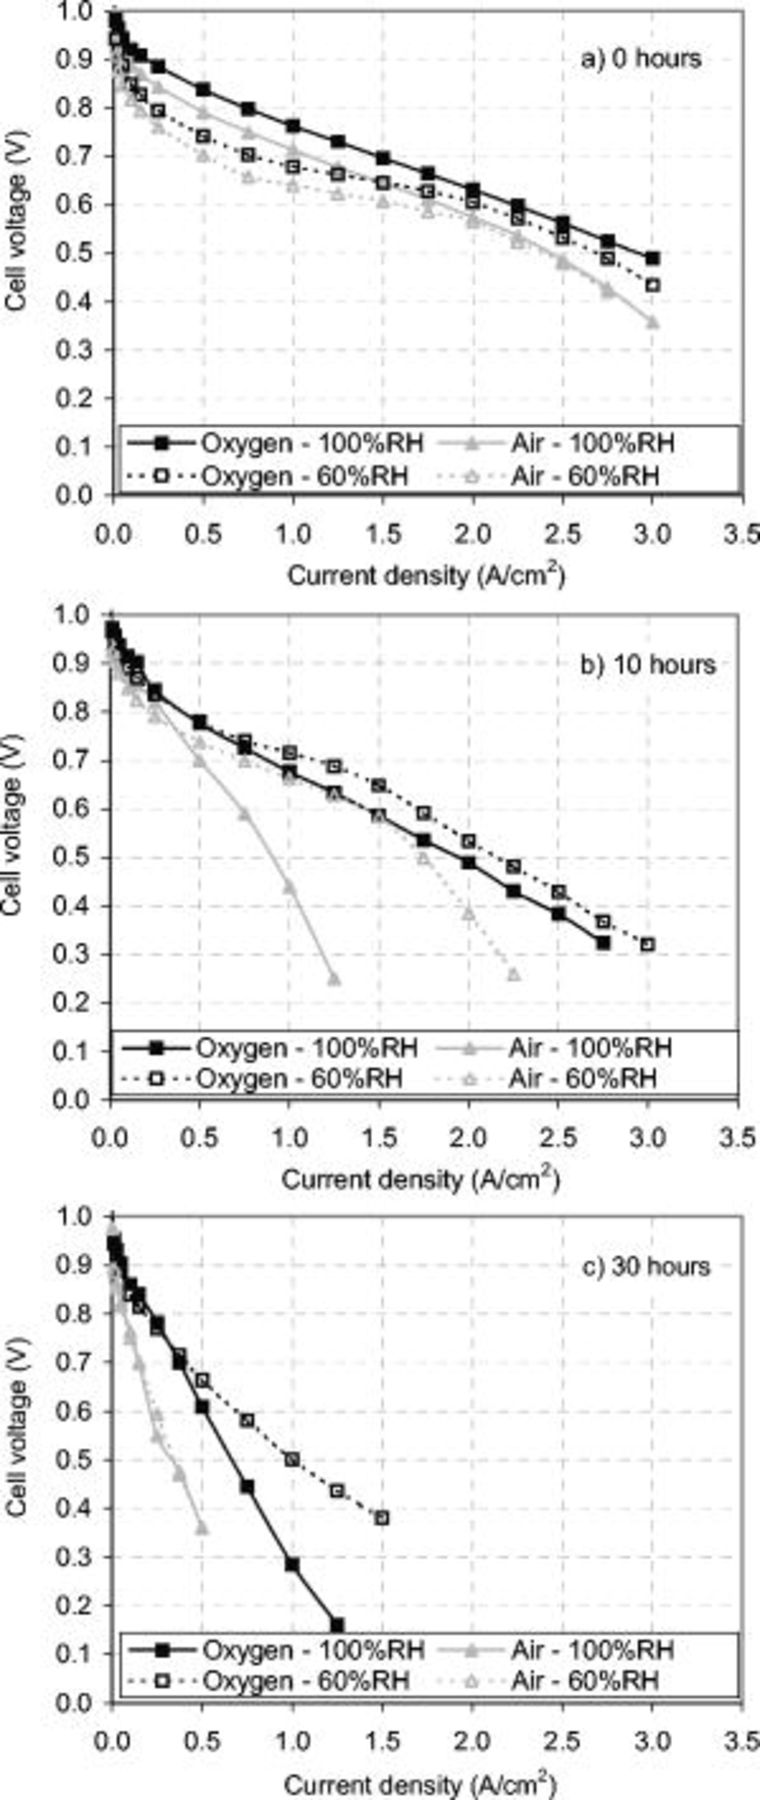
Figure 15. Oxygen and air polarization curves under 100 and 60% gas RH for the 23 wt % MEA. (a) 0 h; (b) 10 h; and (c) 30 h of corrosion. After 10 h of the corrosion AST, the MEAs performed better at 60% RH for current densities greater than  , as suggested by the EIS results in Fig. 14. The cell operating conditions were
  , 30 psig, and 25 slpm flow rates with 100 and 60% RH gas humidity.
Although not shown, after 5 h of corrosion the ohmic performance improved with an approximate  decrease in the total ohmic resistance, coinciding with the initial drop in the CL ionomer resistance shown in Fig. 14. Mass-transport losses increased drastically at higher current densities
  . As the corrosion cycling continued, the performance degraded significantly. There was an obvious kinetic contribution to the total voltage loss due to the decreased platinum surface area, as previously shown in Fig. 8. The increased HF cell resistance and the decreased CL ionomer conductivity shown in Fig. 13 and 14, respectively, support the decrease in the MEA's ohmic performance.
To further understand the performance loss, air and oxygen polarization curves were compared under subsaturated (60% RH) and saturated (100% RH) gas conditions. At 0 h of corrosion, the subsaturated voltage performance curves were all lower than the saturated performance, as expected, due to the lower membrane and CL conductivity. In the subsaturated curves the ohmic performance improved with greater current density, as the water produced humidified the cell and increased the membrane and catalyst ionomer conductivity. At both 10 and 30 h of corrosion cycling the subsaturated voltage performance was greater than the saturated performance over most of the current density range. In saturated conditions it was suggested that liquid water at the GDL/CL interface was unable to penetrate into the CL. Liquid water at this interface would impede oxygen diffusion to the catalyst, causing an additional mass transport and CL ionomer ohmic loss. With poor oxygen diffusion in the CL, a shift in the electronic and protonic current distribution through the CL would occur. The protonic current or proton penetration into the CL from the membrane would shift toward the GDL, effectively increasing the CL ionomer ohmic loss.
This hypothesis was demonstrated further by comparing the 100 and 60% RH oxygen curves after 10 h of the corrosion AST. The dry oxygen curve appeared to have a lower operating ohmic resistance at current densities less than  correlating to the subsaturated zone in the conductivity profile in Fig. 14. Under this condition, both oxygen and water vapor were able to diffuse into and out of the CL. At greater than
  , the ohmic resistance increased and appeared to match the saturated ohmic resistance, where oxygen may have been blocked by liquid water.
Conclusions
Cathode CLs containing 23 and 33 wt % Nafion ionomers were subjected to a corrosion AST to determine how the CL structure was altered and how these changes affected performance. Both CL structures demonstrated similar performance and performance degradation. Monitoring the carbon dioxide in the gas exhaust revealed that the rate of carbon loss was independent of catalyst or ionomer content. More carbon left the cell than there was catalyst support, supporting the SEM analysis, which showed both carbon catalyst support and carbon sublayer thinning. The cathode CL thinned from approximately 15 to  after 30 h of corrosion cycling. No change was observed in the membrane or anode CL thickness.
CV revealed a 55% decrease in EPSA over the 30 h corrosion period mostly due to platinum agglomeration. The rate of EPSA loss followed a first-order kinetic model and compared to literature results. The  increased 200% over the first 8 h and then slowly decreased over the remaining 22 h of corrosion cycling. Previous studies have shown the initial increase to be caused by the production of oxygen containing carbon surface groups. Eventually this increase reached a maximum where the decreased surface area of the catalyst started to dominate, at which point the capacitance started to decrease.
EIS was used to measure the HF cell resistance and the cathode CL ionomer resistance as an indicator of the structural and performance degradation. In a new MEA, the CL ionomer resistance was shown to obey Bruggeman's relationship with a tortuosity factor of close to 1.5. Over the 30 h corrosion period, the HF cell resistance increased 15–30% in saturated conditions and greater than 100% in subsaturated conditions. This resistance increase also affected the hardware compression sensitivity where increased interlayer contact resistance was hypothesized. Over the 30 h corrosion period, the CL ionomer conductivity increased in subsaturated conditions and decreased in saturated conditions. The collapse of the CL due to carbon oxidation was hypothesized to block liquid water from the CL but to allow water vapor to diffuse into its structure.
Air and oxygen polarization curves were conducted and showed similar performance and performance degradation between the two CL structures tested. After 10 h of corrosion cycling, the MEA performed better in subsaturated conditions compared to saturated conditions. It was hypothesized that liquid water impeded oxygen diffusion and caused a shift in the current distribution or proton penetration through the CL, resulting in greater ohmic losses.
The above methods were successful in explaining and quantifying the structural degradation effects of carbon oxidation on the performance of the fuel cell.
Acknowledgments
The author acknowledged Ballard Power Systems Inc. and the National Science and Engineering Research Council of Canada (NSERC) for funding this work. The author also thanks his many colleagues who supported and established the groundwork for this study.
Ballard Power Systems assisted in meeting the publication costs of this article.