Article Text

Abstract
Objective There is a substantial incidence of stroke in patients with atrial fibrillation (AF) not receiving anticoagulation. The reasons for not receiving anticoagulation are generally attributed to clinician’s choice, however, a proportion of AF patients refuse anticoagulation. The aim of our study was to investigate factors associated with patient refusal of anticoagulation and the clinical outcomes in these patients.
Methods Our study population comprised patients in the Global Anticoagulant Registry in the FIELD (GARFIELD-AF) registry with CHA2DS2-VASc≥2. A logistic regression was developed with predictors of patient anticoagulation refusal identified by least absolute shrinkage and selection operator methodology. Patient demographics, medical and cardiovascular history, lifestyle factors, vital signs (body mass index, pulse, systolic and diastolic blood pressure), type of AF and care setting at diagnosis were considered as potential predictors. We also investigated 2-year outcomes of non-haemorrhagic stroke/systemic embolism (SE), major bleeding and all-cause mortality in patients who refused versus patients who received and patients who did not receive anticoagulation for other reasons.
Results Out of 43 154 AF patients, who were at high risk of stroke, 13 283 (30.8%) did not receive anticoagulation at baseline. The reason for not receiving anticoagulation was unavailable for 38.7% (5146/13 283); of the patients with a known reason for not receiving anticoagulation, 12.5% (1014/8137) refused anticoagulation. Diagnosis in primary care/general practitioner, Asian ethnicity and presence of vascular disease were strongly associated with a higher risk of patient refusal of anticoagulation. Patient refusal of anticoagulation was associated with a higher risk of non-haemorrhagic stroke/SE (adjusted HR (aHR) 1.16 (95% CI 0.77 to 1.76)) but lower all-cause mortality (aHR 0.59 (95% CI 0.43 to 0.80)) compared with patients who received anticoagulation. The GARFIELD-AF mortality score corroborated this result.
Conclusion The data suggest patient refusal of anticoagulation is a missed opportunity to prevent AF-related stroke. Further research is required to understand the patient profile and mortality outcome of patients who refuse anticoagulation.
- Atrial Fibrillation
- Drug Monitoring
- Stroke
Data availability statement
No data are available. Data and analysis presented in this study was derived from the GARFIELD-AF registry, based on accrued eCRF data from patients diagnosed in 2010-2016 and followed-up to 2018. Aggregated data can be shared upon reasonable request and analysis plan to Saverio Virdone (Svirdone@tri-london.ac.uk).
This is an open access article distributed in accordance with the Creative Commons Attribution Non Commercial (CC BY-NC 4.0) license, which permits others to distribute, remix, adapt, build upon this work non-commercially, and license their derivative works on different terms, provided the original work is properly cited, appropriate credit is given, any changes made indicated, and the use is non-commercial. See: http://creativecommons.org/licenses/by-nc/4.0/.
Statistics from Altmetric.com
WHAT IS ALREADY KNOWN ON THIS TOPIC
A total of 25%–35% of patients with atrial fibrillation (AF) at high risk of stroke do not receive guideline-recommended anticoagulation to reduce the risk of AF-related stroke. This is largely attributed to clinician’s choice; however, a proportion of these patients refuse anticoagulation.
Little is known about factors associated with patient refusal of anticoagulation and clinical outcomes in these patients.
WHAT THIS STUDY ADDS
The strongest determinant of patient refusal was the clinician speciality at diagnosis. Patients diagnosed with AF at a primary care facility had a higher likelihood of refusing anticoagulants than patients diagnosed at a cardiology clinic.
Patient refusal of anticoagulation was associated with a higher risk of non-haemorrhagic stroke/systemic embolism, but lower all-cause mortality compared with patients who received anticoagulation.
HOW THIS STUDY MIGHT AFFECT RESEARCH, PRACTICE OR POLICY
Understanding the reasons patients refuse anticoagulation may inform shared decision-making and improve uptake of anticoagulation.
The findings regarding all-cause mortality warrants further investigation.
Introduction
Reducing the risk of an atrial fibrillation (AF)-related stroke is central to the management of AF and guidelines recommend anticoagulation in patients at risk of AF-related stroke.1 2 There have been significant advances in the past decade in the prevention of AF-related stroke and patients with AF are now more often receiving guideline-recommended therapy.3 Nevertheless, there remains a treatment gap of up to 25%–35% of high-risk patients not receiving anticoagulation, with large variations across countries.3
There is a substantial incidence of stroke and mortality in patients with AF at risk of AF-related stroke who do not receive anticoagulation.4 5 At least 20% of all ischaemic strokes occur in patients with AF not receiving anticoagulation.6 7 In the Global Anticoagulant Registry in the FIELD (GARFIELD-AF) registry, anticoagulation treatment compared with no anticoagulation treatment was associated with decreased all-cause mortality and non-haemorrhagic stroke/systemic embolism (SE) among patients with a CHA2DS2VASc score of ≥2.8 In the UK, 26% of AF-related strokes among patients not receiving anticoagulation in 2017 and 2018 were fatal.9
The reasons why patients with AF do not receive guideline-recommended anticoagulation therapy has been largely attributed to a decision made by the patients’ physician.10 The reasons that clinicians may decide not to prescribe anticoagulation include contraindications to anticoagulant policy, perceived low risk of stroke, risk of falls, bleeding risk, concomitant antiplatelet (AP) therapy and previous bleeding event.10 Patient refusal of anticoagulation is a factor in the AF treatment gap that is less acknowledged in the literature. In practice, there is a cohort of patients who refuse anticoagulation when recommended by the treating clinician.
Factors affecting patient refusal of anticoagulation and the impact of outcomes is not well understood, in part because these data are not usually collected or reported in clinical studies. Observational studies in AF in the past decade have primarily centred around treatment patterns, outcomes and the burden of AF, and where treatments decisions have been investigated the focus has been on clinical/clinician-related factors.
Using data from the GARFIELD-AF registry, this paper investigates the factors associated with patient refusal of anticoagulation and the clinical outcomes of patients who refused anticoagulation versus patients who received anticoagulation and patients who did not receive anticoagulation for other reasons.
Methods
Study design
The GARFIELD-AF is an international prospective observational study of patients ≥18 years with newly diagnosed AF and ≥1 investigator determined risk factor for stroke.11 Participants were consecutively enrolled in ≥1000 centres in 35 countries and followed for a minimum of 2 years. Newly diagnosed AF was defined as diagnosis of non-valvular AF up to 6 weeks prior to entry into the registry.
Data sources
Data collected at baseline comprised demographics, body mass index (BMI), type of AF, care setting of diagnosis, treatment strategy initiated at diagnosis, reason for treatment decision (including the reason not to treat) and medical history.
Stroke risk was calculated retrospectively using CHA2DS2-VASc score-based variables: heart failure, hypertension, age ≥75 years and 65–74 years, diabetes mellitus, prior stroke, transient ischaemic attack or thromboembolism, left ventricular ejection fraction <40%, vascular disease and female gender. HAS-BLED scores were calculated retrospectively using the variables hypertension, abnormal renal/liver function, stroke, bleeding history, medication usage predisposing to bleeding (aspirin, clopidogrel, nonsteroidal anti-inflammatory drugs) age >65 and heavy alcohol use.
Statistical analysis
Patients not receiving anticoagulation were divided into patients who refused anticoagulation and patients not taking anticoagulants for other reasons. Patient baseline characteristics are described by patients who received anticoagulation, patients who refused anticoagulation and patients who did not receive anticoagulation for other reasons. Continuous variables are expressed as median, first and third quartile (Q1; Q3). Categorical variables are expressed as frequencies and percentages.
Time at risk was censored at study end (ie, 2 years), lost to follow-up or occurrence of the event of interest, whichever came first. Given the low proportion of treatment discontinuation and lost to follow-up, we did not truncate at earlier time points. Crude all-cause mortality rate is reported as 1−Kaplan-Meier rate. For cardiovascular (CV) and non-CV death, we calculated cumulative incidence functions considering death from other causes as a competing event. For non-haemorrhagic stroke/SE and major bleeding outcomes, we calculated cumulative incidence functions considering death from any cause as a competing event. The cause of death distribution is reported as the frequency and proportion among people who died by baseline treatment (online supplemental table S1).
Supplemental material
For the identification of predictors for oral anticoagulant (OAC) refusal, a prediction modelling approach has been adopted. More specifically, two logistic regression models were developed using least absolute shrinkage and selection operator methodology. The list of potential predictors includes a wide range a demographics and medical history information and is reported in online supplemental table S2. The first (model 1) included the following information as potential predictors: demographics (sex, age, ethnicity), medical and CV history, lifestyle factors (smoking and alcohol consumption), vital signs (BMI, pulse, systolic (SBP) and diastolic blood pressure (DBP)), type of AF and care setting specialty/location at diagnosis. The second (model 2) added the country of enrolment as a potential covariate (online supplemental table S3). All continuous covariates were tested for linearity and appropriate transformations were applied as needed. The performance of the developed models was evaluated though the use of c-index with 95% CI for a measure of discrimination. Calibration curves were used to show how well the predicted values were calibrated to the observed proportions (online supplemental figure S1).
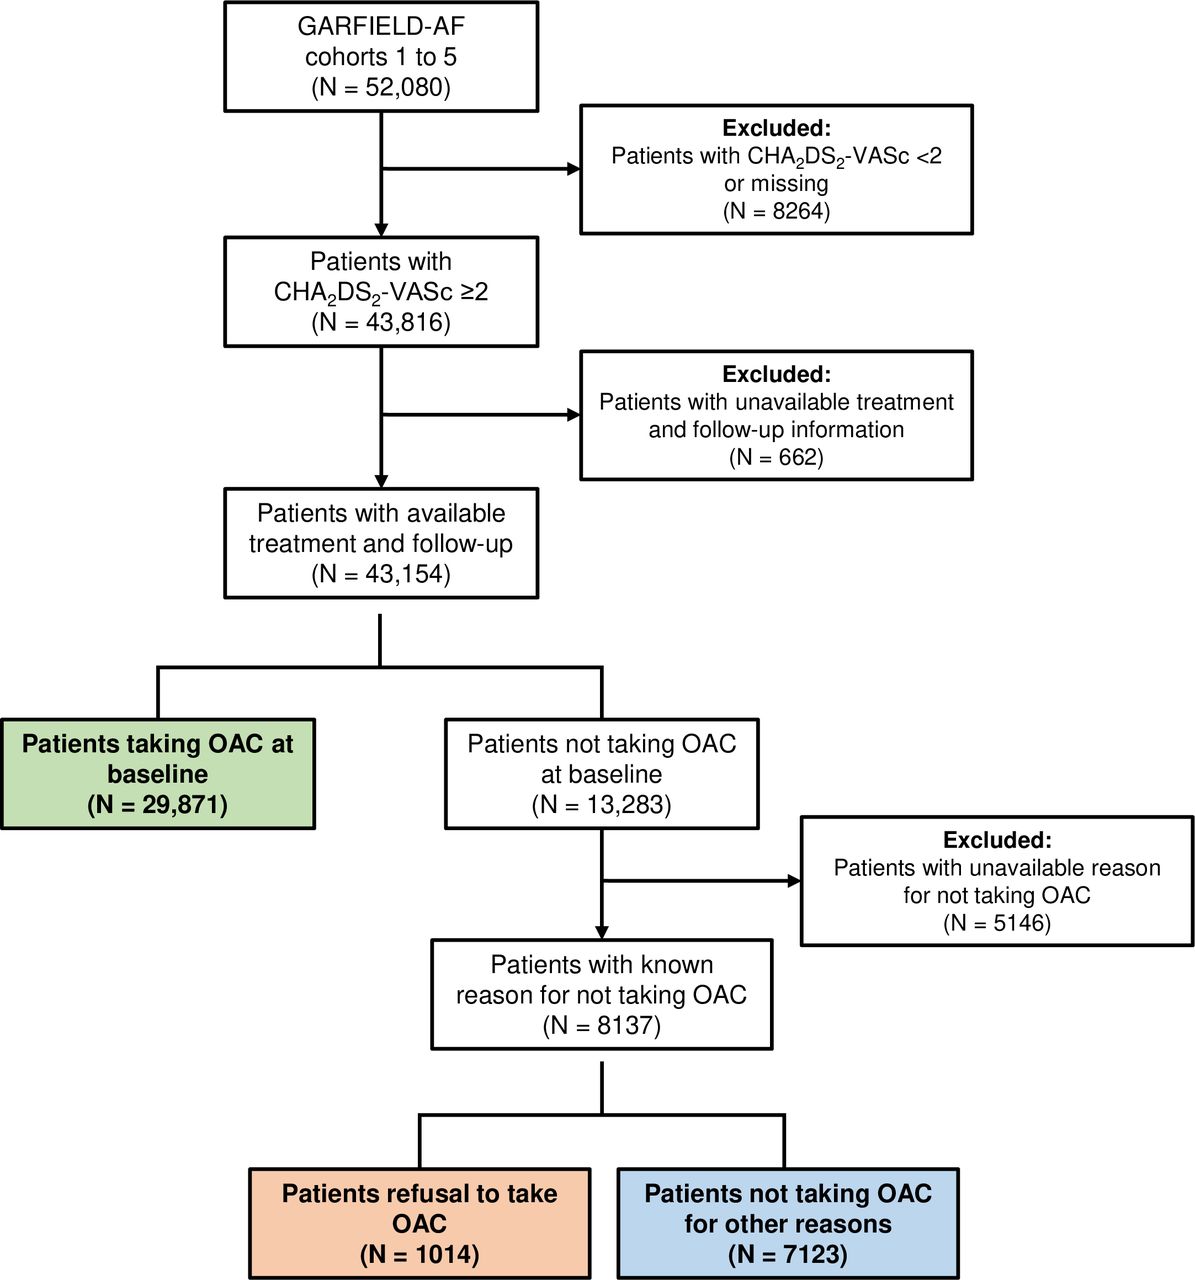
Flow chart for the selection of the study population The flow chart depicts the total cohort of patients in the GARFIELD-AF registry from which exclusion criteria were administered to arrive at final patient population for analysis. The green, blue and orange boxes indicate the patients that were considered for the analysis. GARFIELD-AF, Global Anticoagulant Registry in the FIELD-Atrial Fibrillation; OAC, oral anticoagulant.
For the comparison of clinical outcomes between patients who received OAC, who refused OAC and who did not receive OAC for other reasons, a casual inference methodology has been applied. More specifically, we analysed 2-year outcomes of non-haemorrhagic stroke/SE, major bleeding and all-cause mortality in patients at high risk of stroke, defined a CHA2DS2-VASc score ≥2, excluding female as a factor. Association estimates were obtained through a Cox proportional hazards model using a propensity method of overlap weighting to balance covariates in the population.12 This applied method overlaps weights and optimises the efficiency of comparisons by defining the population with the most overlap in the covariates between treatment groups. This scheme eliminates the potential for outlier weights by avoiding a weight based on a ratio calculation using values bounded by 0 and 1. Thus, when using overlap weights, many of the concerns regarding the assessment and the trimming of the weights are eliminated. Online supplemental figure S2 reports the absolute standardised differences of the variables included in the weighting scheme and online supplemental figure S3 shows the estimated propensity of refusing OAC. To account for the nested structure of our dataset, our calculation of propensity score through logistic regression included country of enrolment. We also made use of a robust sandwich variance estimator to account for the correlation induced in the data by the weighting of country information.

ORs for components of the OAC refusal model. 1HRs with 95% CIs are based on incremental units of ‘5’. The reference is indicated in parenthesis and is marked by the dotted line. The analysis compared patients who were on OAC (N=29 871) and patients who refused OAC (N=1014). AC, anticoagulants; GP, general practitioner; OAC, oral anticoagulant; SE, systemic embolism; TIA, transient ischaemic attack.

Cumulative incidence within 2 years of follow-up baseline anticoagulation status. The green filled circles depict OAC-treated patients, orange filled circles depict patients who refused OAC and the blue filled circles depict patients who did not receive OACs for other reasons. OAC, oral anticoagulant; SE, systemic embolism.
Only complete cases were presented in descriptive tables. Multiple imputation by fully conditional specification was applied.13 SEs were obtained by combining estimates across five imputed datasets. The missingness proportion for the baseline variables is reported in the supplementary material (online supplemental table S4). The study population of this analysis has a relatively low proportion (<3%) of missing data for most baseline characteristics, with the exception of lifestyle information (ie, smoking and alcohol use; 8 and 14%, respectively) and vital signs (SBP, DBP, heart rate; approximately 6%). All analyses were performed using SAS Enterprise Guide (V.8.2).
Results
A total of 52 080 participants were recruited to the GARFIELD-AF registry from 35 countries between 2010 and 2016. 82.9% (43 154/52 080) had complete risk information and a high risk of stroke (CHA2DS2VASc≥2, excluding female sex as a factor); of these 30.8% (13 283/43 154) did not receive anticoagulation at baseline. The reason for not receiving anticoagulation was unavailable for 38.7% (5146/13 283); of the patients with a known reason for not receiving anticoagulation, 12.5% (1014/8137) refused anticoagulation (figure 1). The remaining patients were not taking anticoagulation for other reasons—mainly related to physician’s choice (87.5%) (online supplemental figure S4).
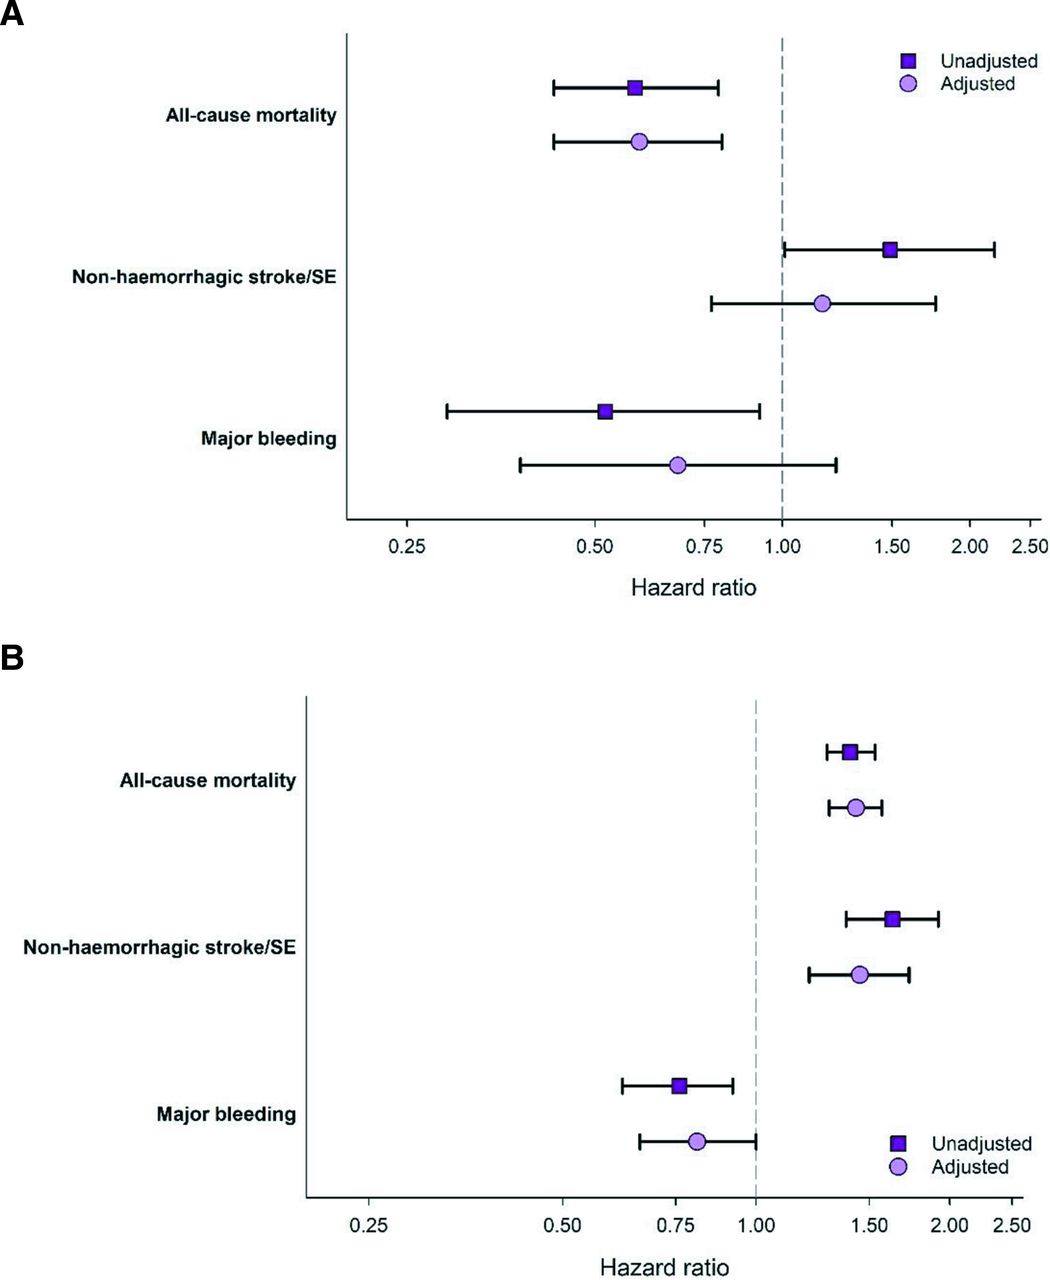
Unadjusted and adjusted HRs of 2-year outcomes (A) patients who refused anticoagulation versus patients who received baseline anticoagulation (ref.) and in (B) patients who were not anticoagulated for reasons other than refusal versus patients who received baseline anticoagulation (ref.). Purple filled squares depicts unadjusted data and pick filled circles depict adjusted data. Adjusted HR was obtained using an overlap-weighted Cox model. Variables included in the weighting scheme are: country and cohort enrolment, sex, age, ethnicity, type of AF, care setting specialty and location, congestive heart failure, acute coronary syndromes, vascular disease, carotid occlusive disease, prior stroke/TIA/SE, prior bleeding, VTE, hypertension, hypercholesterolaemia, diabetes, cirrhosis, moderate to severe CKD, dementia, hyperthyroidism, hypothyroidism, current smoking, heavy alcohol consumption, BMI, heart rate, systolic and diastolic blood pressure at diagnosis. AF, atrial fibrillation; BMI, body mass index; CKD, chronic kidney disease; SE, systemic embolism; TIA, transient ischaemic attack,; VTE, venous thromboembolism.
Patient baseline characteristics
The median (Q1; Q3) age of participants who refused anticoagulation and patients who did not receive anticoagulation for other reasons were similar, 72.0 (65.0; 80.0) and 72 (65; 78) years, respectively (table 1). The median (Q1; Q3) age of patients who received anticoagulation was 73.0 (67.0; 79.0). 34% of patients who refused anticoagulation were of Asian ethnicity whereas Asians comprised 22.4% of patients receiving anticoagulation and 37.8% of patients not receiving anticoagulation for other reasons. Cardiometabolic parameters including BMI, SBP and DBP were similar across the groups (table 1). The patients across the three groups had similar medical history with regard to information collected in the registry (table 1).
Baseline characteristics by baseline anticoagulation and reason anticoagulation was not used
The median (Q1; Q3) CHA2DS2-VASc score was 3.0 (3.0; 5.0) in patients who refused anticoagulation and 4.0 (3.0; 4.0) in patients who received anticoagulation. The median (Q1; Q3) HAS-BLED score was 1.0 (1.0; 2.0) in both patients who refused anticoagulation and patients who received anticoagulation and 2.0 (1.0; 2.0) in patients not receiving anticoagulation for other reasons. The GARFIELD-AF score for mortality, indicating the expected risk of dying within 2 years follow-up, was higher in patients on anticoagulation than in patients refusing anticoagulation (median GARFIELD-AF mortality score: 6.6% vs 5.2%, respectively).
Antithrombotic therapy at baseline
Of the patients who received anticoagulants, 59.7% received vitamin K antagonist (VKA) and 40.3% received non-VKA OAC. 79.4% (805/1014) of patients who refused anticoagulation were receiving APs compared with 70.3% (5010/7123) in patients not receiving anticoagulation for other reasons. Of the patients who refuse anticoagulants, 635 (62.6%) received aspirin, of which 289 (45.5%) were on aspirin before enrolment and 346 (54.5%) received aspirin within 1 month of enrolment. Out of the 3980 who did not receive anticoagulants for other reason, 1562 (39.3%) were on aspirin before enrolment and 2418 (60.7%) received aspirin within 1 month of enrolment (data not shown). Information on the status of other APs was unavailable at the time of enrolment.
Factors associated with patient refusal of anticoagulation
The strongest determinant of anticoagulation refusal was primary care setting at diagnosis, with patients diagnosed in primary care/general practitioner (GP) having a higher likelihood of refusing anticoagulation compared with patients diagnosed in cardiology (figure 2). Asian ethnicity, vascular disease and a history of bleeding were also strong determinants of patient refusal of anticoagulation. Patients with paroxysmal AF compared with permanent AF were more likely to refuse but those with persistent AF were less likely. Patients with a history of VTE, higher pulse, younger age, more abnormal DBPs (both high and low) and patients diagnosed outside of the in-hospital setting were least likely to refuse anticoagulation (figure 2).
There were no significant differences in refusal for patients with a CHA2DS2VASc=2 compared with patients with a score of 3 and patients with a score of ≥4 (table 2). Patients with at least one symptom were more likely to refuse anticoagulation compared with patients with no symptoms.
Crude OR for OAC refusal by CHA2DS2-VASc score and symptoms at diagnosis
Geographical variations in patient refusal
There were variations in patient refusal at country level with 5 out of the 35 participating countries having a refusal rate of ≥3% (online supplemental figure S5) (UK, Germany, South Africa, Russia and China). In contrast, France and Belgium had the lowest rates of patient refusal at ≤0.5%.
Clinical outcomes at 2 years
The crude rates of all-cause mortality, non-haemorrhagic stroke/SE and major bleeding within a 2-year follow-up in patients who refused anticoagulation were 4.4% (95% CI 3.3% to 5.9%), 2.8% (95% CI 1.9% to 4.0%) and 1.2% (95% CI 0.7% to 2.1%). Patients who received anticoagulation had a non-haemorrhagic stroke/SE rate of 1.9% (95% CI 1.7% to 2.0%). The rates of all-cause mortality and major bleeding were higher in patients who received anticoagulants when compared with patients who refused anticoagulants. Patients not on anticoagulation for reasons other than patient refusal had and all-cause mortality rate of 10.2% (95% CI 9.5% to 11.0%) and non-haemorrhagic stroke/SE rate of 3.0% (95% CI 2.6% to 3.4%) (figure 3).
After adjustment for country, demographic and lifestyle factors, clinical measures at diagnosis and medical history, patient refusal was associated with non-significant higher stroke/SE (adjusted HR, (aHR) 1.16 (95% CI 0.77 to 1.76) and significantly lower all-cause mortality aHR 0.59 (95% CI 0.43 to 0.80) and non-significant lower major bleeding (0.68 (95% CI 0.38 to 1.22), compared with patients who received anticoagulation (figure 4A). Patients not receiving anticoagulation for other reasons had higher all-cause mortality and stroke/SE, but lower major bleeding compared with patients who received anticoagulation (figure 4B).
Discussion
Summary
In this global observational prospective study of patients with newly diagnosed AF, the overall rate of patient refusal was low (2.3% of patients at high risk of stroke), though patient refusal accounted for 12.5% of patients at high risk of stroke and not receiving anticoagulation. Diagnosis in primary care/GP, Asian ethnicity and presence of vascular disease were strongly associated with a higher risk of patient refusal of anticoagulation. In our study population, patient refusal of anticoagulation was associated with a non-significant higher rate stroke/SE but a lower all-cause mortality compared with patients who received anticoagulation. Patients who did not receive anticoagulation for reasons other than patient refusal had the worse stroke/SE and mortality outcomes.
Strengths and limitations
The key strength of this study was early inclusion of patients, within 6 weeks of diagnosis of AF in the GARFIELD-AF study population. This ensured that we were capturing disease burden early on by including patients who may not survive long after an AF diagnosis.
The main limitation of this study is that the analysis is intention to treat, based on therapy initiated at diagnosis, and does not account for treatment changes during the 2-year follow-up. Also, despite having applied appropriate propensity score methodology to balance confounding factors across groups, we cannot exclude the presence of unobserved confounding.
Another potential limitation of this study was the lack of data on the patients’ decision for refusal of anticoagulants. Sociocultural factors, including personal beliefs, concerns of bleeding, especially given the older age of the study group could have played a role in their decision to refuse anticoagulants therapy.14 Further, cost of care with anticoagulants especially in the countries where patients more often pay out of pocket could have also been a factor for refusal.15 Finally, the study did not collect sufficient data on history of non-CV disease to ascertain if that contributed to their decision to refuse treatment. In addition, there are likely to be other unobserved confounders, which could have impacted patient’s decision to refuse OAC, that we are unable to consider for this study.
Comparison with existing literature
The overall rate of patient refusal in our study is lower than previously reported studies. A study on rates of anticoagulant use in older Thai adults with non-valvular AF reported that patient refusal was the reason 21% of patients were not anticoagulated.16 A study on patients attitudes towards prevention of AF-related stroke and bleeding risk in AF found 12% of patients would not consider antithrombotic therapy regardless of its’ efficacy in preventing AF-related stroke due to being ‘medication averse’.17 These differences may be due to geographical factors as our study found variations in the rate of patient refusal by country and ethnicity.
To our knowledge, this is the first study to investigate outcomes in patients who refused anticoagulation. The findings of higher stroke/SE in patients who refuse anticoagulation is consistent with the evidence on the benefits of anticoagulation in patients with AF at risk of stroke. The differences in outcomes of patients who refused anticoagulation and patients who did not receive anticoagulation for other reasons would suggest that there may be unobserved confounders associated with patient refusal. The findings regarding lower mortality in patients who refused anticoagulation, while corroborating the baseline GARFILED-AF mortality score, are counterintuitive and need to be interpreted with caution. The findings may be impacted by the geographical variation within the global study population, considering the fact that there were significant variations in outcomes across countries within the GARFIELD-AF registry even after adjustment for baseline characteristics and antithrombotic treatment.18
Implications for practice and research
While clinicians may decide to prescribe anticoagulation according to AF management guidelines, the final decision lies with the patient. Patient refusal of anticoagulation is a valid outcome of shared decision-making; however, it is a missed opportunity to prevent AF-related stroke. Exploring patients’ reasons for refusal during the decision-making process will open the discussion to allow clinicians to address any concerns. This is important particularly in the primary care setting as our study found diagnosis in a primary care setting to be the strongest determinant of anticoagulation refusal. Furthermore, current AF guidelines now recommend anticoagulants as the only appropriate pharmacologic antithrombotic therapy in patients with AF, and as such there is no alternative for patients who refuse anticoagulant therapy.19
Further investigation of patient refusal of anticoagulation in routine national datasets may provide insights relating to more homogeneous populations and may also allow investigation of crossover of patients who initially refused anticoagulation and consideration of a wider range of predictors such as deprivation and physical activity. Further studies are required to understand the reasons for the refusal. An improved understanding of why patients refuse anticoagulation currently will enrich shared decision-making and increase the likelihood that patients receive the care they need in a manner that is consistent with research evidence and their values and preferences.
Data availability statement
No data are available. Data and analysis presented in this study was derived from the GARFIELD-AF registry, based on accrued eCRF data from patients diagnosed in 2010-2016 and followed-up to 2018. Aggregated data can be shared upon reasonable request and analysis plan to Saverio Virdone (Svirdone@tri-london.ac.uk).
Ethics statements
Patient consent for publication
Ethics approval
This study involves human participants and ethics committee approvals included in online supplementary material. Participants gave informed consent to participate in the study before taking part.
Acknowledgments
We thank all physicians, nurses and patients involved in the GARFIELD-AF registry worldwide. Editorial support was provided by Herman Sandeep Prakasam (Thrombosis Research Institute, London, UK) and programming support was provided by Uma Maheshwari (Thrombosis Research Institute, London, UK). Parts of this study were previously presented at the Society of Academic Primary Care Annual Scientific Meeting SAPC ASM 2020 congress (This meeting was cancelled due to the pandemic) and at European Society of Cardiology (ESC) Congress 2020 (P Apenteng et.al., European Heart Journal, Volume 41, Issue Supplement_2, November 2020, ehaa946.0517, https://doi.org/10.1093/ehjci/ehaa946.0517).
Supplementary materials
Supplementary Data
This web only file has been produced by the BMJ Publishing Group from an electronic file supplied by the author(s) and has not been edited for content.
Footnotes
Twitter @p_apenteng
Contributors PA drafted the paper and SV was the primary statistician. JC, KSP and KAAF were part of the working group who oversaw the analyses and manuscript development. SV is the guarantor for this work and conduct of this study. All the other authors are members of the GARFIELD-AF registry, have reviewed the manuscript and approved the content.
Funding This work was supported by the Thrombosis Research Institute (London, UK).
Map disclaimer The depiction of boundaries on this map does not imply the expression of any opinion whatsoever on the part of BMJ (or any member of its group) concerning the legal status of any country, territory, jurisdiction or area or of its authorities. This map is provided without any warranty of any kind, either express or implied.
Competing interests None declared.
Provenance and peer review Not commissioned; externally peer reviewed.
Supplemental material This content has been supplied by the author(s). It has not been vetted by BMJ Publishing Group Limited (BMJ) and may not have been peer-reviewed. Any opinions or recommendations discussed are solely those of the author(s) and are not endorsed by BMJ. BMJ disclaims all liability and responsibility arising from any reliance placed on the content. Where the content includes any translated material, BMJ does not warrant the accuracy and reliability of the translations (including but not limited to local regulations, clinical guidelines, terminology, drug names and drug dosages), and is not responsible for any error and/or omissions arising from translation and adaptation or otherwise.