Article Text

Abstract
Objectives Systemic lupus erythematosus (SLE) affects the joints in up to 95% of patients. The diagnosis and evaluation of SLE arthritis remain challenging in both practice and clinical trials. Frequency domain optical imaging (FDOI) has been previously used to assess joint involvement in inflammatory arthritis. The objective of this study was to evaluate FDOI in SLE arthritis.
Methods Ninety-six proximal interphalangeal (PIP) joints from 16 patients with SLE arthritis and 60 PIP joints from 10 age-matched, gender-matched and race/ethnicity-matched controls were examined. A laser beam with a wavelength of 670 nm, 1 mm in diameter and intensity modulated at 300 MHz and 600 MHz was directed onto the dorsal surface of each joint, scanning across a sagittal plane. The transmitted light intensities and phase shifts were measured with an intensified charge-coupled device camera. The data were analysed using Discriminant Analysis and Support Vector Machine algorithms.
Results The amplitude and phase of the transmitted light were significantly different between SLE and control PIPs (p<0.05). Receiver operating characteristic (ROC) analysis of cross-validated models showed an Area Under the ROC Curve (AUC)of 0.89 with corresponding sensitivity of 95%, specificity of 79%, and accuracy of 80%.
Conclusion This study is the first evaluation of optical methods in the assessment of SLE arthritis; there was a statistically significant difference in the FDOI signals between patients with SLE and healthy volunteers. The results show that FDOI may have the potential to provide an objective, user-independent, evaluation of SLE PIP joints arthritis.
- Lupus erythematosus
- systemic
- arthritis
- inflammation
Data availability statement
Data are available upon reasonable request. Data is available upon reasonable request. Requests may be made to Anca Askanase, MD at ada20@cumc.columbia.edu.
This is an open access article distributed in accordance with the Creative Commons Attribution Non Commercial (CC BY-NC 4.0) license, which permits others to distribute, remix, adapt, build upon this work non-commercially, and license their derivative works on different terms, provided the original work is properly cited, appropriate credit is given, any changes made indicated, and the use is non-commercial. See: http://creativecommons.org/licenses/by-nc/4.0/.
Statistics from Altmetric.com
Key messages
What is already known about this subject?
The diagnosis and evaluation of SLE arthritis remain challenging in both clinical practice and research trials.
What does this study add?
Optical imaging showed a statistically significant difference in the signals between patients with SLE and healthy volunteers.
How might this impact on clinical practice or future developments?
Optical methods may have the potential to provide an objective, user-independent, evaluation of SLE proximal interphalangeal joints arthritis.
Introduction
SLE is a chronic autoimmune disease that can affect multiple organs and systems. The prevalence of SLE in the USA is 20 to 150 cases per 100 000 with variations among different racial and ethnic groups.1–3 Joints are affected in up to 95% of patients with SLE and can be the presenting symptom in 50% of SLE cases.4 Twelve per cent of patients with lupus develop permanent joint damage.5 Chronic joint involvement is associated with lower quality of life and functional performance; 19%–40% of patients with arthritis report work disability in the first 5 years of disease onset.6 7
Lupus-related joint involvement is characterised by a wide heterogeneity in phenotypes and severity, ranging from arthralgia (persistent joint pain without evidence of synovitis) to deforming arthropathy (Jaccoud’s arthropathy) and erosive arthritis. Because of this heterogeneity, it is inconsistently described in classification criteria and activity measures. The 1982 American College of Rheumatology (ACR) criteria8 defined arthritis as ‘non-erosive arthritis involving 2 or more peripheral joints, characterized by tenderness, swelling, or effusion’, while the 2012 SLICC criteria9 broaden the definition to include ‘arthralgia with stiffness’. The definition of joint involvement varies among lupus disease activity assessment instruments used in observational studies and clinical trials. The Systemic Lupus Erythematous Disease Activity Index (SLEDAI)10 scores the presence of physician-evaluated arthritis, while British Isles Lupus Assessment Group (BILAG)11 and European Consensus Lupus Activity Measurement (ECLAM)12 take into account patient’s report of arthralgia. Furthermore, there is controversy whether tenderness alone is equal to active joint involvement and should be scored as lupus disease activity. Unfortunately, all these inconsistencies in the definition of SLE arthritis impact clinical trial outcomes.
Identification of lupus arthritis and assessment of its activity remain a challenge in clinical practice.13 Evaluations based on traditional joint examination lack precision, due to its subjective nature14 and accuracy in situations such as obese digits and co-existing fibromyalgia.15 As such, these examinations have limited ability to render quantitative data about improvement and worsening.
The recent application of imaging modalities, especially ultrasound (US) and MRI, has enabled more objective and detailed assessment of articular and periarticular abnormalities with higher sensitivity.16–18 However, MRI and US are expensive and time-consuming. Furthermore, US has been found to be very operator dependent. Therefore, both modalities are currently not routinely used in practice. There is a clear unmet need for a simple, reliable, non-invasive and low-cost imaging modality that can objectively assess and monitor arthritis progress in patients with lupus .
Optical imaging methods have been applied to diagnosing and assessing progression of various diseases, including breast cancer,19–23 peripheral vascular disease,24–27 wound healing28 29 and more.30–32 In these applications, optical transmission and reflection measurements are used to assess differences in the scatter and absorption of light between patients and healthy controls. At different wavelengths and modulation of the infrared light, tissue components (ie, blood, water and lipid concentrations) absorb light differently, making it possible to highlight the presence and/or accumulation of blood or other fluids in these tissues. Furthermore, optical imaging methods have been used in studies comparing osteoarthritis,33 rheumatoid arthritis (RA)34–38 and healthy controls. The results of those studies highlighted that patients suffering from RA have higher light absorption in the joint space compared with healthy subjects. This is likely due to the presence of inflammatory synovial fluid that decreases light transmission through the inflamed joints. However, optical methods have yet to be applied to the assessment of SLE arthritis. Here, we present the first study that seeks to determine if there are optical differences between the joints of SLE patients with arthritis and healthy volunteers.
Materials and methods
Between 2018 and 2020, we conducted a cross-sectional, observational pilot study at the Columbia University Irving Medical Center (CUIMC) of New York City, New York, USA. Informed written consent was obtained for all patients and healthy volunteers enrolled. The non-random convenience sampling method was used to enrol patients with SLE, while a quota sampling method was used to enrol the healthy subjects to match age, gender and race/ethnicity of the patients with SLE. The reporting guidelines followed for this paper are the STARD reporting guidelines.39
Patient and public involvement
Patients or the public were not involved in the design, or conduct, or reporting, or dissemination plans of our research.
Study subjects
Sixteen16 SLE patients with active arthritis involving at least two proximal interphalangeal (PIP) joints were enrolled. Patients with SLE, 23–56 years old, fulfilled at least four of the 1997 revised ACR Classification criteria40 and were treated with standard of care medications (including antimalarials, corticotropin/ corticosteroids, immunosuppressants and biologic agents). The study excluded patients with SLE-rheumatoid arthritis or psoriatic arthritis overlap, patients with recent or active infections and pregnant patients. All patients had a tender and swollen joint count assessment just prior to the frequency domain optical imaging (FDOI) measurements.
Ten10 age-matched, gender-matched and race/ethnicity-matched individuals served as healthy controls. All control subjects were assessed and confirmed to not have arthritis, infections or arthralgias. None of the controls were taking prescription medications or had history of substance use disorder, Raynaud’s phenomenon, or osteoarthritis.
Optical measurement system and measurement protocol
The optical FDOI used in this study has been previously described34 (a photograph of the system is shown in online supplemental figure S1). This system was designed to analyse the PIP joints of the second to fourth fingers. The patient is instructed to first inserts his/her hand inside a small opening in a black box, as shown in online supplemental figure S1; then to align a black dot previously marked on his/her finger at 17 mm distal from the PIP joint line with the red laser light coming from the top; and finally, to gently press down with the finger a metallic switch. This action will open the camera lens and allow the collection of the images. This set-up was chosen to stabilise the finger in place for the duration of the measurement session. While it would be possible to measure the fifth finger, the smaller size of the fifth finger and proximity of the DIP and MCP joints might interfere with the readings. Therefore, the fifth finger was not included in this or previous studies that use the current set-up; the device can be modified for future studies.
Supplemental material
Here, we briefly report how the measurements are performed: an amplitude-modulated laser beam with a wavelength of λ=670 nm, average optical power of 8 mW and beam diameter of 1.0 mm was directed at the dorsal surface of each finger and scanned across the PIP joint in a sagittal plane (see figure 1A,B). The scanning process started with the patient manually aligning the black mark on his/her finger with the red laser dot under the supervision of the system operator; the system then automatically scanned at 11 different positions, each 2 mm apart. The scan was performed twice with an amplitude modulation frequency of 300 MHz and 600 MHz. The transmitted light intensities were measured with an intensified charge-coupled device camera. At every 1 of the 11 source positions, 16 pictures with an exposure time of 80 ms each were taken at different phase steps of oscillation (0, 21, 42, 63, …, 315 and 336 degrees), resulting in 11×16=176 images for each joint and modulation frequency considered. The time required to acquire each set of 16 image is about 4 s, the mechanical movement of the laser takes about 1 s, and after arriving to one end, the measurement immediately restarted at the second frequency, moving in the opposite direction, so to acquire a single joint the patient has to keep his/her finger pressed on the switch for about 3 min ((4+1)*11*2=110 s+the time needed to check the alignment of the laser before the start of the measurement and its mechanical shift to the starting position).
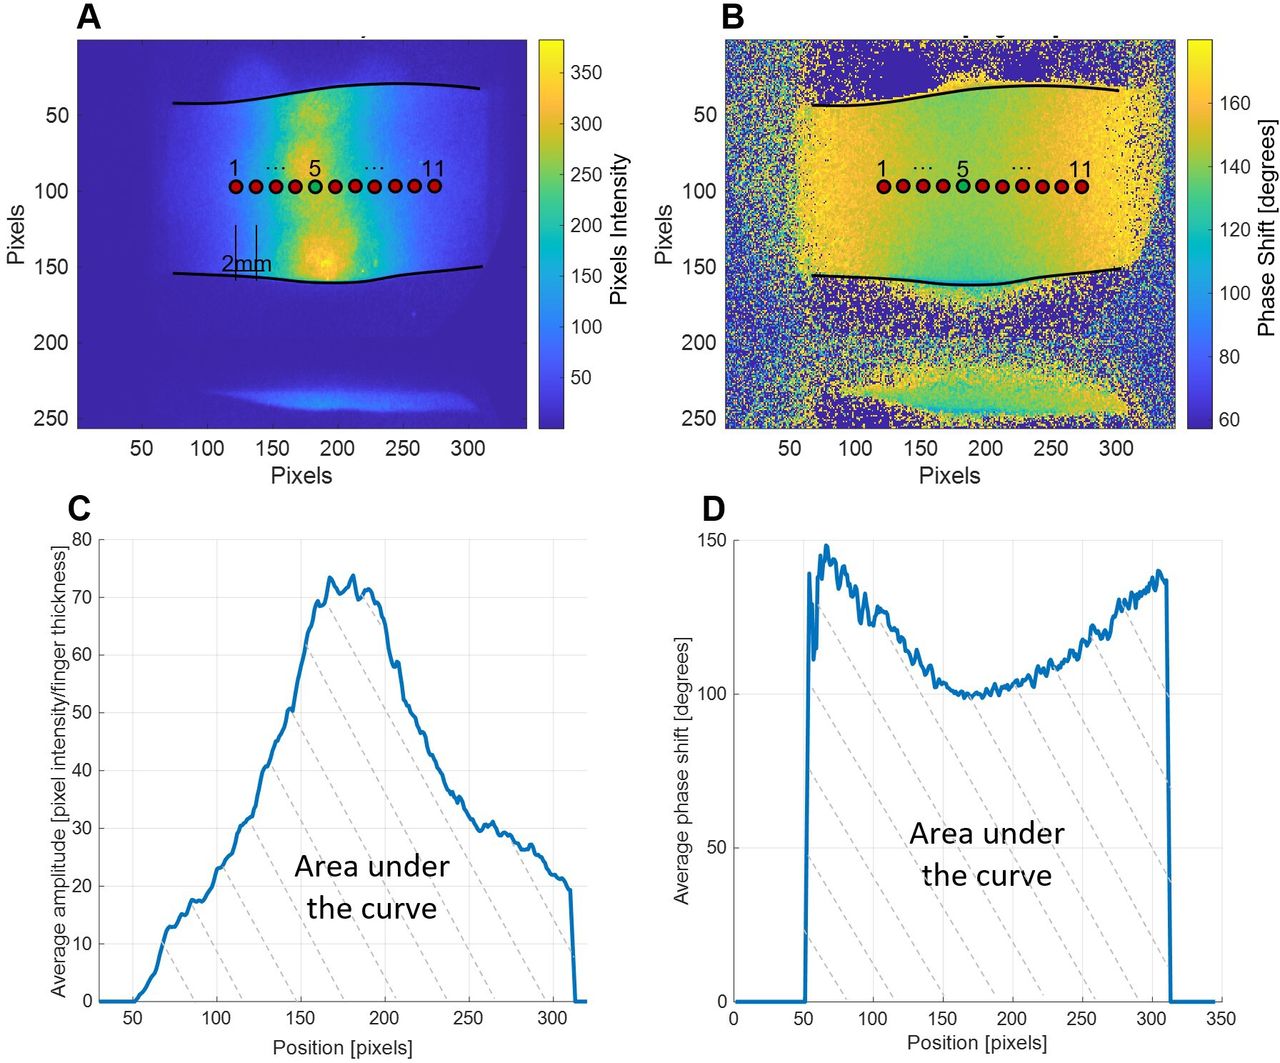
Amplitude and phase images. (A and B) Examples of an amplitude (A) and phase (B) measurements obtained from a single source in the position marked as ‘5’. After the 11 maps obtained from the different positions of the sources are averaged. (C) and D) The values of the pixels located under the line connecting the positions of the sources in the averaged images. The areas under the curves are the parameters used for all subsequent analyses.
The room temperature was kept between 18°C and 25°C to prevent pathological peripheral vasoconstriction or vasodilation. Three PIP joints on each hand were evaluated for this study (left and right second, third and fourth PIPs, for a total of six PIPs per subject). Therefore, the total time required for a measurement session was between 20 and 25 min (3 minutes × PIP joint plus the time needed to shift between fingers and hands).
In addition to the optical transmission data, the width and height of the fingers were measured in three different positions using a calibre: on the PIP joint, 15 mm proximal and 15 mm distal.
Furthermore, demographic data, disease duration (years since diagnosis), co-morbidities including vascular diseases and SLE therapies were recorded. Two experienced assessors blinded to both clinical and imaging data independently performed the standard joint examinations just before the optical measurements and reached agreement regarding the presence of swelling and/or tenderness in each individual PIP joint.
Data analysis
The data analysis was done by the same operator who collected the FDOI images, and all the software passages were automated with the creation of a graphical user interface that requires only the raw data as input.
After the data acquisition, the 16 raw images for each source position were processed using a fast Fourier transformation to obtain two-dimensional images of the amplitude and the phase (figure 1A,B). A total of 11 such paired images were obtained (one per source position) for each modulation frequency considered. Subsequently, amplitude and phase images were averaged across the 11 source positions. From these images, we extracted the data along a one-dimensional line connecting the positions of the 11 sources (figure 1C,D).
The amplitude values were further divided by the measured finger thickness to compensate for the fact that more infrared light passes through a thinner finger than a thicker one. The areas under both curves (marked by dotted lines in figure 1C,D) were then used for the subsequent analyses.
Overall, we obtained 192 such graphs from SLE arthritis patients (16 patients × 6 fingers (3 PIPs per hand) × 2 (amplitude and phase)=192) and 120 graphs from healthy volunteers (10 healthy volunteers × 6 fingers (3 PIPs per hand) × 2 (amplitude and phase)=120).
MATLAB V.2020b software was used for the statistical analysis. As the amplitude and phase data were not normally distributed, a non-parametric test for the statistical analysis was employed. We then assessed the amplitude and phase data together using linear and quadratic discriminant analysis (LDA–QDA) as well as support vector machine (SVM), with linear, polynomial and Gaussian kernels.41 All the models were tested using the leave-one-out cross-validation method.42 The cross-validation method consists of partitioning the data in two subsets, one which will be used for the analysis (training) and the second one to validate the analysis results (test). This operation can be repeated multiple times with different divisions between training and test data sets. The validation results are averaged to estimate the model’s predictive performance. In the leave-one-out method, the training is done on all the data minus a selected case, which functions as the test and it is repeated as many times as the number of data available. The receiver operating characteristic (ROC) curves reported were obtained based on the results of the cross-validation.
Results
Patient characteristics
Demographic and clinical data of patients with SLE and controls are shown in table 1.
Demographic and clinical characteristics of study objects
All study subjects, except for one patient with SLE and one control, were women, which reflects the overall female predominance of the disease (8% men, 92% women).43 In the quota sampling scheme for controls, priority was given to matching gender and race/ethnicity, with age as a secondary criterion. Accordingly, full matching for age was not achieved, the average age of the control group was about 6 years younger than the SLE patient group (33.4±10.9 vs 39.7±10.8). Race and ethnicity distribution are matched between the patient and control group. The disease duration of the patient group (13.7±8.2) ranges from 3 to 33 years, with 50% patients having SLE for more than 10 years. Hand X-rays for all patients over 45 years old (n=6) were reviewed and showed no evidence of PIP osteoarthritis. None of the patients had cutaneous lesions or skin changes in the scanned area of the PIP joints. On enrolment in the study, almost all (93.75%) patients were treated with hydroxychloroquine; 6 patients (37.5%) were taking corticosteroids or repository corticotropin injections; 10 patients (62.5%) immunosuppressants: azathioprine (6.25%), mycophenolate mofetil (18.75%) or methotrexate (31.25%) or leflunomide (6.25%); biologics/small molecules were used in 4 patients (25%), including belimumab (6.25%), rituximab (6.25%), tofacitinib (12.5%). Three patients had mild anaemia (8.7–10.5 g/dL) at the time of evaluation, the haemoglobin level (mean±SD) of the patient group was 12.1±1.4 g/dL. Most patients were taking over-the-counter nonsteroidal anti-inflammatory drugs (NSAIDs) as needed for pain control. None of the controls had arthritis, tender or swollen joints. Of the 16 patients, one had isolated low C3, one isolated low C4 and two had both low C3 and C4. Half of the patients had positive anti-double-stranded DNA antibodies. The median (range) hybrid SLEDAI score was 6.5 (4–22) for the patient group. Eight patients had a history of lupus nephritis; two patients had active nephritis at the time of evaluation as defined by the renal domain SLEDAI descriptors. The median (range) tender and/or swollen PIP joint counts is 7 (2–8). Additionally, 11 (6–28) non-PIP joints were tender and/or swollen, including the metacarpal phalangeal (MCP) joints, distal interphalangeal (DIP) joints, wrists, elbows, shoulders, hips, knees, ankles. The median (range) total tender and/or swollen joint counts of the 16 patients is 18 (6–28). Of all the 16 patients, 2 had active Raynaud’s phenomenon around the time of the study and 1 had a history of Raynaud’s. However, none of these three patients had active Raynaud’s at the time on their physical examination and optical joint evaluations; none of the 16 patients were taking vasoconstrictive drugs or vasodilators, beta-blockers and calcium channel blockers, at the time of the study. Four patients were active smokers, three patients were former smokers and the rest nine were never smokers. All 16 patients denied recreational drug use. Five patients had bilateral Jaccoud’s arthropathies, while none of the patients had evidence of PIP osteoarthritis. No other joint deformities were observed.
Tender or swollen or painful joint counts
A total of 96 PIP joints were assessed; 20 joints (20.8%) were unaffected (non-tender and non-swollen), while the remaining 76 joints (79.2%) showed either swelling or tenderness on assessment. Of these 76 affected joints, 45 were both tender and swollen (46.9% of the total), 30 swollen-only (31.3% of the total) and 1 joint (1% of the total) displayed only tenderness without swelling. The tender and swollen joint count results are summarised in a heatmap format in figure 2, where each colour block represents an individual PIP joint of an SLE arthritis patient.
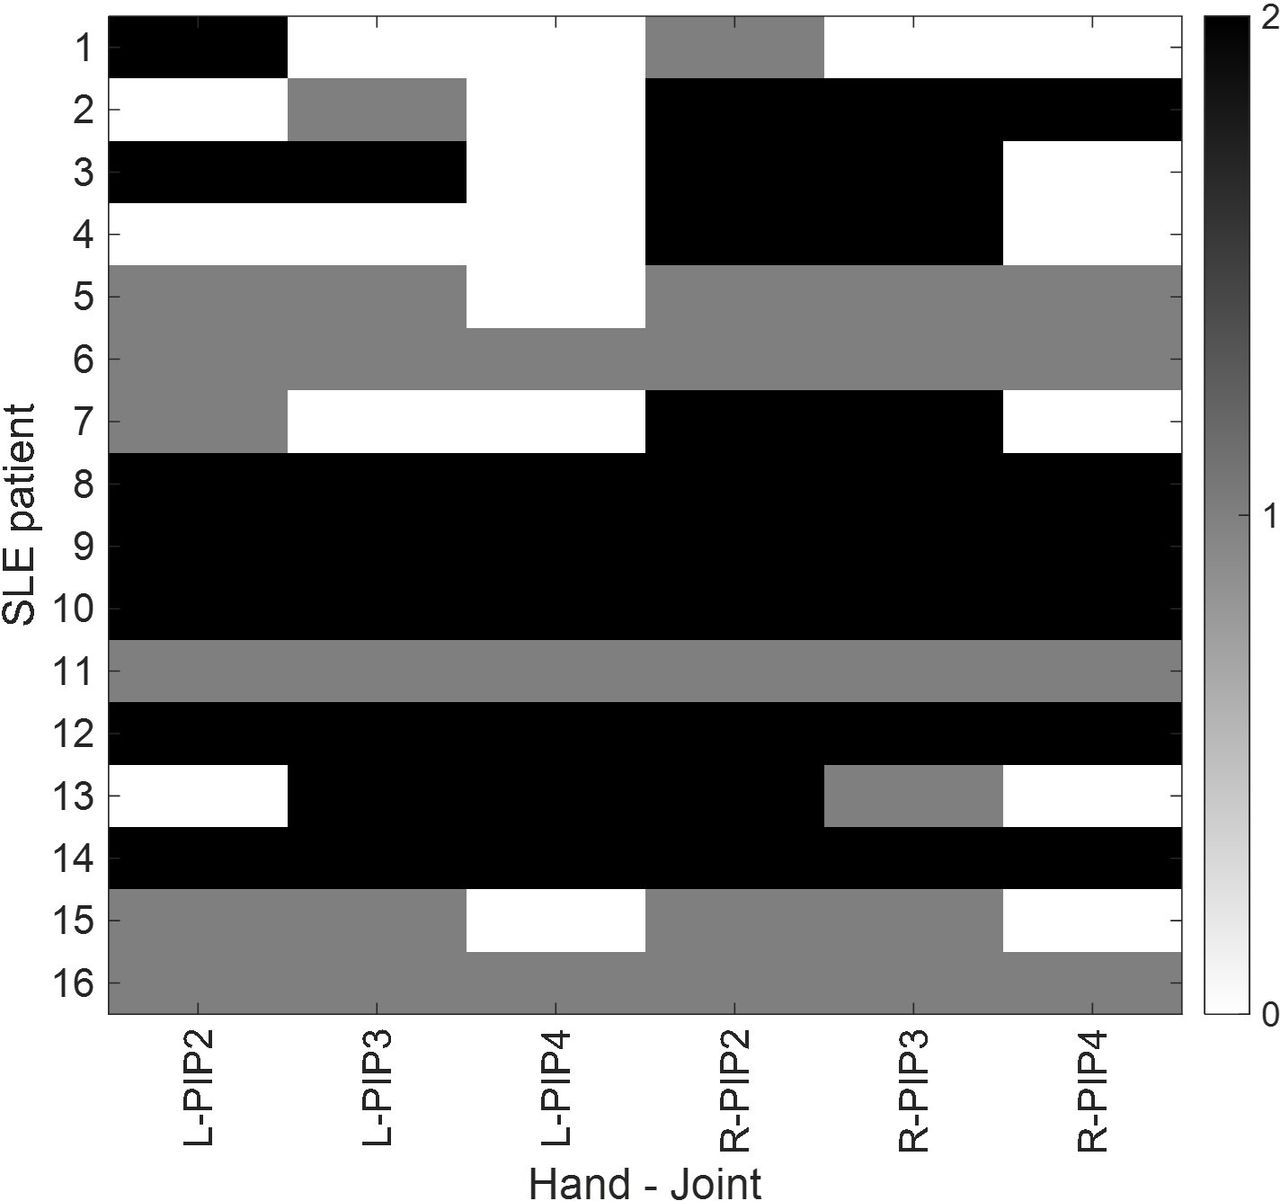
Tender and swollen joints. Black colour represents presence of both tenderness and swelling; joints with only swelling or tenderness are shown as grey colour; white colour stands for joints without any swelling or tenderness. On the x-axis, L stands for ‘left hand’, R for ‘right hand’ and the number indicates which finger is considered. PIP, proximal interphalangeal.
FDOI data evaluation
In general, we found that the data obtained with a 300 MHz modulation frequency led to substantially better results than data generated with a 600 MHz modulation frequency. Therefore, unless otherwise noted, we present here the analysis of the 300 MHz data.
Figure 3A,B displays the average and SEs for amplitudes divided by the finger thicknesses and phases obtained when considering all the subjects and fingers. A continuous line is used for controls subjects and dotted line for patients with SLE. Figure 3C,D displays the boxplots obtained from the respective AUCs. The Mann-Whitney U test shows that the medians are distinguishable with p values <0.001 for the amplitude AUC and 0.027 for the phase AUC. While it is possible to notice a slight difference in the average values of SLE fingers that were also swollen or tender respect to non-affected fingers, that difference is not statistically significant. The corresponding ROC curves are shown in figure 3E. It is possible to highlight an AUC of 0.88 for the amplitude divided by the finger thicknesses, with a corresponding sensitivity of 93%, specificity of 79% and accuracy of 71%.
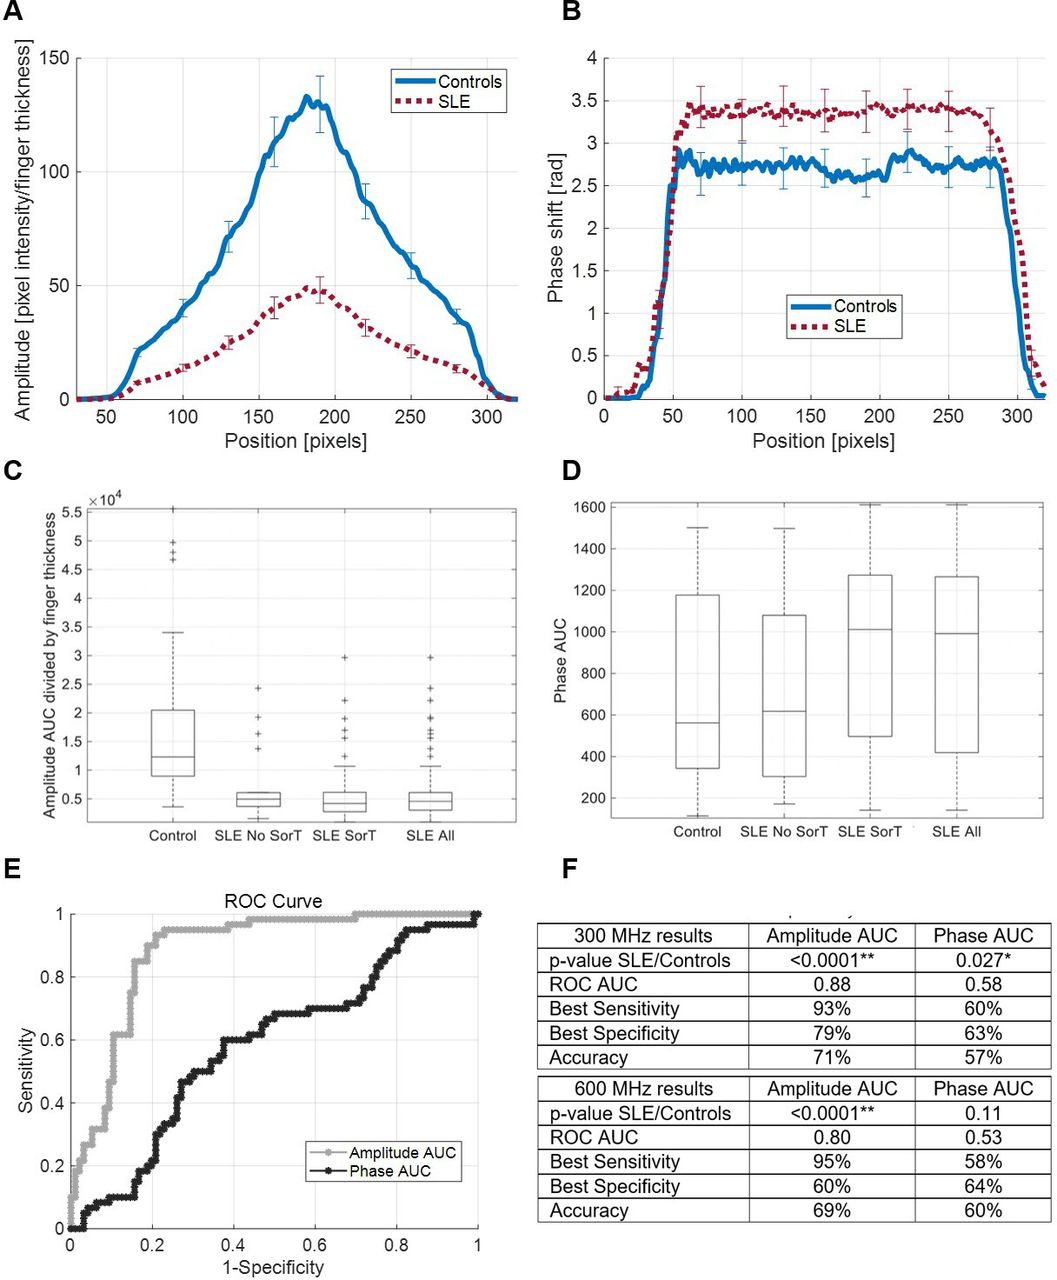
Statistical analysis. (A–B) The averages and SEs obtained when considering, respectively, the amplitudes divided by the finger thickness of all the subjects and the phases are displayed. (C–D) The boxplots obtained from the corresponding areas under the curve, respectively, of the amplitudes divided by the finger thickness and the phases are displayed. Patients with SLE are divided in three categories: only joints swollen or tender, only joints not swollen or tender, all the joints together. The corresponding ROC curves are shown in (E). (F) Quantitative values for the sensitivity, specificity, AUC, accuracy and the p values for 300 MHz and 600 MHz data are provided. ROC, receiver operating characteristic.
Next, we evaluated both parameters at the same time to see if it was possible to further improve these results; we employed an LDA and QDA, as well as an SVM algorithm. The SVM was programmed with a linear (SVM-L), a polynomial (SVM-P) and a Gaussian (SVM-G) kernel. The results are shown in figure 4.

Discriminant and support vector machine (SVM) analyses and corresponding ROC curves. Distribution of the patients with SLE (stars) and control subjects (circles) respect to the AUC of the amplitude divided by the finger thickness and the AUC of the phase are shown. The dotted lines are the optimal separation planes (for which the Youden’s J index is maximised) obtained with, respectively, an LDA (A), a QDA (B) and an SVM with linear kernel (C). ROC curve obtained from all the different models and their best accuracies, sensitivities and specificities are shown in (D). LDA, linear discriminant analysis; QDA, quadratic discriminant analysis; ROC, receiver operating characteristic.
As seen in figure 4, the best AUC (0.89) obtained from the cross-validation of the models was from the SVM with a linear kernel. The corresponding sensitivity is SE=95%, the specificity is Sp=79% and the accuracy is Ac=80%. Note that the different AUCs are very similar to each other and only slightly higher than the AUC of the amplitude divided by the finger thickness, without the phase information.
Discussion
This is the first study to examine the potential of optical methods to assess SLE arthritis.
Ninety-six (96) PIP joints from 16 patients with SLE were assessed using the clinical gold standard, tender and swollen joint counts (figure 2). The same patient cohort and a demographically matched normal control cohort consisting of 10 (10) healthy people without any arthritis (60 PIP joints in total) had their PIP joints examined using FDOI. Amplitude and phase curves from joints of patients with SLE and healthy controls were subsequently analysed and compared (figures 3 and 4). The FDOI data shows statistically significant differences (p<0.05) between joints of patients with SLE and joints of healthy volunteers. Using ROC analysis, we found that an AUC of 0.89 can be achieved (corresponding sensitivity of 95%, specificity of 79% and accuracy of 80%) from the ROC analysis with SVM with linear kernel (figure 4). The maximum amplitude of the transmitted light divided by the finger thickness is the main parameter that distinguishes SLE joints from healthy controls (figure 3). While there are differences in the phase as well, these are comparatively small. It is well established that the amplitude is dominated by absorption effects, while the phase corresponds to scattering effects.44 45 The smaller amplitude in patients with SLE suggests a higher absorption in SLE arthritis fingers, likely due to an increase in articular/periarticular cellularity and in the density of regional vascular network,34 further substantiating that lupus arthritis is a highly inflammatory process. The higher phase in patients with SLE compared with healthy controls supports more scattering in these joints. This is similar to observations made in patients with rheumatoid arthritis, where the turbid, inflammatory synovial fluid with high white blood cell count is responsible for increased scatter.34 In patients with rheumatoid arthritis, the scatter effect is stronger than the absorption changes. In patients with SLE, the absorption effect appears stronger possibly due to the slightly different nature of SLE articular symptoms with more tenosynovitis, joint capsule swelling and soft tissue inflammation than synovitis and effusions.
Joint involvement is common in SLE and it is reported to affect up to 95% of patients.4 However, clinical practice and clinical trials of patients with SLE arthritis have been largely impacted by the inconsistency in definition of joint involvement and subsequent confusion over scoring of arthritis among different disease activity instruments.10–14 There is an ongoing need for a reliable, rapid and cost-effective method of assessing SLE joint involvement despite the increasing application of advanced imaging technologies such as US and MRI.16–18 Our study shows that the FDOI technique has the potential of satisfying these requirements, given its high objectivity, short duration, and low cost.
The range of variations in the thickness-adjusted maximum amplitude (expressed by the SE lines in figure 3) among the joints of patients with lupus may represent the heterogeneity in phenotypes and severities of lupus-related joint involvements. The difference in optical properties between joints of patients with lupus and joints of healthy controls is alleged to reflect the underlying intra-articular and peri-articular histologic changes in lupus arthritis. In fact, histological findings from synovial biopsies of lupus arthritis joints show synovial inflammation with synovial hypertrophy, oedema and vascular proliferation as well as fibrin deposition on the articular surfaces.46 Joint fluid analysis further identifies an inflammatory fluid containing a large amount of lupus erythematous cells, neutrophils and monocytes.47 The increase in cellular density, proliferation of synovial vasculatures and joint effusions are likely responsible for the alterations in absorption and scatter of infrared light and subsequently lower the maximum amplitudes (figure 4). Similar mechanisms have been postulated in FDOI studies of rheumatoid arthritis,34 osteoarthritis33 and peripheral vascular diseases.27 Beyond the articular involvement, periarticular structural changes have been described in patients with lupus. Early studies comparing rheumatoid arthritis and lupus arthritis with MRI have reported different features of SLE arthritis especially the presence of oedematous tenosynovitis and capsular swelling.17 18 More recent MRI studies of lupus arthritis show high incidence of soft tissue and bony abnormalities, including bone marrow oedema, subchondral cysts, periarticular capsular swelling and even bone erosions.48–50 These peri-articular changes are suspected to contribute to the wide spectrum of variations in optic properties of the joints evaluated.
Interestingly, almost all the 20 non-tender non-swollen joints and 30 swollen-only joints generate amplitude curves that fall under the mean value of the control subjects and optically ‘disguise’ as tender and swollen joints. Possible explanations include the subjectivity and unreliability of joint examination results and overclassification of joints as arthritic by the FDOI model since the training was done between SLE and healthy controls. However, we postulate that, in a certain percentage of joints determined to be clinically quiescent by joint examinations, there might be underlying joint or tendon inflammations under the limit of clinical detection. Similar observations were described in the studies of lupus arthritis by US. Nine US studies including 459 patients report the discordance between the rates of US-detected synovitis and rates of clinical synovitis, which lead to recent insights into ‘subclinical synovitis’.16 The prevalence is reported to approximate 33% in all patients with SLE with inflammatory joint symptoms.51 The subset of patients with ‘subclinical synovitis’ have brought new challenges to clinical trials and medical practice as the presence of synovitis is weighed heavily in current disease activity indices and no consensus has been reached on whether captured subclinical findings warrant therapeutic interventions.8–12
We readily acknowledge several limitations to this study. Primarily, the small size of patient cohort limits further subgroup analysis within joints of patients with lupus. Currently, we cannot comment on whether FDOI has detected significant difference among tender and swollen joints, swollen-only or tender-only joints, and non-tender non-swollen joints, as classified by tender and swollen joint counts. However, we do observe that in the same patient, the amplitude curves obtained from the non-tender and non-swollen joints move more towards those obtained from the joints of normal controls compared with the remaining joints of that patient. Online supplemental figure S2 classifies the joints of the patients with SLE who had ‘healthier’ joints with respect to their measured optical amplitude. Future studies will include US imaging in addition to optical imaging to better assess the ‘healthiness’ of SLE joints and will examine how the results obtained from the two methods correlate with each other and with the physician assessment of swollen/tender joints. Second, there is imprecision in the measurement of finger size due to the extensibility and flexibility of the skin and soft tissues overlying the bony structures, which bring difficulties in determining that the measurement devices were appropriately touching the skin surface without pinching in or floating above. Third, we do not know if FDOI model could detect painful SLE joints as inflamed or normal, as this is a critical clinical question. Moreover, patients with SLE with cutaneous manifestations were not adequately represented in the current study. Patients with cutaneous lesions such as discoid lesions and vasculitis will be included in future studies to characterise the effects of cutaneous changes on optical evaluations. In addition, the fact that the mean age of patient group (39.7±10.8) is about 6 years older than the mean age of control group (33.4±10.9) is another limitation; optical property alterations might be confounded by degenerative changes in the PIP joints. Furthermore, the evaluation of the joint involvement and interpretation of study results were confounded by the lack of more objective measures of lupus arthritis. A general challenge in the field of SLE arthritis is that such objective measures have not yet been established. For example, MRI and US have been studied in SLE, but they have not yet been validated for use in clinical care or research. Finally, future studies will compare the joints of patients with lupus arthritis with those of patients with lupus without (active) joint involvement.
Supplemental material
Data availability statement
Data are available upon reasonable request. Data is available upon reasonable request. Requests may be made to Anca Askanase, MD at ada20@cumc.columbia.edu.
Ethics statements
Patient consent for publication
Ethics approval
The study complies with the Declaration of Helsinki and was approved by the Columbia University Medical Center Institutional Review Board (IRB), Protocol #: AAAR6415.
References
Supplementary materials
Supplementary Data
This web only file has been produced by the BMJ Publishing Group from an electronic file supplied by the author(s) and has not been edited for content.
Footnotes
AM and WT are joint first authors.
AH and ADA are joint senior authors.
AM and WT contributed equally.
AH and ADA contributed equally.
Contributors All authors were involved in drafting the article or revising it critically for important intellectual content, and all authors approved the final version to be published. AM collected the frequency domain optical imaging data and prepared the respective sections of the paper with the assistance of YK and under the supervision of HK and AH. WT collected the physical medical data and prepared the respective sections of the paper, with the assistance of TC, GD, CG, YG and LK and under the supervision of ADA.
Funding The authors have not declared a specific grant for this research from any funding agency in the public, commercial or not-for-profit sectors.
Competing interests None declared.
Provenance and peer review Not commissioned; externally peer reviewed.
Supplemental material This content has been supplied by the author(s). It has not been vetted by BMJ Publishing Group Limited (BMJ) and may not have been peer-reviewed. Any opinions or recommendations discussed are solely those of the author(s) and are not endorsed by BMJ. BMJ disclaims all liability and responsibility arising from any reliance placed on the content. Where the content includes any translated material, BMJ does not warrant the accuracy and reliability of the translations (including but not limited to local regulations, clinical guidelines, terminology, drug names and drug dosages), and is not responsible for any error and/or omissions arising from translation and adaptation or otherwise.