Article Text

Abstract
Background Colorectal cancer (CRC) is one of the most prevalent and deadly tumors worldwide. The majority of CRC is resistant to anti-programmed cell death-1 (PD-1)-based cancer immunotherapy, with approximately 15% with high-microsatellite instability, high tumor mutation burden, and intratumoral lymphocytic infiltration. Programmed death-ligand 1 (PD-L1)/PD-1 signaling was described in solid tumor cells. In melanoma, liver, and thyroid cancer cells, intrinsic PD-1 signaling activates oncogenic functions, while in lung cancer cells, it has a tumor suppressor effect. Our work aimed to evaluate the effects of the anti-PD-1 nivolumab (NIVO) on CRC cells.
Methods In vitro NIVO-treated human colon cancer cells (HT29, HCT116, and LoVo) were evaluated for cell growth, chemo/radiotherapeutic sensitivity, apoptosis, and spheroid growth. Total RNA-seq was assessed in 6–24 hours NIVO-treated human colon cancer cells HT29 and HCT116 as compared with NIVO-treated PES43 human melanoma cells. In vivo mice carrying HT29 xenograft were intraperitoneally treated with NIVO, OXA (oxaliplatin), and NIVO+OXA, and the tumors were characterized for growth, apoptosis, and pERK1/2/pP38. Forty-eight human primary colon cancers were evaluated for PD-1 expression through immunohistochemistry.
Results In PD-1+ human colon cancer cells, intrinsic PD-1 signaling significantly decreased proliferation and promoted apoptosis. On the contrary, NIVO promoted proliferation, reduced apoptosis, and protected PD-1+ cells from chemo/radiotherapy. Transcriptional profile of NIVO-treated HT29 and HCT116 human colon cancer cells revealed downregulation of BATF2, DRAM1, FXYD3, IFIT3, MT-TN, and TNFRSF11A, and upregulation of CLK1, DCAF13, DNAJC2, MTHFD1L, PRPF3, PSMD7, and SCFD1; the opposite regulation was described in NIVO-treated human melanoma PES43 cells. Differentially expressed genes (DEGs) were significantly enriched for interferon pathway, innate immune, cytokine-mediated signaling pathways. In vivo, NIVO promoted HT29 tumor growth, thus reducing OXA efficacy as revealed through significant Ki-67 increase, pERK1/2 and pP38 increase, and apoptotic cell reduction. Eleven out of 48 primary human colon cancer biopsies expressed PD-1 (22.9%). PD-1 expression is significantly associated with lower pT stage.
Conclusions In PD-1+ human colon cancer cells, NIVO activates tumor survival pathways and could protect tumor cells from conventional therapies.
- programmed cell death 1 receptor
- gastrointestinal neoplasms
Data availability statement
Data are available on reasonable request.
This is an open access article distributed in accordance with the Creative Commons Attribution Non Commercial (CC BY-NC 4.0) license, which permits others to distribute, remix, adapt, build upon this work non-commercially, and license their derivative works on different terms, provided the original work is properly cited, appropriate credit is given, any changes made indicated, and the use is non-commercial. See http://creativecommons.org/licenses/by-nc/4.0/.
Statistics from Altmetric.com
Introduction
Colorectal cancer (CRC) is one of the most prevalent and deadly tumors worldwide.1 2 Despite improved knowledge, diagnostics, and screening, up to 30% of patients present with synchronous metastases3 and 40%–50% will eventually develop metastases within 3 years from diagnosis.4 Tumor microenvironment (TME) plays a crucial role in CRC development as the validated Immunoscore (CD3+ and CD8+ T cell infiltration) represents a powerful prognostic factor in localized CRC.5 Based on intrinsic gene expression, four biologically distinct consensus molecular subtypes (CMS) were described for CRC.6 7 CMS1, defined by an upregulation of immune genes, is highly associated with microsatellite instability (MSI-H). CMS2 is characterized by canonical pathway upregulation as defined by the adenoma-carcinoma sequence. Genetically chromosomal unstable tumors are associated with mutations in APC, p53, and RAS. CMS2 represents an overactivated epithelial growth factor pathway with higher expression of epidermal growth factor receptor (EGFR)/EGFR ligands and human epidermal growth factor receptor 2 overexpression. CMS3 is characterized by metabolic changes in glutaminolysis and lipidogenesis. Finally, CMS4 is featured by an activated tissue growth factor (TGF)-β pathway and epithelial–mesenchymal transition. The molecular characterization recapitulates cancer cells and TME features but has a limited impact on therapy choice.7 Conventional treatment for advanced/metastatic disease is based on fluoropyrimidines plus oxaliplatin or irinotecan chemotherapy plus biological agents (bevacizumab and EGFR targeting agents) according to molecular profiling.8 The majority of human CRC is resistant to immune-checkpoint blockade (ICB)-based cancer immunotherapy as only 15% shows MSI-H,9 presents high tumor mutation burden (TMB), increased neoantigens and intratumoral lymphocytic infiltration.10 11 The underlying mechanism of ICB resistance is incompletely understood.12 In 2017, the US Food and Drug Administration (FDA) granted the anti-programmed cell death-1 (PD-1), nivolumab (NIVO) approval for treatment of DNA mismatch repair-deficient (dMMR) and MSI-H metastatic CRC (mCRC), progressing after treatment with fluoropyrimidine, oxaliplatin and irinotecan.13 Most recently, the FDA approved anti-PD-1 pembrolizumab (Keytruda) for first-line treatment of patients with unresectable or metastatic MSI-H/dMMR CRC.14 Programmed death-ligand 1 (PD-L1) activates PD-1 in melanoma cells with a tumor-promoting effect through mammalian target of rapamycin signaling, independent of adaptive immunity. These effects were suppressed by anti-PD-1 mAb (aPD-1).15 Tumor cell intrinsic PD-1 signaling has been reported in liver, bladder, melanoma, thyroid, pancreatic cancer, as well as in non-small cell lung cancer (NSCLC).15–20 Differently from melanoma, in which PD-1 signaling activates oncogenic functions, in lung cancer, PD-1 signaling promotes growth inhibition.17 21 Beyond immune cell expression, little is known about the biological significance of the intrinsic PD-1 pathway in CRC. The role of intrinsic PD-1 expression and signaling in relation to anti-PD-1 immune therapy was evaluated in human CRC cells.
Methods
Reagents
Soluble PD-L1 (sPD-L1) was obtained from R&D Systems (Minneapolis, Minnesota, USA), and nivolumab was kindly provided by Dr Maiolino-INT-Fondazione G. Pascale, Naples. Recombinant human IFN-γ or IFN-α was obtained from R&D Systems. Nivolumab F(ab)2 fragments were generated using Pierce F(ab)2 Preparation Kit (cat. TS-44988, Thermo Fisher Scientific).
Cell lines
Human CRC cells (HCT116, LoVo, and SW620) were cultured in high-glucose Dulbecco’s modified Eagle’s medium (Gibco BRL, Grand Island, New York, USA). HT29 and COLO205 were cultured in RPMI (Invitrogen, San Diego, California, USA). PES43 human melanoma cancer cells22 were cultured in Iscove’s Modified Dulbecco’s Medium (Gibco BRL). MOLT4 (human T-cell acute lymphocytic leukemia cells) and 8505C (human anaplastic thyroid cancer cells) were cultured in RPMI. Medium was supplemented with 10% fetal bovine serum (FBS), penicillin (100 µg/mL), and streptomycin (100 µg/mL) (Invitrogen). Cells were maintained in an incubator with a humidified atmosphere of 5% CO2 at 37°C and were proved mycoplasma-free. HT29, HCT116, LoVo SW620, and Colo205 human colon cancer cells’ molecular characteristics are described in online supplemental tables 1 and 2.
Supplemental material
Cell growth and cytotoxicity
About 20–50×104 cells/well were seeded in a 6-well plate in a medium culture containing 10% FBS. After 24 hours, the medium was replaced and NIVO (100 nM–1µM–10µM), sPD-L1 (1 µg/mL), and combination of NIVO and sPD-L1 were added. Cells were counted on hemocytometer. For cytotoxicity assay, 2000 cells/well were seeded in triplicate into 96-well plates, and 24 hours later, the cells were treated with 5-fluoruracil (5-FU), oxaliplatin (OXA), cisplatin, (CDDP), doxorubicin (Doxo) and paclitaxel (Tax), irinotecan (IRI) plus/minus NIVO (10 µM). Cells were incubated at 37°C with 5% CO2 for 72 hours, followed by SRB assay. The optical density was determined at 540 nm by a microplate reader. IC50 is the concentration at which growth was inhibited by 50%. Relative ratio (RR) is defined as the ratio of cytotoxic drugs plus NIVO IC50/cytotoxic drugs IC50. For irradiation, cells were plated in 6-well plate treated with NIVO (1 and 10 µM) and irradiated with 2, 4, and 8 Gy dose of 6 MV X-ray of a linear accelerator. After 6 days, colonies were counted.
Three-dimensional spheroids growth
About 70%–80% grown human colon cancer cells (HT29, HCT116, and SW620) were detached with trypsin and vital cells counted (Trypan blue exclusion). Further, 1×10⁴ cell/mL was evaluated for sphere-forming and drug sensitivity OXA (10 µM), NIVO (10 µM), and combination. About 50 µL media containing treated 500 cells was seeded into inverted Petri dish lid. At least 20 drops per dish were plated to develop hanging drops grown for 72 hours. The images of individual spheroids were captured via optical inverted microscope (using ×10 objective) (Zeiss, Germany) on day 3. Spheroid images were analyzed with ImageJ software.
Flow cytometry
For cell-surface markers, cells (100,000 cells/tube) were harvested and incubated with specific or isotype control antibodies in the dark for 30 min at 4°C in staining buffer. PE anti-human CD279 (PD-1) antibody was from Miltenyi Biotec (Bergisch Gladbach, Germany), PE mouse anti-human CD274 (clone MIH1) (PD-L1) antibody was from BD Biosciences (San Jose, California, USA). Isotype control antibody PE mouse IgG2b and isotype control antibody PE mouse IgG1, k from BD Biosciences. Stained cells were evaluated with a FACSAriaIII (BD Biosciences) and all data were analyzed using Facs-Diva software V.8.1 (BD Biosciences).
Immunoblotting
Cells were lysed in a whole-cell buffer containing protease and phosphatase (10 mM NaF, 10 mM Na-pyrophosphate, 1 mM Na3VO4) inhibitors. Rabbit monoclonal antibodies for p44/42 MAPK (ERK1/2), phospho-p44/42 MAPK (ERK1/2; T202/Y204), phosphor-P38 MAPK (T180/Y182), P38 MAPK antibodies were from Cell Signaling (Danvers, Massachusetts, USA). Secondary antibodies include goat anti-rabbit-HRP (Jackson ImmunoResearch, West Grove, Pennsylvania, USA). Protein expression was detected with Image Acquisition using ImageQuant LAS 4000 (GE Healthcare, Pittsburgh, Pennsylvania, USA).
RNA, cDNA, and real-time PCR
RNA was extracted from cell lines with TRIzol Reagent (Invitrogen, Carlsbad, California, USA) following the manufacturer’s instructions. Quantitative real-time PCR was performed using SYBR Green PCR Master Mix (Applied Biosystems, Foster, California, USA) and data were collected and quantitatively analyzed on an QuantStudio 5 Real-Time PCR System with 2−∆Ct method. Relative mRNA expression was normalized with β-actin (ACTB) gene expression. Primer sequences are reported in online supplemental table 5. The primer pairs were subjected to a specificity checking process through the Primer-BLAST publicly available tool.
Annexin V–propidium iodide (PI) assay
Cell apoptosis was detected by Annexin V-FITC Apoptosis Detection Kit (eBioscience, Invitrogen by Thermo Fisher Scientific) according to the manufacturer’s instructions. In brief, cells were suspended in binding solution and labeled with 5 µL of annexin V-FITC and 5 µL of PI, followed by incubation at room temperature in the dark for 15 min. Analysis was carried out within 1 hour using the flow cytometer (FACS ARIAIII; BD Biosciences). Annexin V fold change is derived by the ratio control/treated cells.
In vivo study
Female Athymic Nude (Hsd:Athymic Nude-Foxn1nu) mice were subcutaneously injected with HT29 (5×10⁶) colon cancer cells. When tumor mass reached ~50 mm3, treatment was conducted intraperitoneally with anti-human PD-1 (NIVO) monoclonal antibody (5 mg/kg intraperitoneal, two times per week/3 weeks), oxaliplatin (OXA) (10 mg/kg weekly), NIVO +OXA combination, or phosphate buffered saline (PBS) as control. Tumor length and width were measured using a digital caliper. Tumor volume was estimated with the formula: (L×W2)/2. Mean tumor volumes were evaluated for each mouse ±SEM (n=6 per group) three times/week (n=24). The experimental unit is the individual mouse and, a sample size of 24 mice was selected using the G*Power software package, for a priori repeated measures analysis of variance (ANOVA) of tumor volume across time with large effect size=0.77 based on pilot experiments, achieved a power >85%; alpha=0.05. Mice with tumor ulceration were excluded from analysis. Animals were euthanized, the tumors collected and fixed overnight in neutral pH-buffered formalin. All animal studies were performed in compliance with national regulations on the protection of animals used for scientific purposes (Italian decree n. 26 dated 3 April 2014 acknowledging European Directive 2010/63/EU) with the ARRIVE (Animal Research: Reporting of In Vivo Experiments) guidelines and with the principle of the ‘3Rs’ (Replacement, Reduction and Refinement), Italian Ministry of Health permission (147/2017-PR 13/02/2017). Researchers were not blinded to group identity and randomization of animal groups was done when appropriate.
Immunohistochemistry (IHC)
In vivo studies
Tumor histology was evaluated through H&E staining on a Dako autostainer (Agilent). Three micrometer sections from formalin-fixed, paraffin-embedded (FFPE) HT29 tumor were incubated with the appropriate serum designed for blocking endogenous mouse IgG and non-specific background in mouse tissues (Rodent Block M; Biocare Medical), and then incubated overnight at 4ºC using primary antibodies: anti-Ki-67 (1:75, Ki-67 Antigen (Dako Omnis) Clone MIB-1); cleaved caspase-3 antibody (1:250, Monoclonal Rabbit IgG Clone #269518 anti-human cleaved caspase-3 (Asp175) antibody); mouse monoclonal anti-human PD-1 (1:50 [NAT105] Abcam), phospho-p44/42 MAPK (ERK1/2) (Thr202/Tyr204) (1:400, D13.14.4E, XP Rabbit mAb #4370-CST), phospho-p38 MAPK (Thr180/Tyr182) (1:400, D3F9, XP Rabbit mAb #4511-CST). Anti-PD-1, predilute, NAT105 (Cell marque) in a Benchmark XT (Ventana Medical Systems) was used for section from patients with colon cancer. The IHC staining was evaluated in at least 10 consecutive not overlapping high-power field (HPF) ×400 magnification (0.237 mm2/field) in at least five areas using an Olympus BX51 microscope (Olympus, Tokyo, Japan). Stained sections were independently evaluated by expert pathologist/researchers blinded to initial assessments.
Patients’ study
FFPE tissue blocks derived from 48 surgically collected colon cancer tumor samples were obtained. Sections of 4 µm were obtained, placed on slides with permanent positive charged surface, and processed as above. The samples were incubated overnight at 4°C using primary antibody (CD279/PD1 polyclonal antibody, #PA5-20350 dilutions 1:50) (Thermo Fisher Scientific).
Statistical analysis
SPSS software (V.20.0) were used for statistical analysis. Data were expressed as mean±SD or SEM as stated in figure legends. The continuous variables were compared using an unpaired Student’s t-test or a Mann-Whitney U test if the variables were not normally distributed. For multiple groups comparison. Kruskal-Wallis test followed by Dunn’s multiple test was used to determine significantly different groups. For multiple groups comparison, repeated measures ANOVA (RMANOVA) with Tukey’s HSD post hoc test was used to determine treatment effect over time. The χ2 test was used to compare the frequency and percentage in categorical variables. Spearman’s rank correlation was use to evaluate correlation between two continuous variables. Linear regression analysis was used to modeling the relationship between two variables. P<0.05 was considered to indicate a statistically significant difference.
RNA libraries preparation, sequencing procedures, and data analysis
Total RNA was quantified using the Qubit fluorometer (Thermo Fisher) with Qubit RNA HS Assay Kit (Thermo Fisher). Polyadenylated RNA libraries were prepared using QIAseq stranded mRNA Select Kit (Qiagen). The mRNA Enrichment was obtained starting from 1 μg of total RNA using Oligo-dT probes attached to the surface of magnetic beads. Fragmentation was then performed at the reaction temperature of 95°C to obtain an insert size of ~350 bp. Double-stranded cDNA was achieved by a reaction with RNase H-Reverse Transcriptase in combination with random primers followed by a second-strand synthesis, end repair, and A-addition step. The dual index technology was used to sequence multiple samples, thanks to the ligation of Illumina-compatible adapters. Finally, the last amplification step was performed on the purified libraries using the CleanStart PCR Mix, also able to degrade contaminating material. QIAseq Beads were used for reaction clean ups between protocol steps. The quality control and quantification of libraries were performed using the Agilent 2100 Bioanalyzer instrument and High Sensitivity DNA Kit (Agilent). Each QIAseq Stranded library was diluted to a concentration of 4 nM. Then, the libraries with different sample indexes were pooled in equimolar amounts. The pooled libraries at concentration of 1.6 pM were sequenced on Illumina NGS NextSeq 500 platform using 2×150 bp paired-end mid-output sequencing kit (Illumina).
RNAseq FASTQ sample sequences were mapped on HG38 genome (December 2013 assembly) with STAR software (V. 2.7.3a) and default options. The resulting BAM files were then processed with feature Counts function present into the Rsubread R/Bioconductor package (V.2.4.2) on Ensembl HG38 GTF (V.102) to produce a count matrix of 64,252 genes and 46 samples. To remove lowly expressed genes, a proportion test has been performed by the aid of the filtered.data function present into the NOISeq R/Bioconductor package (V.2.34.0) resulting in 16,842 genes for the 46 samples matrix. Samples were then divided for cell line and normalized with RUVs procedure present in the RUVSeq R/Bioconductor package (V.1.24.0). A different ‘k’ parameter is chosen for each cell line on the best normalization afforded for each case (Cell Line HCT116 k=3, HT29 k=5, PES43 k=1). Then, for each cell line to test differentially expressed genes, the glmQLFit combined with glmQLFTest from the edgeR R/Bioconductor package (V.3.32.0). Functional enrichment analysis was then performed with gProfiler2 R package (V.0.2.0). The data discussed in this publication have been deposited in NCBI’s Gene Expression Omnibus23 and are accessible through GEO Series accession number GSE174252 (https://www.ncbi.nlm.nih.gov/geo/query/acc.cgi?acc=GSE174252).
Results
Human colon cancer cells express functional PD-1 that is not regulated by IFN-α/γ. PD-1 blockade increases human colon cancer cell growth
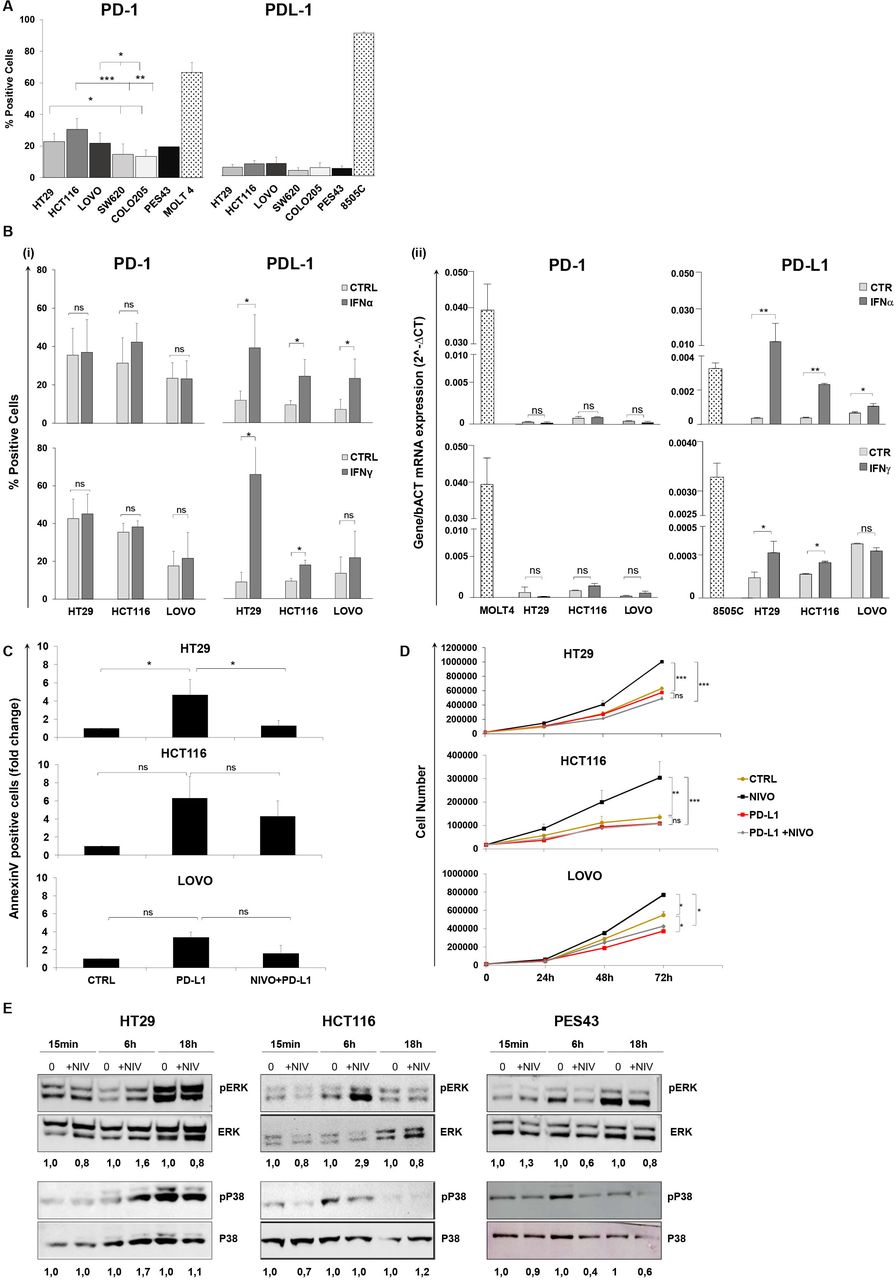
PD-1 and PD-L1 levels were evaluated in human colon cancer cells. PD-1 but not PD-L1 was detectable in HT29, HCT116, LoVo, SW620, and Colo205 cells (figure 1A and online supplemental figure 1). HT29, HCT116, and LoVo significantly overexpressed PD-1 as compared with SW620 and Colo205 cells. As PD-L1 is IFN-induced,24 25 the effect of type I (IFN-α) and type II (IFN-γ) interferons (IFNs) was studied on PD-1 and PD-L1 expression. Neither IFN-α nor IFN-γ induced PD-1, while both IFN-α and IFN-γ increased PD-L1 expression in HT29 and HCT116 cells, at protein (figure 1B(i)) and at transcriptional level (figure 1B(ii)).
Supplemental material

Human colon cancer cells express functional PD-1 that is not regulated by IFN-α/γ. PD-1 blockade increases human colon cancer cell growth. (A) Percentages (mean±SD) of PD-1 and PD-L1 surface protein expression on five colon cancer cells (HT29, HCT116, LoVo, SW620, Colo205), as determined by flow cytometry. Bar charts show combined results from at least three independent experiments. PES43 (human melanoma cancer cell line) and MOLT4 (human T-cell acute lymphocytic leukemia cell line) were used as PD-1 positive control and 8505C (human anaplastic thyroid cancer cell line) was used as PD-L1 positive control. *P value <0.05; **p value <0.01; ***p value <0.001. Student’s t-test was used. (B) Histograms represent changes in (i) % fluorescence intensity by flow cytometry (mean±SD) and (ii) mRNA expression indicated as 2∆Ct for PD-1 and PD-L1 in HT29, HCT116, and LoVo cells treated with IFN-γ (50 IU/mL) for 48 hours and IFN-α (3000 IU/mL) for 24 hours. Bar graphs represent the average of at least three experiments. P value >0.05 ns (not significant); *p value <0.05. Student’s t-test was used. (C) HT29, HCT116, and LoVo cells were treated with sPD-L1 (1 µg/mL) or sPD-L1 +NIVO (10 µM) for 24 hours. Cell apoptosis rates were detected through Annexin V and propidium iodide (PI) dual staining method. Relative fold change of apoptotic cells is shown in the histogram (mean±SD). Bar graphs represent the average of two experiments. P value >0.05 ns; *p value <0.05. Student’s t-test was used. (D) HT29, HCT116, and LoVo growth curves following NIVO (10 µM), sPD-L1 (1 µg/mL), or combination sPD-L1 +NIVO treatment for 24, 48, and 72 hours. All data are representative of at least two experiments. P value >0.05 ns; *p value <0.05; **p value<0.01; ***p value <0.001. Student’s t-test was used. (E) Immunoblot analysis (representative of n=2 independent experiments) of phosphorylated (p) and total ERK1/2 and P38 in HT29, HCT116, and PES43 cell lines treated with NIVO (10 µM) for 15 min, 6–18 hours. The numbers above the gel lanes represent the relative protein level, which was determined from the band intensity using ImageJ software, and normalized relative to the total protein. IFN, interferon; NIVO, nivolumab; sPD-L1, soluble PD-L1.
To evaluate the effect of cell-intrinsic PD-1 signaling on apoptosis and cell growth, human colon cancer cells HT29, HCT116, and LoVo were treated with sPD-L1 and NIVO. As shown in figure 1C, soluble PD-L1 (sPD-L1) increased apoptosis in HT29, HCT116, and LoVo by 4.7±1.6-fold, 6.3±2.4-fold, and 3.4±0.6-fold, respectively, while NIVO rescued cells from apoptosis (online supplemental figure 2). In figure 1D, NIVO increased cell growth (1.6-fold, 2.5-fold, 1.4-fold post 72 hours in HT29, HCT116, and LoVo, respectively), while sPD-L1 reduced it. Low doses of NIVO (0.1–1 µM) also increased the proliferation of HT29, HCT116, and LoVo cells (online supplemental figure 3). Interestingly, NIVO did not affect cell growth in SW620 and Colo205 human colon cancer cells expressing lower PD-1 (online supplemental figure 4). To exclude the Fc receptors engagement on tumor-associated macrophages,26 Fc receptors and the efficacy of the anti-PD-1 F(ab)2 were evaluated. The Fc receptors were minimally detected or undetectable in HCT116, LoVo, and SW620. The unique FcγR detected in HT29 is FcγRII (CD32). Moreover, anti-PD-1/F(ab)2 fragment modified cell growth as NIVO (online supplemental figure 5A,B). To dissect the downstream pathway following PD-1 engagement, (p)-ERK1/2 and (p)-P38 were evaluated in HT29, HCT116, and PES43 cells. Six-hour NIVO (10 µM) induced pERK in HT29 and HCT116 cells, while 6-hour NIVO (10 µM) reduced pERK in human melanoma cell PES43 (figure 1E). Moreover, 6-hour NIVO (10 µM) increased pP38 in HT29, while, as expected for K-RAS mutant cell HCT116,27 NIVO did not affect pP38 (figure 2C). Conversely, 6-hour NIVO (10 µM) reduced pP38 in PES43. These data suggest that PD-1 inhibited proliferation by suppressing P38 and ERK signaling.

PD-1 blockade reduces the effect of chemo/radiotherapy on human colon cancer cells. (A) HT29, HCT116, and LoVo cells were treated with NIVO (1 µM), OXA (40 µM), 5-FU (50 µM), or NIVO +5-FU/OXA for 24 hours. Annexin V/PI analysis was performed. Bar graphs represent relative fold change of apoptotic cells obtained from at least two independent experiments±SD. P value >0.05 ns (not significant); *p value <0.05; **p value <0.01; ***p value <0.001. (B) (i) HT29 and HCT116 cells were exposed to 2–4–8 Gy plus/minus NIVO (1–10 µM) for 1 week. Survival curves for radiation plus NIVO treatment in HT29 and HCT116 cells. Data represent means obtained from two experiments±SD. P value >0.05 ns ; *p value <0.05; ***p value <0.001. Student’s t-test was used. (ii) Representative images of a colony formation assay (left) and quantification data (right) for HT29 and HCT116 cells treated with NIVO (1 µM) and F(ab)2 (1μM). Data are representative of two experiments±SD. *P value <0.05; **p value <0.01. Student’s t test was used. (C) Spheroids growth of HT29, HCT116, and SW620 72 hours treated with OXA (10 µM), NIVO (10 µM), and combination. Images were obtained at optical inverted microscope (using ×10 objective) (Zeiss, Germany) on day 3. Spheroid images were typically analyzed with ImageJ software. Grouped dot plot express spheroid area (mean±SD). For each data point, at least nine spheroids were analyzed. Data are representative of three experiments±SD. 5-FU, 5-fluoruracil; NIVO, nivolumab; OXA, oxaliplatin; PI, propidium iodide.
To further investigate the role of downstream signaling in PD-1-mediated cell proliferation, HT29 and HCT116 cell growth was evaluated in the presence of MEK/ERK1/2, AKT, or P38 inhibitors (online supplemental figure 6). As shown in online supplemental figure 6, the kinase inhibitors significantly reverted NIVO-induced cell growth in HT29 cells (upper panel). In HCT116, both AKT and MEK/ERK1/2 inhibitors reverted NIVO-induced cell growth, while as anticipated, the P38 inhibitor did not affect proliferation27 (lower panel).
NIVO protects colon cancer cells from chemo/radiotherapy and potentiates spheroids growth
To investigate the effect of PD-1 signaling on chemotherapy, human colon cancer cells were treated with 5-FU, OXA, CDDP, DOXO, IRI, and TAX in the presence of NIVO for 72 hours. As summarized in table 1, NIVO reduced the efficacy of chemotherapy, increasing the 5-FU (3.1-fold, 2.2-fold, and 1.9-fold), OXA (2.8-fold, 4.8-fold, and 15.8-fold), and IRI (2.2-fold, 1.7-fold, and 2.9-fold) IC50 in HT29, HCT116, and LoVo, respectively (table 1). In addition, as shown in table 1, NIVO increased the IC50 for CDDP, DOXO, and TAX. Conversely, in SW620 cells, low PD-1 expressing NIVO did not affect chemosensitivity. As PD-1 signaling increased cell proliferation and survival in melanoma,15 cytotoxicity was evaluated in human melanoma PES43 cells. PES43 are more sensitive to DOXO and TAX in the presence of NIVO, as previously reported for ovarian cancer cells.28 The percentage of apoptosis was reduced when NIVO was added to 5-FU and OXA in HT29, HCT116, and LoVo cells (figure 2A and online supplemental figures 7,8).
The IC50 (mean±SEM) values for 5-fluoruracil, oxaliplatin, cisplatin, doxorubicin, paclitaxel, and irinotecan with or without nivolumab treatment in HT29, HCT116, LOVO, SW620, and PES43 cell lines
HCT116 and HT29 cells were exposed to 2–4–8 Gy of X-ray in the presence of NIVO (figure 2B(i)). In HT29 and HCT116 cells, NIVO increased resistance to radiation, promoting cell growth (1.3-fold and 1.7-fold at 4 and 8 Gy in HT29 and 1.6-fold, 1.8-fold, and 2.2-fold at 2, 4, and 8 Gy in HCT116) (figure 2B(i)). Treatment with NIVO-F(ab)2 (1µM) achieved the same increase in clonal efficiency obtained with NIVO (figure 2B(ii)).
Moreover, to reproduce the three-dimensional interaction of tumor cells and the relative drug sensitivity, the human colon cancer cells HT29, HCT116, and SW620 were tridimensionally cultured in spheroids, and NIVO/NIVO plus OXA efficacy was evaluated. As observed in figure 2C, NIVO treatment (10 µM) enhanced spheroid mean area in HT29 (p<0.001), while OXA significantly reduced the area of spheroid in HT29, HCT116, and SW620 (p<0.001). NIVO rescued OXA effect on HT29 and HCT116 spheroid growth but not on SW620 cells, low PD-1-expressing cells.
NIVO-induced differential gene expression in human CRC cells
RNA-Sequencing was conducted on HT29 and HCT116 treated with NIVO, sPD-L1, and combination sPD-L1 +NIVO for 6–24 hours and compared with PES43 cells. The aim was to identify, among the differentially expressed genes (DEGs), treatment-affected genes in colon cancer cells that are counter-regulated in melanoma cells. As highlighted by the principal component analysis (PCA) in figure 3A, HCT116, HT29, and PES43 cells displayed independent clustering in which the first two components explained ~86% of variability, suggesting a marked difference in global gene expression profiles among the three cell lines. After data normalization, when the PCA is performed on cell lines, clusters are clearly distinct at 6 and 24 hours of treatment for HT29, HCT116, and PES43 with an explained variability of ~35,4% for HCT116, ~24.9% for HT29, and ~59.3% for PES43 (online supplemental figure 9). As shown by the Volcano plots in figure 3B, we identified 8306, 618, and 3846 genes significantly affected, respectively, in PES43, HT29, and HCT116 after 6 hours of NIVO treatment, while 7312, 1147, and 5410 were significantly modified in PES43, HT29, and HCT116 after 24 hours of NIVO treatment. In PES43, a robust increase in NIVO-upregulated genes was detected as compared with HT29 and HCT116 cells (figure 3B). Similar differences were observed in DEGs induced by sPD-L1 (online supplemental figure 10A) or NIVO +PD-L1 (online supplemental figure 10B) after 6 (online supplemental figure 10A,B, upper) and 24 hours (online supplemental figure 10A,B, lower) in PES43, HT29, and HCT116. We focused on the genes commonly regulated among HT29, HCT116, and PES43, identifying 149 and 299 genes shared after 6 and 24 hours of treatment with NIVO, respectively, as depicted in the Venn diagram in figure 3C (online supplemental figure 11). Among genes commonly modulated at 6 and 24 hours of treatment with NIVO, 19 (NIVO-6 hours) and 67 (NIVO-24 hours) genes revealed an inverse correlation (based on logFC) between colon cancer cells and PES43 (figure 3D). As shown in figure 3D, 6 hours after NIVO, six interesting genes were upregulated in PES43 and downregulated in HT29 and HCT116 (BATF2, DRAM1, FXYD3, IFIT3, MT-TN, TNFRSF11A) and seven genes were downregulated in PES43 and upregulated in HT29 and HCT116 (CLK1, DCAF13, DNAJC2, MTHFD1L, PRPF3, PSMD7, SCFD1) (figure 3D and online supplemental table 3). After 24 hours of NIVO, gene regulation is generally milder. Commonly affected genes were upregulated in PES43 and downregulated in HT29 and HCT116 (AMIGO2, CLDN12, DRAM1, DUSP5, GRB10, GULP1, HSPA5, RESF1, CDKN2B, DLGAP1-AS2, EGR1, NDRG1, SAMD9) and 24 genes were downregulated in PES43 and upregulated in HT29 and HCT116 (ABCC10, AP2A1, COPZ1, DGKQ, DPP9, GNE, GYS1, HNRNPUL1, IDH3G, LRRC47, MAGED1, MVK, NSDHL, NT5DC2, PIAS4, PRR11, SF3B2, SPRYD3, THRA, TOM1, UBA1, UBE4B, USP5, XPO7) (figure 3D and online supplemental table 4). At 6 hours (figure 4, upper part), BATF2, IFIT3, and TNFRSF11A were upregulated in PES43. Thus, it appears that 6 hours of NIVO treatment impacts on gene expression conferring to HT29 and HCT116 a more aggressive phenotype and to PES43 a less aggressive phenotype, with tumor suppressor reduction and regulating genes of innate immune response, type 1-IFN signaling, and cytokine-mediated signaling pathway (figure 4, upper panel). These features, although less clearly designed, are kept at 24 hours of treatment (figure 4, lower panel). qRT-PCR validation was conducted on 12 genes differentially expressed between HT29 and HCT116 versus PES43 after 6 hours of NIVO treatment (BATF2, DRAM1, FXYD3, IFIT3, TNFRSF11A, CLK1, DCAF13, DNAJC2, MTHFD1L, PRPF3, PSMD7, SCFD1) and 12 genes affected by 24-hour NIVO treatment (DRAM1, DUSP5, EGR1, DPP9, GNE, MAGED1, NT5DC2, PIAS4, PRR11, THRA, UBE4B, USP5). qPCR profiles were consistent with the patterns of expression revealed by the RNA-Seq (online supplemental figure 12A,B). Linear regression analysis for the 24 selected DEGs/cell line between RNA-seq (x axes) and qRT-PCR (y axes) revealed correlations ranging from 0.78 to 0.83 for Pearson’s correlation at P value <0.0001 (online supplemental figure 12C).

Differentially expressed genes (DEGs) in NIVO-treated human colon cancer and melanoma cells. (A) Principal component (PC) analysis was performed for the samples using the gene expression values. Clustering of HCT116 cells (red dots), HT29 cells (green dots), and PES43 cells (blue dots) treated with PBS, NIVO (10 µM), sPD-L1 (1 µg/mL), and NIVO +sPD-L1. (B) Volcano plots of genes differentially expressed in NIVO-treated PES43, HT29, and HCT116 for 6 hours (upper panel) and 24 hours (lower panel) in pairwise comparisons versus untreated cells. The log2 fold change difference is represented on the x-axis and –log10 of corrective p value (q-value) is represented on the y-axis. Each point represents a gene. Red points indicate genes called as differentially expressed (DE) at adjusted p value (adjP) ≤0.05. (C) Comparison of the DEGs on HCT116, HT29, and PES43 cells on stimulation with NIVO for 6 hours (left panel) and 24 hours (right panel) using Venn diagrams. (D) Heat maps of genes differentially expressed in NIVO-treated PES43, HT29, and HCT116 for 6 hours (left panel) and 24 hours (right panel). NIVO, nivolumab; sPD-L1, soluble PD-L1.

GO functional enrichment analysis of differentially expressed genes (DEGs) in NIVO-treated human colon cancer and melanoma cells. GO Chord plot of selected common genes differentially expressed in the PES43, HCT116, and HT29 cells treated with NIVO for 6 hours (upper panel) or for 24 hours (lower panel). The genes are linked to their assigned pathway via colored ribbons. Genes are ordered according to the observed log2 fold change (LogFC), which is displayed in descending intensity next to the selected genes from red (higher expression during NIVO treatment) to blue (lower expression during NIVO treatment). NIVO, nivolumab.
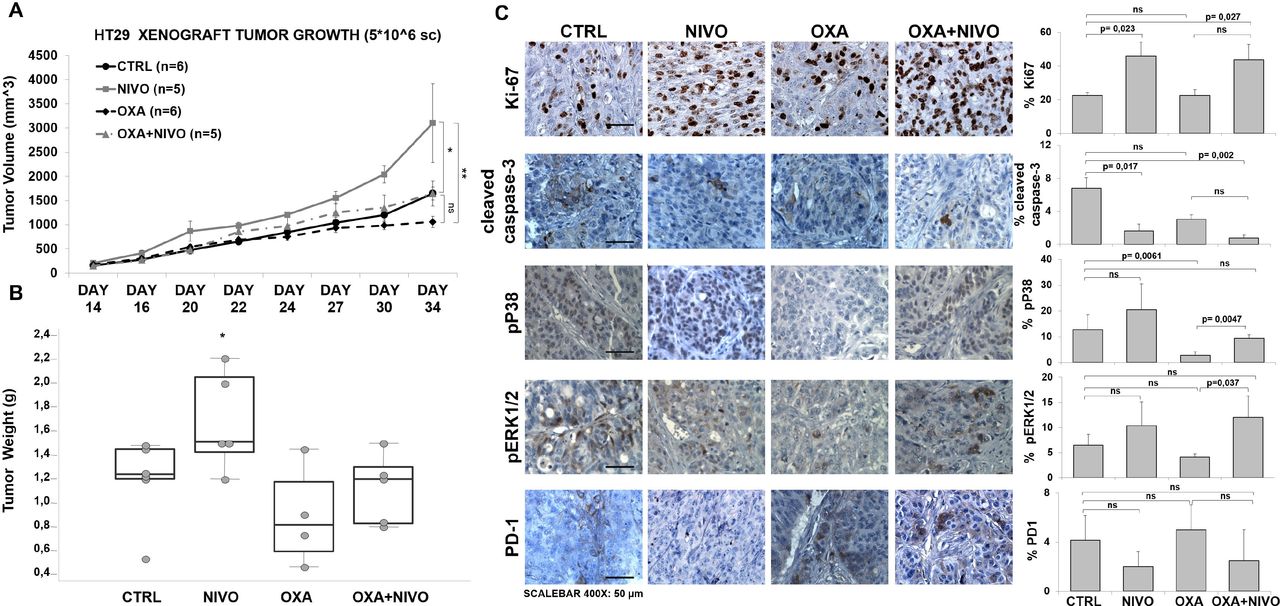
NIVO potentiates in vivo growth of HT29 tumors
The NIVO effect was evaluated in a HT29 xenograft model. HT29 cells were inoculated in CD1 athymic mice and, when the tumors reached 50 mm3, mice were randomized in four groups and treated twice a week with intraperitoneal PBS (n=6), NIVO (n=6), OXA (n=6), and combination NIVO +OXA (n=6) for 3 weeks. Tumor histology was evaluated with H&E (online supplemental figure 13). Consistent with the in vitro experiments, NIVO significantly increased tumor growth by 1.88-fold (figure 5A and online supplemental figure 13). As shown in figure 5A, at day 34, the mean tumor volume (mm3) was 1059.5±117.4 in OXA-treated mice, 3102.5±814.8 in NIVO-treated mice, and 1645.7±261.6 in OXA +NIVO-treated mice, 2.9-fold and 1.6-fold more than the OXA-treated mice, respectively, suggesting that PD-1 blockade increases tumor growth and reduces the efficacy of chemotherapy. Equally, NIVO increased tumor mass in comparison with the control group (figure 5B). Tumors were further characterized for Ki-67, cleaved-caspase-3, pERK1/2 and pP38, PD-1 expression. NIVO significantly increased the fraction of Ki-67 expressing cells (p=0.023) as compared with the untreated and to the combination with OXA (p=0.027) (figure 5C). Moreover, NIVO and NIVO plus OXA significantly reduced the percentage of apoptotic cells as revealed through cleaved caspase-3 detection (1.62%±1.89% and 0.76%±0.64% vs 6.8±3.3; p=0.010 and p=0.002, respectively). As shown in figure 5C, although not statistically significant, NIVO-treated tumors expressed higher pP38 as compared with untreated tumors. Interestingly, OXA-treated tumors displayed significantly low of pP38 positive cells (p=0.0061), while pP38 positive cells increased in NIVO plus OXA-treated tumors (p=0.0047) suggesting higher cell proliferation within the NIVO-treated tumors. In addition, pERK1/2 significantly increased in OXA plus NIVO as compared with the OXA-treated tumors (figure 5C). Although not statistically significant, PD-1 reduction was detected in both NIVO and NIVO +OXA-treated tumors (figure 5C).
PD-1 blockade accelerated the growth of subcutaneous HT29 tumors and decreased efficacy of chemotherapy. Tumor growth curve (caliper tumor volumes±SEM) (A) and tumor weight (grams) (B) of HT29 tumor subcutaneously implanted in CD1 athymic mice treated as indicated. (C) Immunohistochemistry (IHC) for Ki67, cleaved caspase-3, pP38, pERK1/2, PD-1. Representative microphotographs (left) show localization of selected markers. The scale bars at the bottom of the figure indicate 50 µm for ×400 magnification. P value <0.05 was considered statistically significant for Kruskal-Wallis test followed by Dunn’s multiple comparison. Bar graph (right) illustrates quantification of immunohistochemistry staining from collected tumors (means±SD). NIVO, nivolumab; OXA, oxaliplatin; PD-1, programmed cell death-1.
PD-1 is expressed in human CRC
The Cancer Genome Atlas (TCGA) database demonstrated that the PDCD1 gene encoding PD-1 was widely transcribed in 17 cancers including CRC (online supplemental figure 14). However, colon cancer tissues include infiltrated lymphocytes. Forty-eight paraffin-embedded colon cancer samples were analyzed for PD-1 expression through IHC. PD-1 expression is observed in TME and cancer cells (online supplemental figure 15). Clinical-pathologic features showed that size of primary tumors is significantly associated with PD-1 expression (p=0.041) (table 2). Of note, PD-1 expression was mainly retrieved in colon cancer in the mucinous histology (p=0.007) (online supplemental figure 16).
The relationship between PD-1 expression and clinical-pathologic features of human colon cancer
Discussion
Herein, PD-1 expression of human colon cancer cells is functional and inhibition through NIVO treatment results in a protective effect-promoting growth, reducing apoptosis and chemo/radio sensitivity in vitro and in vivo. PD-1 expression regulation has been extensively studied as DNA methylation, histone modifications,29 glycosylation/fucosylation30 and ubiquitination31 were reported. While these studies mainly refer to lymphocytes, the PD-1 expression control in epithelial neoplastic cells is poorly defined. Likely, gene copy number, epigenetic alterations, and microenvironment-derived stimulant regulate PD-1 expression in human cancer cells.32–36 As c-Fos binds to the AP-1-binding site and activates Pdcd1 transcription in tumor-infiltrating T cells,29 Fos reduction was retrieved among the genes regulated in NIVO-treated colon cancer cells. Also, FOXO4 and FOXO3 were regulated by NIVO treatment in human colon cancer cells, mechanism previously reported for FOXO1 in antigen-specific CD8 +T cells during chronic lymphocytic choriomeningitis virus infection.32 PD-1 expression is also regulated through proteosomal degradation37; herein, 24 hours of NIVO treatment increased the UBA1 (ubiquitin-like modifier activating enzyme 1) and UBE4B (Ubiquitination factor E4B) in HT29 and HCT116.
Transcriptional profiles identify NIVO-modulated genes regulated in opposite direction between colon cancer and melanoma cells. As previously reported in melanoma, liver, and pancreatic cancer, PD-L1 induction of PD-1 pathway promotes tumor cell growth.15 16 19 38 On the contrary, in NSCLC, PD-L1 induction of PD-1 pathway has a tumor suppressor function.17 We have previously shown that in human melanoma PES43 cells NIVO or pembrolizumab reduced cells growth and inhibited the phosphorylation of ERK1/2, P38 MAPK, AKT, and 4EBP1.39 In contrast, we have shown here that proliferative and survival signaling are induced after NIVO in colon cancer cells. In HT29 and HCT116 human colon cancer cells, PD-1 signaling suppresses cell growth through p38, AKT, and MEK/ERK1/2 pathways. To identify gene expression pathways involved, total RNAseq was evaluated following NIVO treatment in HT29, HCT116 human colon cancer cells and compared with NIVO-treated human melanoma cell PES43. In colon cancer cells, a clear downregulation of BATF2, IFIT3, and TNFRSF11A and induction of CLK1, DCAF3, DNAJC2, MTHFD1L, PRF3, PSMD7, and SCFD1 was reported, while 6 hours of NIVO treatment upregulated BATF2, IFIT3, and TNFRSF11A in PES43 cells. Interestingly, IFIT3 (interferon-induced protein with tetratricopeptide repeats 3) is an interferon-induced protein40 and TNFRSF11A, TNF receptor superfamily member 11a, regulates NF-κB, JNK, ERK1/2, p38α, and AKT/PKB.41 42 BATF2 is a tumor suppressor gene,43 thus BATF2 overexpression and CLK144 downregulation suggest that NIVO reduces aggressiveness in PES43 and potentiates it in human colon cancer cells. MAGED1, a member of the melanoma antigen family significantly overexpressed in melanoma and colon cancer,45 is clearly reduced by NIVO in PES43 cells while upregulated in human colon cells. EGR1, among the most induced gene in PES43 and repressed in colon cancer cells, is a Zinc-finger transcription factor implicated in the regulation of cell growth and metastasis targeting MMP9 and/or MDM.46 Thus, it appears that 6 hours of NIVO treatment impacts on gene expression conferring to HT29 and HCT116, a more aggressive phenotype, and to PES43, a less aggressive phenotype, with tumor suppressor reduction and regulating genes of innate immune response, type 1-IFN signaling and cytokine-mediated signaling pathways. Consistently, PD-1 blockade by NIVO enhanced colon cancer cell growth in vitro and in vivo independently of adaptive immunity. In support of that, blockade of colon cancer-intrinsic PD-1 promoted chemo-radio resistance and impaired apoptosis. Chemotherapy and radiotherapy might potentiate in vivo the efficacy of ICBs by increasing immunogenicity following cellular death (immunogenic cell death, ICD).47 In triple negative breast cancer, a short-term induction with doxorubicin or cisplatin magnifies the response to anti-PD-1 and enriches immune-related genes, including T-cell cytotoxicity and JAK-STAT pathway activation.48 Comparably, radiotherapy has been shown to induce immunogenic cell death, resulting in phagocytosis of tumor cells, processing of tumor antigens, and priming of CD8 +T cells.49 At variance from these studies, our observations provide the first report in which targeting PD-1 results in colon cancer radio/chemo resistance. Although larger validation is needed, tumor-cell intrinsic PD-1/total PD-1 expression could represent a potential biomarker for ICB selection in patients with CRC. As ‘proof of concept’, intrinsic PD-1 expression was retrieved in a subset of patients with colon cancers, mainly in the neoplastic cells, associated with lower pT stage. PD1-blocking treatments in colon cancer PD-1 expressing would enhance tumor cell growth, promoting tumor progression disease. These effects need to be considered in the evaluation of immunotherapy efficacy and in the features of colon cancer immmunoresistance.
Supplemental material
Data availability statement
Data are available on reasonable request.
Ethics statements
Patient consent for publication
Ethics approval
Animal experimentation was done according to the Italian national law (Legislative Decree 26/2014) and Directive 2010/63/EU on the protection of animals used for scientific purposes. Ethical approval was obtained from the Italian Ministry of Health.
References
Supplementary materials
Supplementary Data
This web only file has been produced by the BMJ Publishing Group from an electronic file supplied by the author(s) and has not been edited for content.
Footnotes
DR and CD contributed equally.
Contributors CI designed the experiments, carried out in vitro and in vivo experiments, analyzed and interpreted data, drafted and revised the manuscript. DR analyzed and interpreted RNA-sequencing data, read and approved this manuscript. MN, LP, GR, CD, GG, FA, S Santaga, AMT, CR, and REA performed the technical work and analyses, read and approved this manuscript. PM provided nivolumab, read and approved this manuscript. CDA, AL, and AB carried out in vivo experiments, read and approved this manuscript. CDA, ADM, and FT carried out immunohistochemistry, read and approved this manuscript. FL and NP suggested on the design of experiments. RP, NN, and RMM participated in conception and design of experiments, read and revised the manuscript. S Scala devised the project and designed the experiments, analyzed, and interpreted data, wrote, revised, approved the manuscript and is guarantor of this manuscript.
Funding This study was funded by Associazione Italiana per la Ricerca sul Cancro (IG- 24746).
Competing interests None declared.
Provenance and peer review Not commissioned; externally peer reviewed.
Supplemental material This content has been supplied by the author(s). It has not been vetted by BMJ Publishing Group Limited (BMJ) and may not have been peer-reviewed. Any opinions or recommendations discussed are solely those of the author(s) and are not endorsed by BMJ. BMJ disclaims all liability and responsibility arising from any reliance placed on the content. Where the content includes any translated material, BMJ does not warrant the accuracy and reliability of the translations (including but not limited to local regulations, clinical guidelines, terminology, drug names and drug dosages), and is not responsible for any error and/or omissions arising from translation and adaptation or otherwise.