Article Text

Abstract
Objective To assess the ability of a deep learning model to distinguish between diabetic retinopathy (DR), sickle cell retinopathy (SCR), retinal vein occlusions (RVOs) and healthy eyes using ultra-widefield colour fundus photography (UWF-CFP).
Methods and Analysis In this retrospective study, UWF-CFP images of patients with retinal vascular disease (DR, RVO, and SCR) and healthy controls were included. The images were used to train a multilayer deep convolutional neural network to differentiate on UWF-CFP between different vascular diseases and healthy controls. A total of 224 UWF-CFP images were included, of which 169 images were of retinal vascular diseases and 55 were healthy controls. A cross-validation technique was used to ensure that every image from the dataset was tested once. Established augmentation techniques were applied to enhance performances, along with an Adam optimiser for training. The visualisation method was integrated gradient visualisation.
Results The best performance of the model was obtained using 10 epochs, with an overall accuracy of 88.4%. For DR, the area under the receiver operating characteristics (ROC) curve (AUC) was 90.5% and the accuracy was 85.2%. For RVO, the AUC was 91.2% and the accuracy 88.4%. For SCR, the AUC was 96.7% and the accuracy 93.8%. For healthy controls, the ROC was 88.5% with an accuracy that reached 86.2%.
Conclusion Deep learning algorithms can classify several retinal vascular diseases on UWF-CPF with good accuracy. This technology may be a useful tool for telemedicine and areas with a shortage of ophthalmic care.
- imaging
- retina
- telemedicine
Data availability statement
Data are available upon reasonable request. Data are available upon reasonable request from the corresponding author.
This is an open access article distributed in accordance with the Creative Commons Attribution Non Commercial (CC BY-NC 4.0) license, which permits others to distribute, remix, adapt, build upon this work non-commercially, and license their derivative works on different terms, provided the original work is properly cited, appropriate credit is given, any changes made indicated, and the use is non-commercial. See: http://creativecommons.org/licenses/by-nc/4.0/.
Statistics from Altmetric.com
Key messages
What is already known about this subject?
Ultra-wide field imaging has been previously used to distinguish retinal vascular diseases from controls using deep learning, but no study has aimed at distinguishing multiple retinal vascular diseases.
What are the new findings?
By using a deep learning classifier, multiple retinal vascular diseases may be distinguished, with an accuracy of 88.4%.
How might these results change the focus of research or clinical practice?
A deep learning classifier may be a useful tool in areas with a shortage of ophthalmic care.
Introduction
Diabetic retinopathy (DR), sickle cell retinopathy (SCR) and retinal vein occlusion (RVO) represent the most frequent retinal vascular diseases in ophthalmology.1–6 In 2006, Wong et al7 found a DR prevalence of 33.2% among patients with diabetes. Furthermore, proliferative DR was found in 1.4%–8.8% of patients treated by oral hypoglycaemic drugs.8 Sickle cell disease affects 5/10 000 persons, and the prevalence of SCR is about 10% in these patients.9 The prevalence of RVO, on the other hand, is estimated between 0.3% and 1.6%,10 11 with population-based studies reporting a prevalence rate of 0.5%–2.0% for branch RVO and 0.1%–0.2% for central RVO.12
Retinal lesions associated with these diseases are a leading cause of blindness in patients younger than 60 years of age. In the USA, DR is responsible for about 12% of new cases of blindness.13 Of note, these retinal vascular diseases are associated, at a systemic level, with systemic risk factors, therefore being the cause of significant morbidity.
SCR, when proliferative, can cause blindness in 3% of homozygous sickle cell disease (HbSS) patients and up to 33% of heterozygous sickle cell disease (HbSC) patients.14 In central RVO cases, visual acuity at diagnosis is poor (<20/40) and it decreases further over time, which consequently strongly alters the quality of life.15 16 These vascular diseases can affect the posterior pole (macular oedema and/or macular ischaemia) but also the retinal periphery with ischaemic and neovascular manifestations, which can further worsen the visual prognosis in affected patients.
Technological advances in retinal imaging allow an unprecedented visualisation of the retinal periphery of approximately 200° using an ultra-widefield (UWF) imaging system without the need for pupillary dilatation. The Optos system (Optos, California, USA) has been widely used for both diagnosis and monitoring of retinal vascular diseases, with multiple studies showing improved detection, classification, and determination of areas of non-perfusion in DR,17 SCR,18–20 and RVO.21–23
Recently, deep learning (DL) models aiming to classify and segment retinal lesions have demonstrated excellent accuracies, sometimes surpassing human experts, for multiple pathologies and using different imaging techniques for various retinal diseases.24 25 Furthermore, DL has shown interesting results when associated with UWF imaging especially in retinal vascular diseases.
While several DL models have shown high accuracy in detecting proliferative DR26 and branch/central RVOs on UWF colour fundus photography (CFP),27 28 no study has yet aimed at distinguishing multiple retinal vascular diseases, including DR, RVO and SCR. This study will assess the ability of a DL algorithm to distinguish between DR, SCR, RVO and healthy eyes using UWF-CFP.
Methods
Datasets
Patients with retinal vascular disease (DR, RVO and SCR) presenting to the department of ophthalmology at the Creteil University Hospital between January 2018 and January 2021, and having undergone UWF-CFP were retrospectively included in this study. A group of healthy controls having undergone UWF-CFP was randomly selected. This study was conducted in accordance with the tenets of the Declaration of Helsinki. Written consent was waived because of the retrospective nature of the study. Patients or the public were not involved in the design, or conduct, or reporting, or dissemination plans of our research.
High-resolution (2133×1048 pixels), 200° field-of-view images were captured on the Optos California imaging system. All UWF-CFP images were deidentified then cropped to a size of 700×500 pixels with the macula at the centre and were labelled as either DR, RVO, SCR, or healthy by a retina specialist and a retina fellow (AM, EA). Online supplemental figure 1 illustrates the UWF-CFP for each of the four classes used in this study.
Supplemental material
A four-class classification system (DR, RVO, SCR, healthy control) was implemented with a dataset of 224 images uniformly distributed among the classes: 65 DR (29.0%), 47 RVO (21.0%), 57 SCR (25.4%), and 55 healthy controls (24.6%).
Development of a DL classifier
For this study, the DL framework TensorFlow (Google, Mountain View, USA) was used. We used the DenseNet12129 30 convolutional neural network (CNN) to perform the classification task.
Transfer learning from the ImageNet dataset (http://www.image-net.org/) was used to provide base knowledge to the CNN before fine-tuning it. To fit our task, we reduced the number of output neurons in the last fully connected layer to 4.
Data augmentation was used to increase the original dataset and to reduce the overfitting of the final model. This was achieved through a combination of image translation, cropping and rotation. Moreover, Gaussian noise augmentation was used to mimic low-quality noisy images. Gaussian noise, also called white noise, has a mean of 0 and an SD of 1. The addition of Gaussian noise to the inputs of our CNN during training was meant to increase the robustness of our model, as due to the added noise the CNN was ultimately less able to memorise training samples. The images were normalised using the mean and SD of the ImageNet dataset to match the model initialisation. An integral fine-tuning was performed, meaning that all trainable weights were optimised using Adam Optimization Algorithm31 with a learning rate of 0.001 and a batch size of 24. An early stopping procedure has been applied to minimise overfitting. It consists in stopping training when there is no improvement after a certain number of epochs (30 in our case). For the same purpose, learning rate reduction was used as well, meaning that the learning rate was decreased by a factor of 10 when no improvement was observed for 10 epochs. Performances were evaluated using fivefold cross-validation. Therefore, the entire dataset was divided into five groups (20%). At each step, one group was selected as the test set, while the rest of the dataset, named train-val test (the 80% of observations not in the test set), was also randomly divided into two subsets called training set (90% of the train-val set) and validation set (10% of the train-val set). The DL model learnt on the training set and optimised its hyperparameters on the validation set. Then performances were assessed on the unused test set. This procedure of training–validation–testing was repeated five times since we used a fivefold cross-validation. Therefore, it allowed to test every image from the whole dataset once in an unbiased manner. This repeated training–validation–testing is a common machine learning procedure that maximises performances while minimising bias.32 Furthermore, data augmentation was separately done on both training and validation, but not on the final test set.
Smoothed saliency map33 was used to better capture model attention. GradCAM++34 was also applied to the last convolutional layer before the output. We preferred to use both methods as they each have their advantages and downsides. While the saliency map techniques offer a more global insight about the image’s important areas in the prediction (yet can suffer from noise generated by first layers, which might or might not have a significant impact on the final decision), GradCAM++ is less global since it focuses only on the last convolutional layer, as this latter is considered to be crucial in the decision, especially in dense networks, where it has access to information from past blocks. By using saliency maps, attribution maps were generated, allowing to assess the impact of each region in the classification and showing on which areas the model relies on to perform the classification.
The performance was evaluated through a comparison of the CNN output with the ground truth, set by clinical diagnosis by expert readers (AM, EA). Cases of disagreement were adjudicated by a third reader (EHS). The metrics used for this purpose were accuracy, sensitivity, specificity, precision and F1 score. Confusion matrices, area under receiver operating characteristics curve (AUC-ROC) and precision-recall curves were generated.
Results
The data used to train and test the algorithm were composed of 55 UWF images from healthy patients, and 169 images from participants with retinal vascular diseases distributed as follows: 65 UWF images of DR including 48 non-proliferative DRs (24 mild, 17 moderate, 7 severe) and 17 proliferative DRs, 47 UWF images of RVO including 28 central RVOs and 19 branch RVOs, 57 UWF images of SCR, including 47 non-proliferative SCRs and 10 proliferative SCRs. The degree of agreement between the two expert readers to classify the images was 96.87%. Of these, 179 UWF images were used for training and validation and the remaining 45 UWF images were used for testing.
The overall accuracy for the classification was 88.4%. These results are summarised in tables 1 and 2 and figure 1. Figures 2 and 3 illustrate saliency maps and GradCAM++ visualisation for correct and incorrect attributions, respectively.
Confusion matrix of the deep learning classifier based on a total of 224 ultra-widefield colour fundus photographs of retinal vascular diseases in the dataset
Performance metrics of the deep learning classifier for retinal vascular diseases on ultra-widefield colour fundus photographs

(A) Receiver operating characteristics (ROC) and (B) precision-recall (PRC) area under the curve (AUC) for the four classes: diabetic retinopathy (DR), retinal vein occlusion RVO), sickle cell retinopathy (SCR) and healthy controls. For DR, the AUC-ROC was 0.905. The AUC-PR (B) was 0.831. For RVO, the AUC-ROC (A) was 0.912. The AUC-PR (B) was 0.772. For SCR, the AUC-ROC (A) was 0.968. The AUC-PR (B) was 0.912. For healthy controls, the AUC-ROC (A) was 0.885. The AUC-PR (B) was 0.778. Note that both AUC-ROC and AUC-PR confirm that SCR is the best-predicted class, followed by the RVO class.

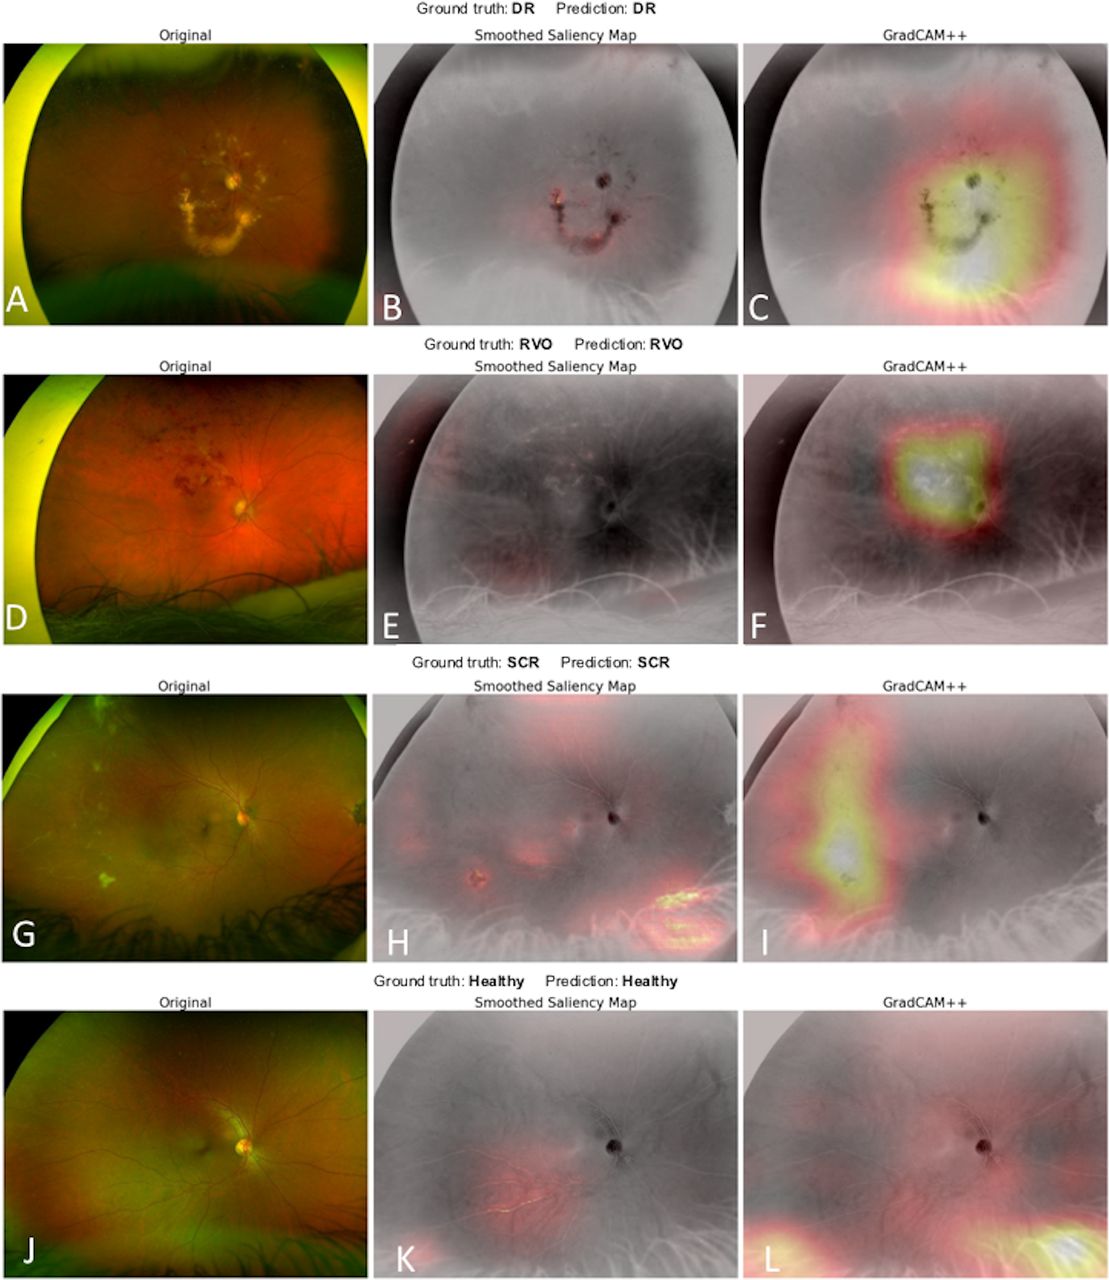
Examples of correct predictions with corresponding saliency maps (centre column) and GradCAM++ (right column) visualisation for each class. For diabetic retinopathy (DR) attribution (A–C), the model focused on the haemorrhagic areas and hard exudates. For the retinal vein occlusion (RVO) (D–F), the model detects well the diffuse haemorrhages. For the images of sickle cell retinopathy (SCR) (G–I), heatmaps of correct attribution show that the model detects peripheral lesions, but also takes into account the healthy area of the posterior pole. (J–L) A case of healthy control and corresponding heatmaps.
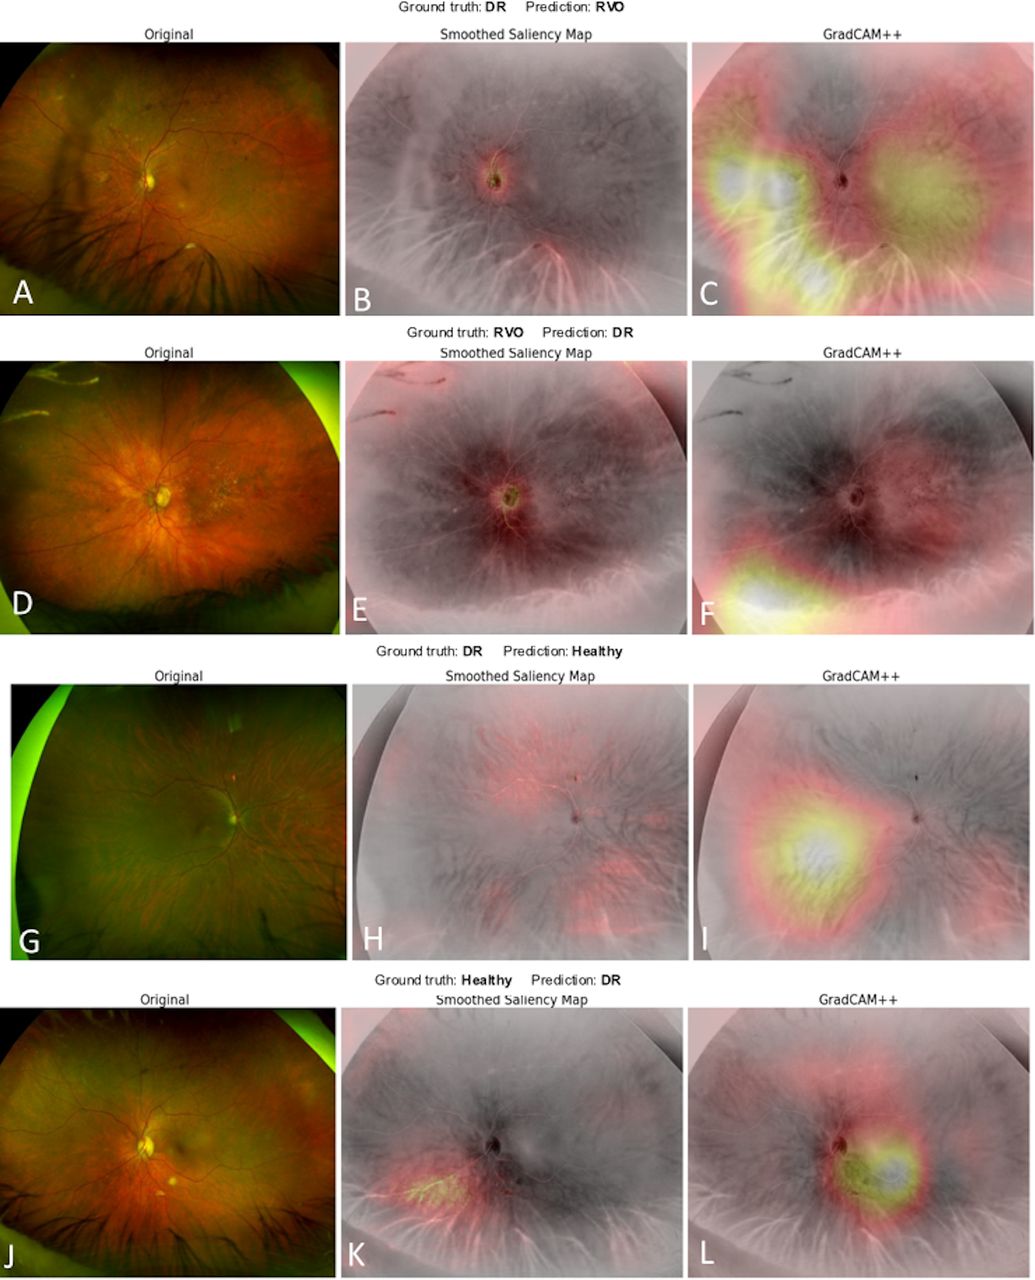
Examples of incorrect predictions with corresponding saliency maps (centre column) and GradCAM++ (right column) visualisation for each class. The heatmaps show examples of erroneous classifications and false positives. (A–C) The model assigns an image of diabetic retinopathy (DR) to the retinal vein occlusion (RVO) category. (D–F) The model erroneously assigned an image of RVO to the DR category. (G–I) The model mistakenly classified an image of DR to the healthy category. (J–L) The model classified an image from a healthy control as DR.
A total of 21 of 65 DR images were mistakenly assigned to the non-DR category, 13 in the RVO category, 6 in the healthy control category and 2 in the SCR category. In the same way, 12 non-DR images were erroneously assigned to the DR category, including 10 from the healthy control category and 2 from the RVO category.
A total of 10 of 47 images from the RVO category were misclassified (4 in the healthy control, 4 in the SCR and 2 in the DR one). In contrast, 16 non-RVO images were classified as an RVO (13 DR and 3 healthy controls).
A total of 3 of 57 SCR images were classified erroneously into the healthy control category by the DL model.
In contrast, a total of 11 non-SCRs were assigned to the SCR category including 5 images of healthy patients, 2 images of DR and 4 images of RVO.
In the healthy control class, 18 of 55 images were mistakenly classified (5 images classified as SCR, 10 as DR and 3 as RVO). Thirteen images of retinal vascular diseases were erroneously assigned to the healthy controls (three SCR, six DR, four RVO).
To assess model uncertainty, Kernel density estimation graphs were used, showing the highest estimated probability for each of the four classes (online supplemental figures 2 and 3).
Supplemental material
Supplemental material
Discussion
In this study, we showed the feasibility of an automated DL classification for the detection of several retinal vascular diseases using UWF-CFP, with an overall accuracy of 88.4%. The cross-validation technique used in our study allowed taking into account the whole dataset since we were able to make a prediction for every image within the dataset and minimising bias. In our study, SCR was the best-identified category on UWF-CFP with an accuracy of 93.8%, and RVO is the second-best detected class, with an accuracy of 88.4%. The reliability of our model was confirmed by the high AUC-ROC obtained. Consequently, the SCR category had the highest AUC-ROC with 96.7% followed by the RVO class with 91.2%. Other classes had an AUC-ROC of about 90%. Moreover, our model obtained a specificity of more than 90% for all four classes and high sensitivity for the SCR class (94.7%). Thus, this DL four-class model presents an important interest and a high accuracy in the detection of different retinal vascular diseases.
Several DL models have already shown high accuracy in detecting proliferative DR,26 RVO27 28 or SCR35 on UWF-CFP. However, none of the previous studies focused on classifying different retinal vascular diseases (ie, DR, RVO and SCR), with potentially similar features, using UWF-CFP. In detail, Nagasawa et al26 used 378 UWF-CFP images acquired with the Optos system to train and test their DL model to detect only proliferative DR from normal eyes. The authors obtained a sensitivity of 94.7%, a specificity of 97.2% and an AUC-ROC of 97% in distinguishing proliferative DR from healthy controls by using VGG-16 and Grad-CAM as a visualisation method.26 Nagasato et al28 used a dataset of 125 central RVOs and 238 healthy controls to train and test both a DL model and support vector machine (SVM) model. The authors obtained a higher sensitivity and specificity for the DL model (sensitivity: 98.4%, specificity: 97.9%, AUC-ROC of 98%) than for the SVM model (sensitivity: 84%, specificity: 87.5%, AUC-ROC of 89.5%) for this binary classification.28 Cai et al gathered 1182 UWF-CFP images from 190 patients with SCR to build their DL model (Inception V4 architecture), aiming to automatically detect sea fan neovascularisation. The authors used two visualisation methods, both Grad-CAM and SmoothGrad. The model obtained a sensitivity of 97.4%, a specificity of 97% and an AUC-ROC of 98.8% for detecting sea fan neovascularisation.35 Nevertheless, these studies used binary classifications (healthy vs retinal disease), while our model used a four-class classification system. Despite the high accuracy obtained by our model, a high sensitivity was obtained for SCR (94.7%) and RVO (78.7%). Conversely, the sensitivities for DR and healthy controls were not high enough for an efficient screening tool. Interestingly, as DR and RVO generate somewhat similar vascular changes at the posterior pole (ie, haemorrhages) and in the periphery (ie, non-perfusion), 13 DR images were erroneously classified as RVO.
Consistent with recent literature, we used two visualisation methods (saliency maps and GradCAM++) for the model’s output, which allowed us to evaluate the areas the model relied on when making a prediction. Indeed, our model relied on the haemorrhagic areas and the hard exudates to predict the class for UWF-CFP DR images (figure 2). In the case of RVO, the model detected well the diffuse haemorrhages in RVOs (figure 2). Concerning SCR, the model took into account the foveal reflex and nerve fibre layer to predict SCR (figure 2). Due to the foveal reflex that is more apparent in the younger population of patients with SCR (as opposed to the older patients with DR or RVO), eyes with SCR were more readily identified by the DL classifier. In other SCR cases, however, predictions seem to rely as well in this particular category on vascular peripheral signs such as sea fans or peripheral non-perfusion, as seen in figure 2.
This DL algorithm can be an impactful tool in areas with a lack of ophthalmological care. Maa et al36 reported that telemedicine in ophthalmology could reduce cost and improve access to care. In areas with a shortage of ophthalmological care, the availability of a non-invasive, fast, non-mydriatic UWF-CFP system allows performing an accurate diagnosis of the most prevalent retinal vascular diseases for referral to a specialist for confirmation and management. Moreover, sickle cell disease is an inherited disorder. Most of the cases are concentrated in referral centres for patients in Europe and the USA. As ophthalmology clinics are not always available in all of these referral centres, an automated artificial intelligence (AI) detection could be of great interest for the diagnosis of retinal involvement.
Our study has several limitations. First, our dataset was rather small, given that 224 images were available for model construction and testing across four classes. In comparison, Nagasawa et al26 or Nagasato et al28 used comparable datasets for binary classifications. Second, another limitation of our study may be the use of the Optos pseudocolour UWF-CFP. Using the Optos system, pseudocolour images are obtained using red and green scanning lasers, and different magnification between the central and peripheral retina.37 This may artefactually enhance certain features while diminishing others. In our dataset, the pseudocolour UWF images of the retina were not individually balanced for the green and red laser images by a grader before export. Moreover, UWF-CFP images can have some artefacts limiting the discriminating power for models, such as eye contour elements like eyelid or eyelash. Third, no objective quality assessment metrics have been used. Last but not least, the lack of an external test dataset counts among the limitations of this study.
The analysis of the prediction distribution showed that there was a difference in the model’s confidence when making a correct or incorrect prediction (online supplemental figure 2). Nevertheless, this difference in confidence might not be enough to clearly identify a correct prediction without prior knowledge of the ground truth. This is a widely known problem of neural networks (also called calibration problem), and may be due, in our study, to the fact that some of our classes share visual information (such as for RVO and DR images).
In conclusion, UWF-CFP combined with DL may be a useful way to detect and screen for retinal vascular diseases. This technology may be a useful tool for telemedicine and in remote areas with limited access to ophthalmic care.
Data availability statement
Data are available upon reasonable request. Data are available upon reasonable request from the corresponding author.
Ethics statements
Patient consent for publication
Ethics approval
This study involves human participants but the study was exempted due to the fact that it involved the analysis of de-identified existing data (UWF-CFP). Written consent was waived because of the retrospective nature of the study.
References
Supplementary material
Supplementary Data
This web only file has been produced by the BMJ Publishing Group from an electronic file supplied by the author(s) and has not been edited for content.
Footnotes
Contributors AM conceptualised the study and is the guarantor. EA, C-JM and FA performed and monitored data collection. EA drafted the original manuscript. AM and EHS critically revised the paper. J-BE, SK and MO analysed the data.
Funding The authors have not declared a specific grant for this research from any funding agency in the public, commercial or not-for-profit sectors.
Competing interests AM reports personal fees from Novartis (Basel, Switzerland) and personal fees from Bayer Shering-Pharma (Berlin, Germany), outside the submitted work. EHS reports personal fees from Novartis (Basel, Switzerland) and personal fees from Bayer Shering-Pharma (Berlin, Germany), outside the submitted work.
Provenance and peer review Not commissioned; externally peer reviewed.
Supplemental material This content has been supplied by the author(s). It has not been vetted by BMJ Publishing Group Limited (BMJ) and may not have been peer-reviewed. Any opinions or recommendations discussed are solely those of the author(s) and are not endorsed by BMJ. BMJ disclaims all liability and responsibility arising from any reliance placed on the content. Where the content includes any translated material, BMJ does not warrant the accuracy and reliability of the translations (including but not limited to local regulations, clinical guidelines, terminology, drug names and drug dosages), and is not responsible for any error and/or omissions arising from translation and adaptation or otherwise.