Article Text

Abstract
Objectives Safety culture questionnaires are widely used in healthcare to understand how staff feel at work, their attitudes and views, and the influence this has on safe and high-quality patient care. A known challenge of safety culture questionnaires is achieving high response rates to enhance reliability and validity. This review examines predictors of response rates, explores reasons provided for low response rates and identifies strategies to improve those rates.
Methods Four bibliometric databases were searched for studies assessing safety culture in hospitals from January 2008 to May 2022. Data were extracted from 893 studies that included a safety culture questionnaire conducted in the hospital setting. Regression was used to predict response rate based on recruitment and data collection methods (incentives, reminders, method of survey administration) and country income classification. Reasons for low response were thematically analysed and used to identify strategies to improve response rates.
Results Of the 893 studies that used a questionnaire to assess safety culture in hospitals, 75.6% reported a response rate. Response rates varied from 4.2% to 100%, with a mean response rate of 66.5% (SD=21.0). Regression analyses showed that safety culture questionnaires conducted in low-income and middle-income countries were significantly more likely to yield a higher response rate compared with high-income countries. Mode of administration, questionnaire length and timing of administration were identified as key factors. Remote methods of questionnaire data collection (electronic and by post) were significantly less likely to result in a higher response rate. Reasons provided for low response included: survey fatigue, time constraints, and lack of resources.
Conclusion This review presents strategies for researchers and hospital staff to implement when conducting safety culture questionnaires: principally, distribute questionnaires in-person, during meetings or team training sessions; use a local champion; and consider the appropriate time of distribution to manage survey fatigue.
- quality in health care
- health policy
- health & safety
Data availability statement
All data relevant to the study are included in the article or uploaded as online supplemental information.
This is an open access article distributed in accordance with the Creative Commons Attribution Non Commercial (CC BY-NC 4.0) license, which permits others to distribute, remix, adapt, build upon this work non-commercially, and license their derivative works on different terms, provided the original work is properly cited, appropriate credit is given, any changes made indicated, and the use is non-commercial. See: http://creativecommons.org/licenses/by-nc/4.0/.
Statistics from Altmetric.com
STRENGTHS AND LIMITATIONS OF THIS STUDY
Synthesised response rates of safety culture questionnaires.
Provides key strategies to enhance participation when conducting safety culture questionnaires.
Successful predictors of high response were devised using statistical and thematic analysis.
Included only published, peer-reviewed and English language empirical studies; potential that response rates are lower in non-published studies.
Introduction
Safety culture is increasingly recognised as a basis for the delivery of safe and high-quality care.1 The importance of having a positive safety culture in healthcare is widely accepted in the literature and represented in accreditation and regulatory standards.2 A commonly used definition of safety culture is:3 ‘The product of individual and group values, attitudes, perceptions, competencies and patterns of behaviour that determine the commitment to, and the style and proficiency of, an organisation’s health and safety management’.4 (p. 339)
Past reviews have shown that questionnaires are widely employed for safety culture assessment across low-income, middle-income and high-income countries.4 5 Reasons for the popularity of questionnaires to assess safety culture include: practicality, time-efficiency and efficacy in gathering large amounts of data in a reliable and reproducible manner.3 6 7 However, a challenge in administering questionnaires is obtaining a representative sample of the population for valid and reliable findings. In their widely cited recommendation on patient safety assessment, Pronovost and Sexton8 suggest that a response rate >60% is warranted to capture culture rather than opinion. The extent to which such a response rate is readily achievable in practice is unclear. No review, to date, has synthesised response rates of safety culture questionnaires to determine if the multitude of studies using safety culture questionnaires are reaching this standard.
Questionnaires conducted in healthcare are reportedly seeing a decline in response rates.9–11 Low response rates are problematic given that non-response reduces the effectiveness of sample size and can result in bias; for example, non-responders may be systematically different from responders.12 Reasons for non-response typically include lack of time and survey burden,13 particularly the case among health professionals who face continuous time pressures in their day-to-day work.14 Certain factors have been found to positively influence questionnaire responses, including: the method of questionnaire delivery (postal questionnaires are more effective in yielding higher response rates than online or web-based questionnaires);15 and the use of incentives (small financial incentives are more effective than token nonmonetary incentives).16 Other strategies include: contacting participants before sending questionnaires, follow-up reminders, using personalised questionnaires and letters, providing a stamped returned enveloped and questionnaires that are of shorter duration.17 The topic of the questionnaire also has important influence on responses, with topics of high interest to respondents yielding higher response rates.9 17 While we know that safety culture is a topic of interest to researchers (as evidenced by the myriad of studies already conducted on this topic), little is known about the interest in the eyes of the respondent (ie, staff working in a hospital). While past research has investigated the influences of high response rates in healthcare research,9 17 18 we have a paucity of knowledge about the response rates of safety culture questionnaires and specific strategies that can be effectively implemented. The aim of this study was to examine predictors of response rates for safety culture questionnaires in hospitals, analyse reasons provided for low response rates and identify strategies to improve those rates.
Methods
Search strategy
We systematically reviewed the literature following the Preferred Reporting Items for Systematic Reviews and Meta-Analyses (PRISMA) guidelines (see online supplemental appendix 1 for PRISMA checklist).19 Four academic databases (PubMed, CINAHL, Scopus and Web of Science) were searched from January 2008 to May 2022. The search string was based on previous work in the field of safety culture:4 (‘acute care’ OR ‘hospital’) AND (‘quality culture’ OR ‘safety culture’ OR ‘culture of safety’ OR ‘safety climate’ OR ‘safety attitude’) AND (‘survey’ OR ‘questionnaire’ OR ‘tool’ OR ‘instrument’ OR measur* OR assess* OR checklist OR ‘check list’ OR observ*) AND (‘patient safety’ OR ‘public safety’ OR ‘workplace safety’). Studies were included that: (1) assessed, studied or measured safety culture or climate using a quantitative questionnaire; (2) conducted in hospital(s) and (3) published in English. Conference abstracts, reviews and papers with no abstract or where full text was not available, and papers that used secondary data were excluded. This systematic review was not registered with a central database.
Supplemental material
Citation screening
Reference details (including abstracts) were exported to Rayyan QCRI and divided among the research team for title and abstract screening. Five authors (CP, LAE, KC, IM and AC) independently reviewed 5% of the titles and abstracts, with any discrepancies discussed until reaching a consensus.
Full-text screening was conducted by two independent reviewers (CP and MS), with all extracted data being checked by another reviewer (LAE).
Data extraction
We developed a data extraction sheet using Microsoft Excel that was pilot tested on five randomly selected included articles and refined accordingly. Data extraction included information on: journal; country where the study was conducted; questionnaire(s) used; length of questionnaire; context (hospital type, number of hospitals included in the study); methods of data collection; participants and details related to the conduct of the questionnaire including incentives; reminders; response rate reported and documented reasons for low response.
Data analysis
Response rate was calculated as the proportion of all eligible respondents who completed the questionnaire. When multiple response rates were reported in a study (eg, longitudinal research or response rates reported for separate locations) a mean score was calculated. Reasons for low response were analysed thematically. Specifically, inductive coding was used to identify recurring reasons and strategies across the included studies. Country where the study was conducted was coded by income classification based on World Bank definitions of gross national income per capita. The three categories were low income (<US$1045), middle income (US$1046–US$12 695) and high income (>US$12 696).20 Predictors of response rate were analysed using a hierarchical linear regression with response rate as the dependent variable. In step 1, the effect of country income classification on response rate was tested. Strategies to enhance response (incentives, reminders) and methods of data collection were added in step 2. All analyses were conducted in SPSS, V.27.21
Patient and public involvement
No patients involved.
Results
Study characteristics
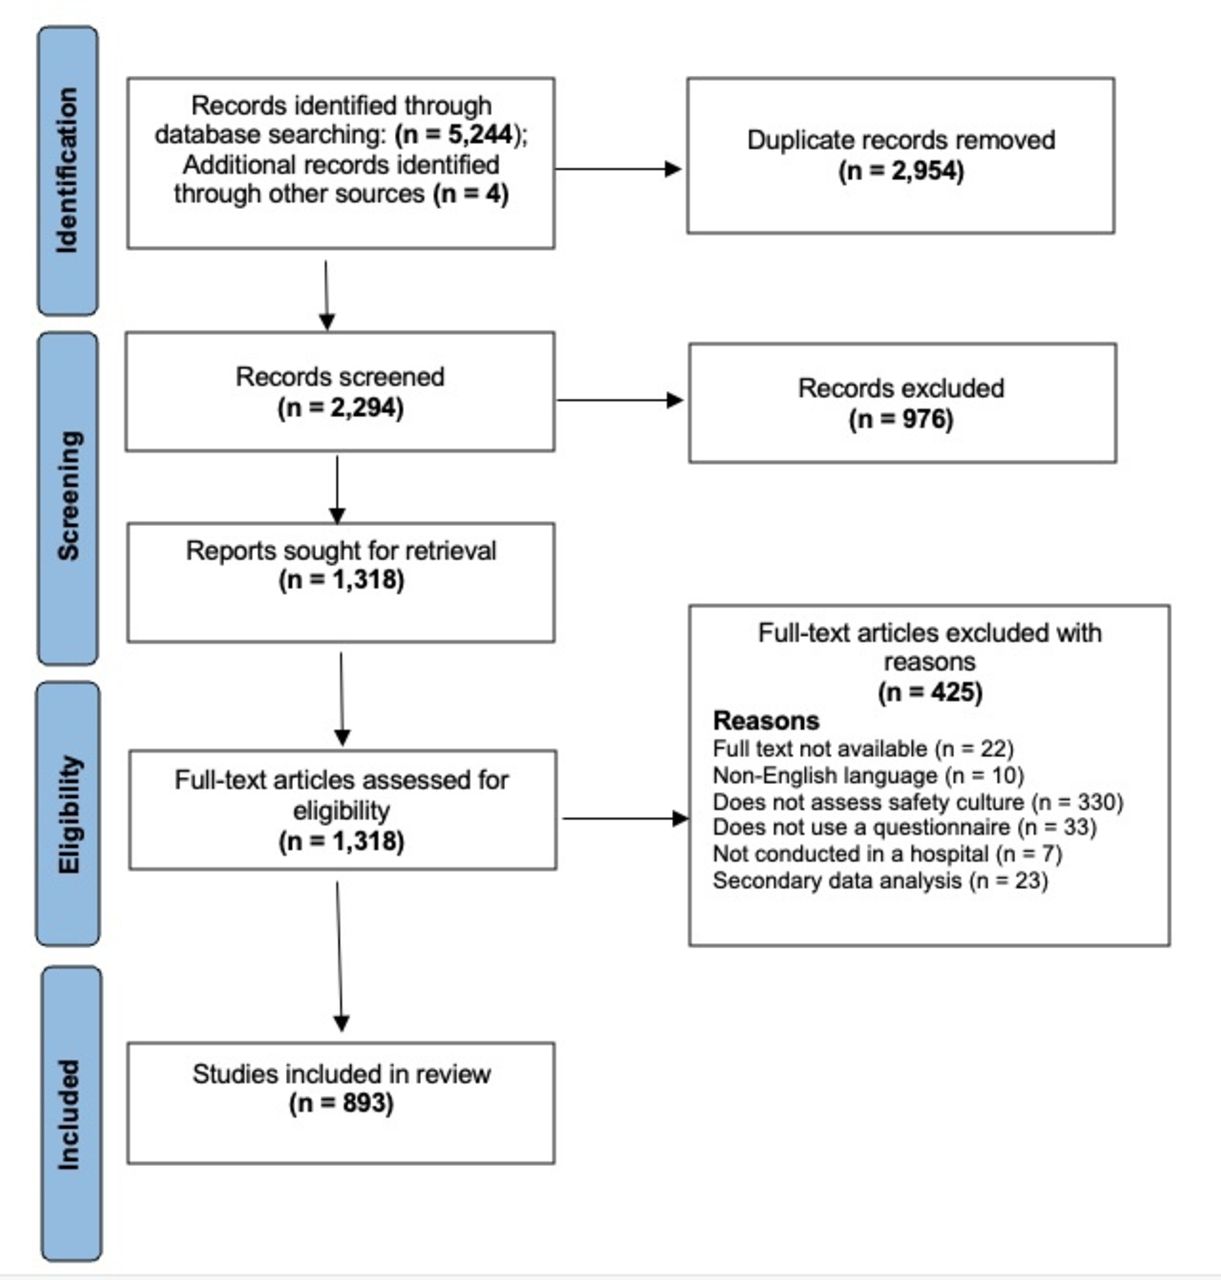
Figure 1 provides the PRISMA flow diagram. The search identified a total of 5244 records, with an additional four identified from other sources. After removing duplicates, 2294 remained for title/abstract screen. During the stage, 976 records were discarded as not meeting the inclusion criteria. Based on the full-text assessment, a further 425 records were excluded with reasons recorded, leaving 893 studies included in the review. See online supplemental appendix 2 for details of all included studies.
Supplemental material
PRISMA flow chart of the review. PRISMA, Preferred Reporting Items for Systematic Reviews and Meta-Analyses.
The most common method of data collection was hard copy, used in over two-thirds of the included studies (n=597, 66.9%). Other questionnaire data collection methods were electronic (ie, web based, via email; n=205, 23.0%), postal (n=61, 6.8%), face-to-face administration (n=35, 3.9%) and administration over the phone (n=4, 0.4%). One hundred and thirty-four studies (15.1%) did not disclose how the questionnaire data was collected. Most studies were conducted in high-income countries (n=583, 65.3%), followed by middle-income (n=301, 33.7%), and only nine in low-income countries (1.0%). Eleven studies were conducted in more than one country. Most studies were conducted in the USA (n=205, 23.0%), followed by Brazil (n=90, 10.1%), Iran (n=49, 5.5%) and China (n=43, 4.8%).
Response rates and contributing factors
Of the 893 included studies, 75.6% (n=675) reported a response rate. The range of response rates varied from 4.2% to 100%, with the average reported response rate being 66.5% (SD=21.0). Only 21 studies (9.6%) provided reasons for not reporting response rates, such as an inability to determine how many employees were sent emails.22 23 Eleven studies reported a response rate of 100%. Explanations for yielding an absolute response rate were that data collection took place during a required training course,24 25 or that the questionnaire was using a targeted sample.26 27 For instance, a study included all urology trainees based in the West of Scotland; there were only 28 and all participated.28 Another study, with a targeted sample from a hospital setting in Algeria, reported using several strategies to achieve a 100% response rate, including giving targeted staff members advance notice about the upcoming survey, sending a reminder letter about the value of their involvement and providing participants feedback on the results afterwards.27
Reminders were reported in 130 (14.6%) studies in this review. The number of reminders sent to participants varied from one29 to three,30 to as many as necessary until all participants responded.27 The interval of reminders also varied, some sent reminders every 2 days,31 while others sent fortnightly reminders.32 In addition to reminding participants, authors also used multiple mailings33 and chose to increase the response time allocated for participation with the aim to increase the response rate.34 Only 40 (4.5%) included studies reported the use of incentives for participation, such as the distribution of ballots for gift certificates,35 raffles for various prizes33 or compensation checks after questionnaire completion.36 Staff time constraints was a common reason provided for low response.36 37 Poor timing was particularly identified as an issue during the COVID-19 pandemic, with increased hospital staff workloads and additional ethical constraints in data collection at this time.38–40
Other reasons suggested for low response rates were lack of incentives, questionnaire length, timing of distribution and survey fatigue. Table 1 provides a summary of the reasons used to explain low response rates.
Reasons for low response
Predictors of high response rates
A hierarchical linear regression was conducted to examine if method of data collection, strategies to enhance response (incentives, reminders) and country income classification significantly influenced the response rate of safety culture questionnaires. We combined low-income and middle-income countries (LMICs) given the low number in comparison to studies that were conducted in high-income counties. The regression analyses (table 2) revealed that in step 1, country income classification contributed significantly to the regression model, F (1,674) = 102.85, p<0.001, accounting for 13.3% of the variation in response rate. Introducing the strategies to enhance response rate and method of data collection variables in step 2 explained an additional 7.7% of variation and the change in R² was significant, F (8,674) = 22.18, p<0.001. With all variables added in the model, country income classification, electronic questionnaire and postal questionnaire were significant negative predictors of response rate.
Hierarchical regression for predictors of safety culture questionnaire response rate
Discussion
A known challenge of safety culture questionnaires is securing high response rates to increase reliability and validity and decrease bias. In this review, we found the average response rate of hospital safety culture questionnaires to be 66.5%, higher than the recommended response rate specific to safety culture measurement (60%).8 One-quarter of included articles did not report a response rate.
The most common method of safety culture questionnaire data collection was hard copy questionnaires, which had the second-highest average response rate (68.3%) across the five methods of questionnaire data collection. Face-to-face spoken administration was the method with the highest average response rate (71.7%), although was rarely used (3.9%). Regression analyses revealed that using electronic and postal methods of data collection resulted in significantly lower response rates. Both these methods can be considered remote measures of recruitment, whereby researchers are not engaging with potential participants in-person. While electronic questionnaires (ie, online, web-based questionnaires) are easy to distribute, low cost and require less effort by the research team, there are several other reasons why they may influence low response rates. Email links can be troublesome, particularly for participants working in hospitals who may have firewalls blocking external emails.13 Further, many hospital staff do not have access to their email during work hours or time to complete questionnaires while caring for patients (eg, front-line workers),15 leaving participation to lunch time, breaks or out-of-work hours; however, some employees may not have access to their email inbox from outside their place of work.
Timing was another common factor used to explain low response rates in safety culture questionnaires. For example, one study that captured data at two points, and had different response rates (34.5% baseline, 27.6% follow-up), attributed the discrepancy in response rates to the month of the second questionnaire being ‘a time when many residents have physically and mentally left the programme’.41 (p. 62) In general, hospital staff are busy and thus difficult to recruit for participation in research.42 This was particularly highlighted as an issue during COVID-19, a time when hospital staff faced additional workload pressures.38–40 Another prominent factor in hospitals wis survey fatigue,42 43 as a result of numerous questionnaires being run around the same time.44 Questionnaire length was another contributing factor to low response.44 45 For example, Etchegaray and Thomas45 used the HSOPS and two scales from the SAQ (total 55 items) and noted that the length of combining both the questionnaires may have limited response.
Our findings also revealed that high-income countries had a significantly lower response rate for safety culture questionnaires than LMICs. This is a somewhat promising finding, suggesting that hospital workers in resource-limited settings are willing to participate in safety culture research and provide feedback that can be used to monitor and drive improvements for the safety and quality of healthcare in LMICs. Patient safety continues to be a serious concern in these countries with programmes to promote safety culture remaining rare.46 However, another reason high-income countries have a significantly lower response rate than LMICs may be because of survey fatigue or habituation specific to safety culture questionnaires that are frequently and often routinely distributed. There is a real danger that healthcare workers are being overwhelmed by questionnaire requests more generally, with the issue likely to have been exacerbated even further during the COVID-19 pandemic. For example, a recent study of junior doctors in the UK reported a median of 12 invitations to take part in questionnaire research within only a 6-month period during the pandemic.47 The issue of survey fatigue for healthcare workers and its consequences on response rates is an area for further investigation and consideration.
Consistent with previous healthcare research on survey response rates, we did not identify significantly higher response rates from studies offering incentives,13 despite often being used as an explanation for low response. We also did not identify reminders as yielding significantly higher response rates, though we did not examine nuances of timing and frequency of reminders which could potentially have an effect.
Implications
This review provides several strategies for researchers and staff to implement when distributing safety culture questionnaires in hospitals (box 1). A key strategy to enhance likelihood of response is to distribute the questionnaire in person, during staff meetings or training sessions. While on the one hand this may introduce a degree of coercion as respondents could feel obligated to participate, on the other hand, there is also potential bias in not yielding a high response rate. Second, the use of a local champion can help with recruitment. This may consist of conducting weekly walkabouts in the areas where the questionnaire is being conducted,48 or having a hospital contact person or department manager motivating non-responders to participate.49 It is important that if there are different project managers across different sites of data collection (ie, different units or departments, or different hospitals) that processes are consistent to avoid biases or over-representation of some sites.
Strategies to improve response rates
Distribute surveys during staff training or meetings.
Ensure anonymity.
Extend the duration of data collection.
Encourage in-person administration.
Nominate local champions.
The survey can be completed within 10 minutes.
Increase novelty of survey questions.
Employ targeted sampling.
Provide staff feedback and summary results.
Strengths and limitations
This is the first study to synthesise data on the administration of safety culture questionnaires in hospitals and examine the predictors of response rates. This paper presents key strategies when conducting safety culture questionnaire in hospitals to enhance participation. A limitation of this study is that the analysis is dependent on what was reported in articles. For example, if researchers used reminders but did not disclose their use in the methods, this information was not captured in our analysis. Further, only incentives, reminders and data collection methods were statistically tested as predictors of response rates. Several other strategies identified in this study (eg, local champions, distribution during meetings or training) were identified using inductive thematic analysis. The review does not include response rates of safety culture questionnaires published in grey literature. It may be the case that response rates in peer-reviewed studies are different from in non-published studies.
Conclusion
Despite high-response rates being a persistent challenge for health services researchers, this study revealed that the average response rate for safety culture questionnaires in hospitals is over 60%, although there is wide variation. Researchers and managers should endeavour to use local champions and distribute questionnaires in hard copy during meetings or training sessions wherever possible. Safety culture response rates were significantly higher in LMICs. This is a promising finding for continued efforts to improve the safety and quality of care delivery in under-resourced countries, though at the same time suggests there may be issues of survey fatigue and habituation in high-income countries. Our results highlight the need for a more in-depth analysis of the timing and frequency of survey distribution and reminders, incentive types and the use of champions/mentors for safety culture surveys. A more in-depth analysis of questionnaire burden and its possible impact on response rates is also warranted. Healthcare workers in high-income countries may benefit from having fewer questionnaires, for example, with more localised assessment of safety culture within specific departments via focus groups or other qualitative methods.5
Data availability statement
All data relevant to the study are included in the article or uploaded as online supplemental information.
Ethics statements
Patient consent for publication
Ethics approval
Ethics approval was not required for this systematic review as no human participants were involved.
References
Supplementary materials
Supplementary Data
This web only file has been produced by the BMJ Publishing Group from an electronic file supplied by the author(s) and has not been edited for content.
Footnotes
LAE and CP are joint first authors.
Twitter @annjcar
Contributors CP and LAE contributed equally to this review. LAE, CP and JB had the original idea for the study. CP and LAE led the data search and data extraction, with assistance from KC, AC, IM and MS. CP and LAE led the analysis and the writing of the manuscript. All authors provided critical feedback and helped shape the final paper. LAE accepts full responsibility for the finished paper.
Funding This project was supported by multiple grants, including the National Health and Medical Research Council (NHMRC) Partnership Grant for Health Systems Sustainability (ID: 9100002).
Competing interests None declared.
Patient and public involvement Patients and/or the public were not involved in the design, or conduct, or reporting, or dissemination plans of this research.
Provenance and peer review Not commissioned; externally peer reviewed.
Supplemental material This content has been supplied by the author(s). It has not been vetted by BMJ Publishing Group Limited (BMJ) and may not have been peer-reviewed. Any opinions or recommendations discussed are solely those of the author(s) and are not endorsed by BMJ. BMJ disclaims all liability and responsibility arising from any reliance placed on the content. Where the content includes any translated material, BMJ does not warrant the accuracy and reliability of the translations (including but not limited to local regulations, clinical guidelines, terminology, drug names and drug dosages), and is not responsible for any error and/or omissions arising from translation and adaptation or otherwise.