Article Text

Abstract
Aim To estimate the prevalence of micronutrient deficiencies and anaemia, and their association with body mass index (BMI) categories among Australian adults.
Method We analysed data from the 2011–2013 Australian Health Survey from 3539 participants aged 18 years and over (without known pregnancy) with measured weight and height, and nutrient biomarkers. To address complex sampling, survey weights were used when estimating the prevalence of micronutrient deficiencies (vitamin B12 deficiency; serum vitamin B12<145 pmol/L; iron deficiency; ferritin<30 µg/L and vitamin D deficiency; 25-hydroxyvitamin D<50 nmol/L) and anaemia (haemoglobin <120 g/L for females and <130 g/L for males) and when assessing associations with logistic regression models with adjusted ORs (AORs) for BMI categories: healthy weight (BMI 18.5 to <25.0 kg/m2), reference; overweight (BMI 25.0 to <30.0 kg/m2), obesity class I (BMI 30.0 to <35.0 kg/m2), obesity class II/III (BMI 35.0 kg/m2 or more).
Result The prevalence of vitamin B12 deficiency (range 0.9%─2.8%) and anaemia (range 3.9%─6.7%) were variable across BMI groups. The prevalence of iron deficiency in the obesity class I group was 12.0 percentage points lower than healthy weight group with an AOR of 0.50 (95% CI 0.30 to 0.83). The prevalence of vitamin D deficiency in the obesity class II/III group was 7.9 percentage points higher than the healthy weight group with an AOR of 1.62 (95% CI 1.01 to 2.60). Vitamin B12 deficiency and anaemia were not consistently associated with BMI groups.
Conclusion We found a consistent association between severe obesity and vitamin D deficiency in Australian adults. We also found obesity class I was negatively associated with iron deficiency, whereas there was no consistent association between BMI groups and vitamin B12 deficiency and anaemia. Public health strategies are needed to prevent vitamin D deficiency in this high-risk population.
- nutrition & dietetics
- anaemia
- public health
- epidemiology
Data availability statement
Publicly available datasets were analysed in this study. This data can be accessed subject to the ABS requirements.
This is an open access article distributed in accordance with the Creative Commons Attribution Non Commercial (CC BY-NC 4.0) license, which permits others to distribute, remix, adapt, build upon this work non-commercially, and license their derivative works on different terms, provided the original work is properly cited, appropriate credit is given, any changes made indicated, and the use is non-commercial. See: http://creativecommons.org/licenses/by-nc/4.0/.
Statistics from Altmetric.com
STRENGTHS AND LIMITATIONS OF THIS STUDY
We used a subsample from nationally conducted surveys.
We used measured height and weight and nutrient biomarkers to calculate body mass index and define micronutrient deficiencies, respectively.
We did not adjust for dietary sources of vitamin D in our models.
Introduction
Overweight and obesity is a global public health challenge affecting millions worldwide.1 Energy-dense and low-nutrient value (including micronutrients) diets are considered major contributors to the rising obesity epidemic.2 Micronutrients, often referred to as vitamins and minerals, are needed in small amounts and essential to sustain normal cellular and molecular functions of body.3 However, micronutrient deficiencies are a major form of malnutrition often referred to as hidden hunger4 and affect nearly two billion people globally, including people living with obesity5 6 and can cause other blood disorders. For instance, iron deficiency, the most common nutritional disorder, may lead to anaemia.7 8
Several micronutrient deficiencies and anaemia could partially be explained by excess adipose tissue, unhealthy dietary pattern and social behaviour, and biological factors typically associated with increased body mass index (BMI). For example, obesity is associated with inadequate intake of micronutrients such as vitamin B12 and iron, most likely due to poor quality diets.9 It has also been associated with impaired metabolism and excretion of micronutrients10 such as vitamin D11 and thiamine.12 Whereas the prevalence of impaired iron absorption from a meal, with and without ascorbic acid, was shown to be twofold higher in women with overweight and obesity compared with those in the healthy weight group.13
While these mechanisms offer plausible explanations for an increased risk of micronutrient deficiencies and anaemia associated with obesity, the existing evidence base on this issue is limited and unclear. For instance, a recent review showed that obesity was associated with iron deficiency, but these results differed across studies by diagnosis methods.14 Another study with 17 population-based surveys reported that overweight or obesity was associated with micronutrient deficiencies including vitamin D and iron deficiency and anaemia, but the results differed by geographical locations.15 Furthermore, a recent systematic review of cohort studies found inconsistent associations of vitamin D deficiency with obesity across several populations.16 Similarly, inconsistent results have also been reported for association studies of serum vitamin B12 with obesity.17 18
Therefore, we aimed to estimate the prevalence of micronutrient deficiencies and anaemia, and their association with BMI categories in a nationally representative sample of the Australian adult population.
Method
We present our study according to the journal requirements and the Strengthening the Reporting of Observational Studies in Epidemiology (STROBE) checklist for reporting cross-sectional studies.19
Study design, setting and participants
The data source for this study is the 2011–2013 Australian Health Survey (AHS) conducted by the Australian Bureau of Statistics (ABS). The AHS includes the National Health Survey (NHS) (n=20 425), the National Nutrition and Physical Activity Survey (NNPAS) (n=12 153) and the National Health Measures Survey (NHMS) (n=10 401). All people who were selected in the AHS participated in the NHS or the NNPAS, but data items core to both surveys such as demographics, smoking and physical measures, were collected and available for all participants. The NHS focused on the health status of Australians and health-related aspects of their lifestyles while the NNPAS collected respondents’ food intake and sedentary behaviour. Study participants in either the NHS or NNPAS who were 5 and above and gave consent were included in the NHMS, where blood and urine samples were collected for all participants 12 and more years of age.
The AHS employed a stratified multistage area sampling of private households. Within selected dwelling, a random subsample of one adult (aged 18 years and older), and (where applicable) one child aged 0–17 years (NHS), or one child aged 2–17 years (NNPAS) was selected. The NHS and NNPAS included a combined sample of approximately 25 000 private dwellings across Australia. The detailed methodology of the AHS can be found elsewhere.20 The blood samples in the NHMS were later tested for various nutrient biomarkers, including iron, vitamin B12 and vitamin D. For this study, we included the 3539 adults in the NNPAS (because the information on supplements including) iron and vitamin B12 were collected in the dietary assessment) who also participated in NHMS, who were not underweight and who were not pregnant or breastfeeding (as their nutrition requirements differ from the wider population) and agreed to be included in the NHMS (figure 1).
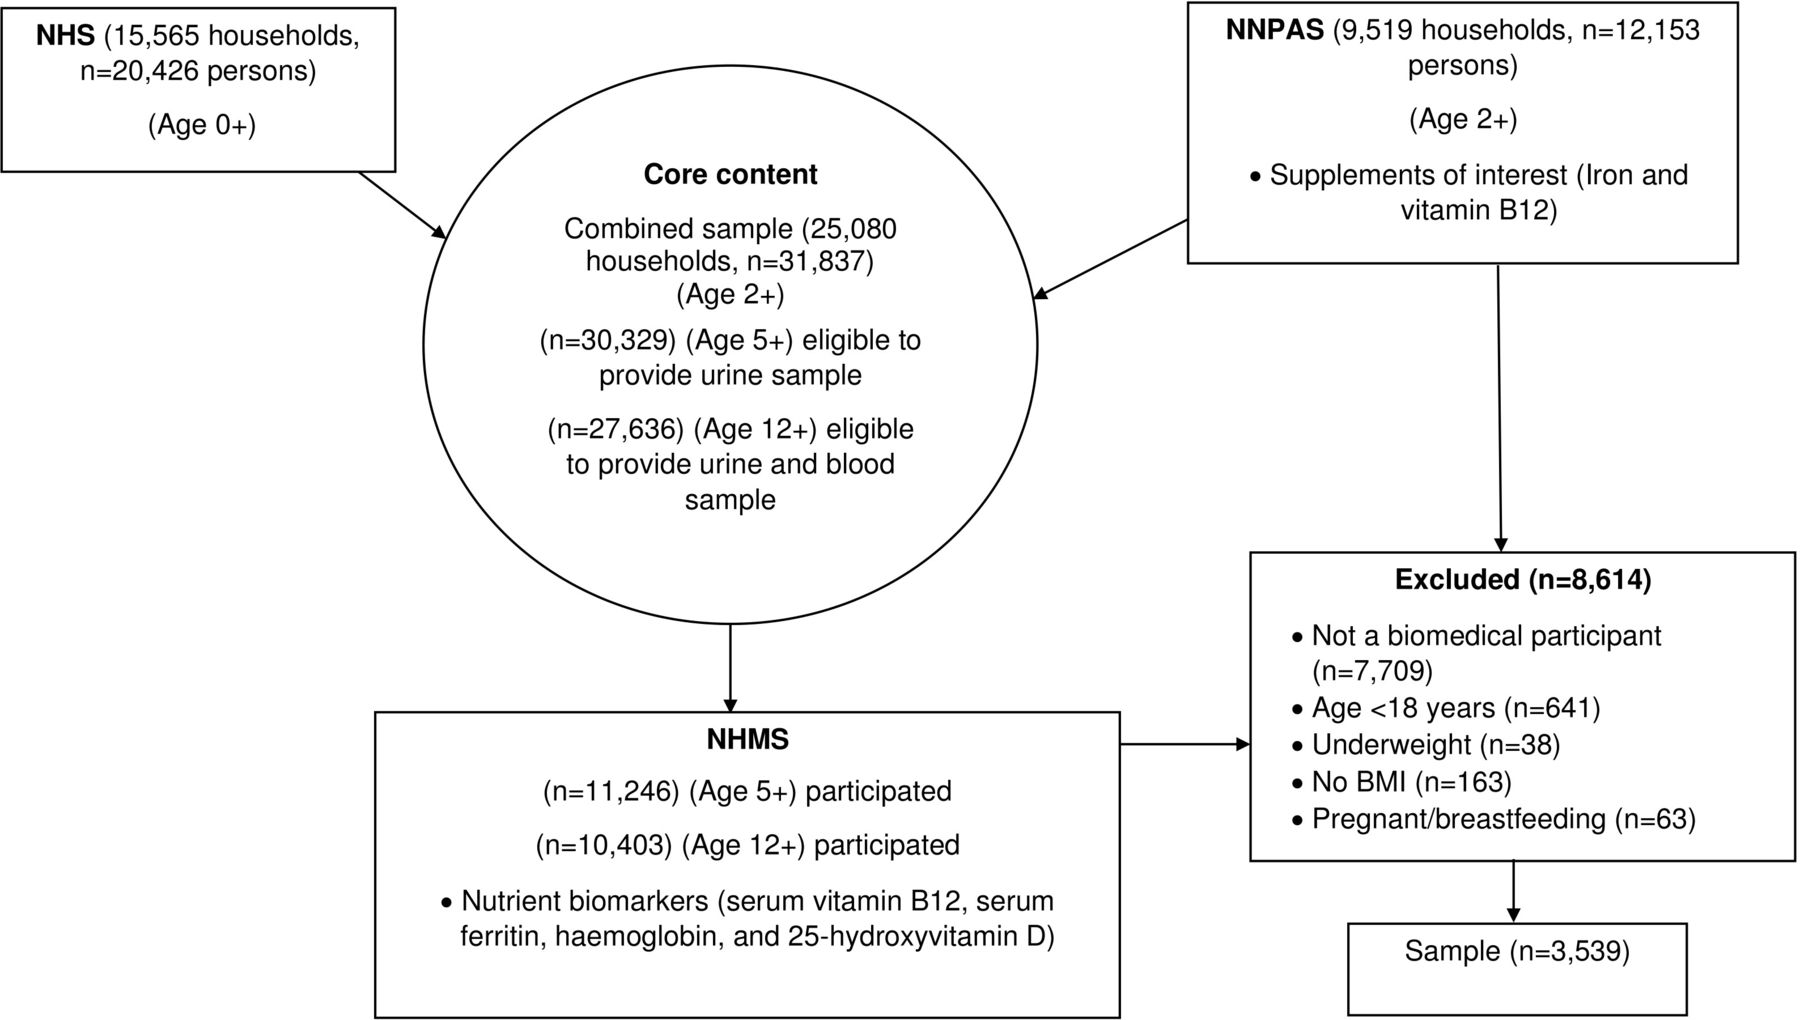
Flow chart of the structure of the 2011–2013 AHS and sampling in the present study. AHS, Australian Health Survey; NHS, National Health Survey; NNPAS, National Nutrition and Physical Activity Survey.
Sample size
As these data were collected for other purposes, no sample size calculations have been performed and statistical significance may not align with practical importance. Readers are cautioned to consider the practical size of the results and width of the CIs when reviewing the results.
Data sources/measurement
Trained ABS interviewers conducted face-to-face interviews with the selected adult of each selected household. AHS core data items included demographics, self-reported smoking status, self-reported fruit and vegetable intake, selected health conditions and female life stage as well as interviewer administered anthropometric measurements and blood pressure. For anthropometric measurements, study participants were asked to remove heavy clothing and shoes before their measurements were taken. Interviewers used digital scales (maximum 150 kg) and stadiometer (maximum 210 cm) to measure weight and height, respectively. In the NNPAS, 24-hour dietary recalls were employed using the Automated Multiple-Pass Method (AMPM) developed by the Agricultural Research Service of the United States Department of Agriculture.21 At the end of the AMPM, participants were asked additional questions on supplements they took. For the current study, data on iron and vitamin B12 supplements were used. In the NHMS, participants who agreed to the survey were given referral forms to sample collection clinics. Where study participants were unable to go to collection clinics, home visits and temporary clinics were offered. The samples were analysed at a central laboratory at Douglass Hanly Moir Pathology clinic in Sydney, Australia. Specific biomarkers collected in the NHMS include serum vitamin B12, serum ferritin, haemoglobin and 25-hydroxyvitamin D.
Variables
All survey questionnaires can be found within the AHS user’s guide.20
Dependent variable
This study investigated micronutrient deficiencies assessed by biomarkers of vitamin B12, iron and vitamin D. Vitamin B12 deficiency was defined as a serum vitamin B12 less than 145 pmol/L.22 Serum ferritin below 30 µg/L was used to define iron deficiency23; ferritin results of people with inflammation (defined in the NHMS as a C reactive protein (CRP) level of >10 mg/L) were excluded20 as increased levels may affect test results of ferritin thus affecting the interpretation of iron status of a population.24 25 For haemoglobin in the blood, results less than 120 g/L for females and less than 130 g/L for males was used to classify participants with anaemia.26 Vitamin D deficiency was defined as having a blood test result lower than 50 nmol/L of 25-hydroxyvitamin D.26
Independent variable
BMI was defined as weight in kilograms divided by height in metres squared. Following the WHO guidelines, we classified participants to healthy weight (18.5 to <25.0 kg/m2), overweight (25.0 to <30.0 kg/m2), obesity class I (30.0 to < 35.0 kg/m2) and obesity class II/III (35.0 kg/m2 or more).27
Covariates
We adjusted for sociodemographic, behavioural, long-term health conditions and supplement variables. The sociodemographic variables included age, sex and Socio-Economic Indexes for Areas (SEIFA), which allocates Australian residents a socio-economic score according to their area of residence. We used the following age groupings: 18–34, 35–54, 55–64 or 65 years and over. Sex was reported as female or male in the AHS. The ABS classified SEIFA in quintiles, the lowest 20% being the most disadvantaged and the highest 20% being the least disadvantaged group. The behavioural variables were self-reported and included smoking status (current smokers, ex-smokers or never smoked), meeting recommended fruit and vegetable intake (met or did not meet at least two fruit and five vegetable servings/day) and physical activity (met or did not meet at least 150 min/week of leisure-time activities). Long-term health conditions (no condition, one condition or multiple conditions), iron supplement (yes or no) and vitamin B12 supplement (yes or no) were also adjusted in our analyses.
Bias
In the NNPAS, of 12 366 approached dwellings 9519 (77.0%) households fully responded. For the biomedical component, of 30 329 respondents aged 5 and above in the combined sample from NHS and NNPAS, 11 246 (37.1%) respondents participated (figure 1). Since data collections for nutrient biomarkers were available, we analysed objective measures for micronutrient deficiencies. Furthermore, we have applied survey weights (produced for the biomedical component) of the AHS in our analyses which will adjust for results from a sample survey to infer to general population of adults who were not underweight, pregnant or breast feeding at the time of the survey.
Statistical analysis
All analyses are survey weighted to the Australian population using the ‘complex samples’ facility in IBM SPSS Statistics software.28 We present survey-weighted frequencies and percentages of characteristics, health behaviour (including supplements) and health conditions by BMI categories (healthy weight, overweight, obesity class I and obesity class II/III). We used survey-weighted χ2 tests to check for differences across the BMI groups. For total energy intake, we present survey-weighted means across the BMI groups and tested their difference using ANOVA. We estimated the population prevalence of vitamin B12 deficiency, iron deficiency, anaemia and vitamin D deficiency, and then fitted survey-weighted logistic regression models for each nutrient deficiency to generate adjusted ORs (AOR) with 95% CIs adjusting for covariates incrementally (up to six models). We started with an unadjusted model (model 1) before cumulatively adjusting for age and sex (model 2), SEIFA (model 3), smoking status, meeting recommended fruit and vegetable intake, physical activity (model 4) and long-term health conditions (from unmodifiable to modifiable variables) (model 5). For vitamin B12 deficiency, iron deficiency and anaemia, vitamin B12 supplement, iron supplement and iron deficiency were controlled for in the final models (model 6), respectively.
Sensitivity analyses
To test the robustness of the results in our models, we repeated the analysis for iron deficiency for female participants in their reproductive age (18–49 years) only (online supplemental table S1).
Supplemental material
As the results for ferritin tests were excluded for participants with elevated CRP (>10 mg/L), we also searched for evidence of sampling bias by comparing survey-weighted means in CRP and serum ferritin among those that excluded with elevated CRP using their unique TableBuilder29 available from the ABS website (online supplemental table S2).
Supplemental material
Patient and public involvement
No patient involved.
Result
This study included a total of 3539 adults. The most common BMI categorisation was overweight (n=1363, 38.5%), followed by healthy weight (n=1146, 32.4%) and obesity class I (n=682, 19.3%) (table 1). There were statistically significant differences in the proportions with each demographic characteristic (p<0.001) and number of long-term health conditions across BMI categories. Results for behavioural characteristics were more varied with differences in smoking status and current exercise between BMI categories but no evidence of statistically significant differences for meeting recommended vegetable and fruit intakes (p=0.721), iron supplement (p=0.361) and vitamin B12 supplement (p=0.682).
Characteristic of participants by BMI categories in the NNPAS 2011–2012 (n=3539)
We report survey-weighted prevalence estimates of micronutrient deficiencies using their biomarkers across BMI groups for the Australian population (table 2). Vitamin B12 deficiency rates ranged from 0.9% (in obesity class I) to 2.8% (in obesity class II/III). Iron deficiency rates showed an inverted ‘U’ shape and ranged from 7.0% (in obesity class I) to 19.0% (in healthy weight). Anaemia rates ranged from 3.9% (in obesity class I) to 6.7% (in obesity class II/III). Vitamin D deficiency rates ranged from 23.3% (in obesity class I) to 33.5% (in obesity class II/III).
Prevalence of micronutrient deficiencies in the NNPAS 2011–2012
We found evidence of statistically significant associations of BMI categories with two micronutrient deficiencies and anaemia (table 3). Obesity class II/III was consistently associated with an increased AOR relative for healthy weight for vitamin D deficiency. Overweight was associated with increased AOR relative for healthy weight for anaemia (model 6). Conversely, there was consistent statistically significance evidence that obesity class I had a decreased AOR relative to healthy weight for Iron deficiency in the unadjusted analysis and after controlling for covariates (models 1–6). Although there was statistically significant evidence that overweight was associated with a decreased AOR relative to healthy weight for iron deficiency in unadjusted model, it lost its significance when we controlled for the covariates (models 2–6). The result was identical in a sensitivity analysis in a subgroup of women of childbearing age (online supplemental table S1). However, survey-weighted mean serum ferritin was highest in the obesity class I group (online supplemental table S2), resulting the lowest prevalence of iron deficiency and possibly the negative association in this group. Furthermore, survey-weighted means of CRP consistently increased from healthy weight to obesity class II/III indicating inflammation increased as BMI increased (online supplemental table S2).
Survey-weighted multivariable adjusted association between nutrient deficiencies and BMI categories in the NNPAS 2011–2012
Discussion
This is the first study of micronutrient deficiencies and anaemia associated with BMI in Australian adults, which includes severe obesity. We found the prevalence of vitamin D deficiency was statistically significant and consistently highest in the obesity class II/III group by 7.9 percentage points (62%) compared with the healthy weight group, independent of a range of covariates. Consistent with our finding and expectations, a systematic review with meta-analysis reported the prevalence of vitamin D deficiency to be approximately 35% higher in individuals with obesity compared with the healthy weight group.30 Studies published since that review have also confirmed an association between obesity and increased risk of vitamin D deficiency.9 16 31 This association is likely explained by lower levels of sun exposure among those with obesity compared with healthy weight individuals. Vitamin D production in the skin is considered the primary natural source of vitamin D.32 People with obesity likely have decreased exposure to the sun from spending less time outdoors33–35 and wearing sun concealing clothing.36 Indeed, the prevalence of meeting physical activity guidelines in our sample was extremely low among those with severe obesity (table 1).
Although observational studies have shown lower rates of diseases in populations that have higher serum levels of vitamin D,37 the clinical benefits of vitamin D supplementation in these populations are not yet established.38–40 It has been suggested that to detect a clinically meaningful benefit with the supplementation, trials need to be in larger sample sizes and of longer durations.41 However, it is important to note that health risks associated with excess intake including toxicity and atherosclerosis have been reported.42 Thus, vitamin D supplementation should be considered for individuals who have vitamin D deficiency or inadequate sun exposure with caution.
We found no consistent association between BMI groups and vitamin B12 deficiency, which is in broad agreement with another study conducted in a small community-based sample in Western Australia.31 In contrast, population-based studies in the other countries have reported inverse associations between serum B12 levels and obesity.17 18 These inconsistencies are likely explained by methodological differences between studies. For instance, the study participants in the AHS were not required to fast for the nutrient biomarkers assessment.20 The lack of association between BMI and vitamin B12 deficiency could also have been explained by overconsumption of some processed foods that are typically fortified in Australia,43 consistent with our analysis showing total energy intake increased with BMI group (table 1). Further definitive research is required to determine the existence of associations of overweight and obesity with vitamin B12 deficiency in other countries and settings.
We found that the prevalence of iron deficiency was significantly lower in the obesity class I group only and by 12.0 percentage points (50%) compared with the healthy weight group, and by 7.9 percentage points compared with the obesity class II/III, showing an inverted ‘U’ shape. Our results showing a protective association of obesity class I for iron deficiency were robust even after adjustment of covariates and sensitivity analysis in women of reproductive age group (online supplemental table S1). This could be partially explained by our definition of iron deficiency using only ferritin, which is an acute-phase protein44 and can increase in systemic inflammation.45 For instance, a systematic review reported obesity was positively associated with iron deficiency, but for studies using non-ferritin-based diagnosis.14 Whereas another study that used serum iron and transferrin saturation showed women with obesity were four times more likely to have iron deficiency compared with the healthy weight individuals. Interestingly, the systemic inflammatory marker CRP is negatively associated with iron status independent of BMI, which confounds the positive association with obesity.46 In our study, although ferritin results of survey participants with CRP >10 mg/L were excluded, weighted mean serum ferritin was highest (online supplemental table S2) in obesity class I resulting in the lowest prevalence of iron deficiency compared with other BMI groups (table 2). Previous research has shown that the prevalence of iron deficiency may be underestimated by up to 12% when ferritin results are not corrected for in obesity with inflammation (defined by CRP >2 mg/L).47 Considering the conflicting role of CRP in iron status, our result might have been slightly confounded by sampling bias. Furthermore, iron deficiency might have been confounded by inflammatory factors and least relevant in high-income countries where consumption of animal sources of food is high.48
We found no consistent association between BMI groups and anaemia. However, after adjustment for iron deficiency, the overweight group was positively associated with anaemia (model 6, table 3). In contrast to our results, overweight or obesity was shown to be associated with a lower likelihood of anaemia in the USA and Colombia.7 49 These contrasting findings might have been partially explained by methodological differences such as controlling for inflammation.7 Although we did not adjust for inflammation in the statistical models for anaemia, our results are consistent with previous research in women of reproductive age in countries with a high burden of infectious diseases showing iron deficiency was a strong predictor of anaemia.50 Furthermore, another study showed that women with overweight or obesity are more likely to have anaemia suggesting that overnutrition and anaemia may co-exist in individuals with excess weight.15
There are methodological strengths of our study worth highlighting. First, we have applied survey weights in our analyses to infer prevalence estimates to the general population of adults. Second, the AHS excluded people with CRP level of >10 mg/L, thereby reducing the risk of bias from inflammation or infection.51 Several study limitations are also noteworthy. Because of the cross-sectional study design, causal inferences of associations of micronutrient deficiencies and anaemia with BMI groups presented in this study should be interpreted with caution. Moreover, we did not control for hepcidin, a hormone important in the regulation of iron homoeostasis for a more accurate interpretation of iron status.52
Conclusion
We found consistent associations between severe obesity and vitamin D deficiency in Australian adults. We also found obesity class I was negatively associated with iron deficiency, whereas there was no consistent association between BMI groups and vitamin B12 deficiency and anaemia. Clinicians and health policy makers should be aware that severe obesity is positively associated with vitamin D deficiency in the general population. Public health strategies are needed to prevent vitamin D deficiency in this high-risk population group.
Data availability statement
Publicly available datasets were analysed in this study. This data can be accessed subject to the ABS requirements.
Ethics statements
Patient consent for publication
Acknowledgments
The authors would like to thank the study participants.
References
Supplementary materials
Supplementary Data
This web only file has been produced by the BMJ Publishing Group from an electronic file supplied by the author(s) and has not been edited for content.
Footnotes
Twitter @CanaanSeifu, @EvanAtlantis
Contributors Guarantor, CNS; Conceived, CNS and EA; formal analysis, CNS, PF and EA; writing—original draft preparation, CNS, PF and EA; writing—reviewing and editing, CNS, PF and EA. All authors have read and agreed to the final version of the manuscript.
Funding This research received funding for publication from Western Sydney University.
Competing interests EA was the Founding President, and now serves as the Secretary, of the National Association of Clinical Obesity Services (NACOS). He has received honoraria from Novo Nordisk for speaking and participating at meetings. He has received unrestricted research funding from Novo Nordisk and iNova on behalf of National Association of Clinical Obesity Services.
Patient and public involvement Patients and/or the public were not involved in the design, or conduct, or reporting, or dissemination plans of this research.
Provenance and peer review Not commissioned; externally peer reviewed.
Supplemental material This content has been supplied by the author(s). It has not been vetted by BMJ Publishing Group Limited (BMJ) and may not have been peer-reviewed. Any opinions or recommendations discussed are solely those of the author(s) and are not endorsed by BMJ. BMJ disclaims all liability and responsibility arising from any reliance placed on the content. Where the content includes any translated material, BMJ does not warrant the accuracy and reliability of the translations (including but not limited to local regulations, clinical guidelines, terminology, drug names and drug dosages), and is not responsible for any error and/or omissions arising from translation and adaptation or otherwise.