Article Text

Abstract
Objective This study comprehensively estimated the excess cardiovascular disease (CVD) mortality attributable to influenza in an older (age ≥65 years) population.
Design Ecological study.
Setting Aggregated data from administrative systems on CVD mortality, influenza surveillance and meteorological data in Beijing, China.
Main outcome measure Excess overall CVD, and separately for ischaemic heart disease (IHD), ischaemic stroke, haemorrhagic stroke mortality attributable to influenza, adjusting for influenza activity, time trend, seasonality and ambient temperature.
Results CVD (risk ratio (RR) 1.02, 95% CI 1.01, 1.02), IHD (RR 1.01, 95% CI 1.01, 1.02), ischaemic stroke (RR=1.03, 95% CI 1.02, 1.04), but not haemorrhagic stroke (RR=1.00, 95% CI 0.99, 1.01) mortality, were significantly associated with every 10% increase in influenza activity. An increase in circulating A(H1N1)09pdm, A(H3N2) and B type virus were all significantly associated with CVD and ischaemic stroke mortality, but only A(H3N2) and B type virus with IHD mortality. The strongest increase in disease mortality was in the same week as the increase in influenza activity. Annual excess CVD mortality rate attributable to influenza ranged from 54 to 96 per 100 000 population. The 3%–6% CVD mortality attributable to influenza activity was related to an annual excess of 916–1640 CVD deaths in Beijing, China.
Conclusions Influenza activity has moderate to strong associations with CVD, IHD and ischaemic stroke mortality in older adults in China. Promoting influenza vaccination could have major health benefit in this population.
Background Influenza may trigger serious CVD events. An estimation of excess CVD mortality attributable to influenza has particular relevance in China where vaccination is low and CVD burden is high.
Methods This study analysed data at the population level (age ≥65 years) using linked aggregated data from administrative systems on CVD mortality, influenza surveillance and meteorological data during 2011 to 2018. Quasi-Poisson regression models were used to estimate the excess overall CVD, and separately for IHD, ischaemic stroke, haemorrhagic stroke mortality attributable to influenza, adjusting for influenza activity, time trend, seasonality and ambient temperature. Analyses were also undertaken for influenza subtypes (A(H1N1)09pdm, A(H3N2) and B viruses), and mortality risk with time lags of 1–5 weeks following influenza activity in the current week.
- cardiology
- epidemiology
- infectious diseases
This is an open access article distributed in accordance with the Creative Commons Attribution Non Commercial (CC BY-NC 4.0) license, which permits others to distribute, remix, adapt, build upon this work non-commercially, and license their derivative works on different terms, provided the original work is properly cited, appropriate credit is given, any changes made indicated, and the use is non-commercial. See: http://creativecommons.org/licenses/by-nc/4.0/.
Statistics from Altmetric.com
Strengths and limitations of this study
This population-based data linkage study estimated influenza-associated cardiovascular mortality in a setting where vaccination rates are low and cardiovascular disease (CVD) burden is high.
Seasonality, time trends and ambient temperature were adjusted as potential cofounders.
Time lags were applied to assess any delayed time interval between influenza activity and CVD deaths.
Individual-level analysis can be considered if data are available.
Season-varying factors such as lifestyle and physiological changes could still have contributed to residual confounding.
Introduction
Evidence is accumulating that influenza can trigger major cardiovascular disease (CVD) events, exacerbate underlying CVD and cause myocarditis and pericarditis. However, there remains uncertainty over the strength of associations, overall and for specific CVD conditions,1–3 which is important for informing public health decisions over resource allocation for prevention and treatment. The CVD consequences of influenza4–6 have received limited attention, and opportunities for vaccination and other prevention strategies have been poorly implemented. In particular, influenza vaccination covers only 2% of the Chinese population, compared with approximately 60% of those in many high-income countries.7 8 Despite the WHO recommending influenza vaccination in all high-risk people, such as the elderly and those with chronic conditions, rates appear to be declining worldwide.9
In China, the burden of CVD has a unique profile, with more people dying from stroke than ischaemic heart disease (IHD) and considerable higher rates of haemorrhagic stroke than in many other countries.10 Yet, there are no data on the excess CVD mortality related to influenza.11 In the past decade, the Beijing Center for Disease Control and Prevention (BJCDC) has established robust mortality and influenza surveillance systems for its residents, but rates of influenza vaccination remain low (see online supplemental file 1).12 13 Herein, we present analysis of the relation of influenza and primary causes of CVD deaths using city-wide vital statistics and weekly influenza surveillance during 2011–2018.
Supplemental material
Methods
Study design and data sources
We undertook a population-level observational study, using aggregated mortality, population, influenza surveillance and meteorological data extracted from routinely-collected administrative data systems (figure 1). Cause-specific deaths were filtered by International Classification of Diseases (ICD-10) codes: all CVD (I00-I99), IHD (I20-I25), ischaemic stroke (I63), haemorrhagic stroke (I61, I62) between 3 January 2011 and 1 July 2018 through the Beijing Mortality Register and Surveillance System, a real-time internet-based system maintained by Beijing CDC that captures all deaths, both in and out of hospital. Underlying cause of death data were manually coded and verified by trained staff at every hospital or community health centre in Beijing.13 Annual registered resident data by age group and sex between 2011 and 2018 were extracted from Beijing Statistics Yearbook (http://tjj.beijing.gov.cn/tjsj_31433/). Age-stratified and sex-stratified population from the sixth census in China in 2010 were used as the standard reference population. Weekly mortality data were retrieved from the mortality surveillance system for each week (from Monday to Sunday), and standardised by age and sex using data from Beijing Statistical Yearbook.
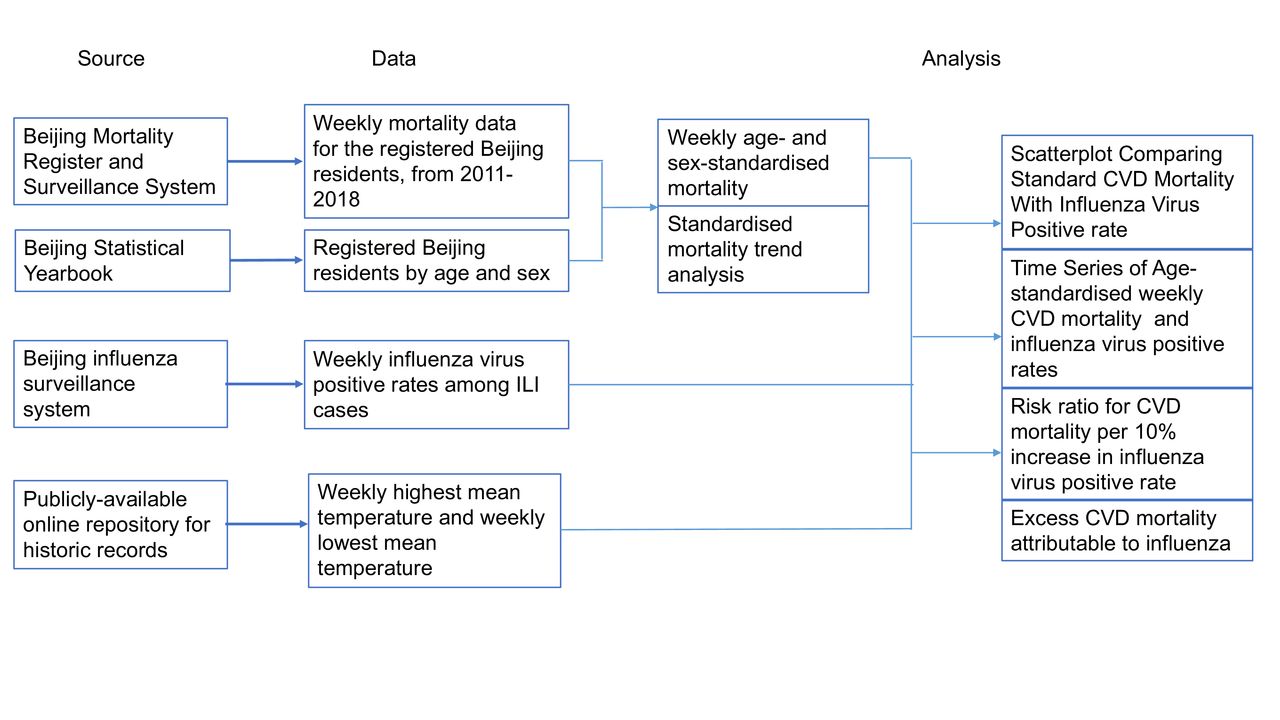
Data sources and analysis. CVD, cardiovascular disease; ILI, influenza-like illness.
The Beijing influenza surveillance system was established in 2007 to allow influenza-like illness (ILI) and laboratory-confirmed influenza (ILI+) to be prospectively tracked across 153 general hospitals in Beijing.12 Throat-swab specimens were tested using reverse-transcriptase polymerase chain reaction (RT-PCR) techniques at 23 sentinel hospitals in Beijing.14–16 The results of testing are entered into the platform of Beijing CDC, ILI+/ILI, the proportion of positive specimens in throat-swab specimen tested ILI patients, were calculated for each week as an indicator for influenza activity.
Weekly highest mean temperature and lowest mean temperature data between Monday, 3 January 2011 and Sunday, 1 July 2018 were obtained from an online repository (http://www.tianqihoubao.com/lishi/). All the retrieved data were linked by the calendar time.
Data analysis
Age-standardised and sex-standardised death rates were calculated from the 2010 census data of registered population (aged ≥65 years) in Beijing according to six age-groups (65–69, 70–74, 75–79, 80–84, 85–89 and 90+) using the following formula:


where n is the number of age-groups.  represents the actual number of deaths for women in the age-group k.
  represents the actual number of deaths for men in the age-group k.
  represents the woman population in the age-group k.
  represents the male population in the age-group k.
  represents the standard population of women in the age-group k.
  represents the standard population of men in the age-group k.
Mann-Kendall trend analysis was used to test the annual age-standardised and sex-standardised disease mortality rates during 2011–2018. Weekly age-standardised and sex-standardised CVD mortality rates were compared with weekly ILI+/ILI using Spearman correlation coefficient to determine the magnitude of any association. Quasi-Poisson regression modelling, which accounts for over-dispersed variables when the variance in weekly deaths is greater than the mean,17 was applied to associate weekly influenza activity with CVD mortality. The models included terms for influenza activity (ILI+/ILI), seasonality, time trends, and confounding variable ambient temperature. The models were fitted separately for weekly numbers of deaths from different causes between 2011 and 2018, as outlined below:

Where  represents the age-standardised and sex-standardised weekly CVD death number; α is the offset term equal to the standard population size (≥65 years);
  accounts for any linear time trend,
  and
and  account for nonlinear time trends;
  and
and  account for seasonal changes in CVD mortality;
  is the coefficient associated with the weekly proportion of specimens tested positive for a sum of influenza A(H1N1)pdm09, A(H3N2) and B subtypes and
  is the coefficient of a confounder that is identified from potential factors (eg, highest or lowest mean temperature in a week) and
  represents the error term.
We also applied 1- to 5-week lags on weekly influenza virus-positive rates in the regression model to account for any delayed time interval between influenza activity and CVD deaths. Negative binomial regression models were used as sensitivity analysis, separately for each disease outcome.
Excess mortality rates were estimated according to the difference between observed mortality and predicted mortality rates with the coefficient of influenza infection variable set as 0 in the fitted model.18 19 The annual influenza season in northern hemisphere is defined as from the 27th week of the previous year to the 26th week of the current.20 The quasi-Poisson regression model was also used to estimate the excess CVD mortality. Estimation of the annual number of excess CVD death was obtained as the sum of all positive weekly differences for each influenza season (ie, negative weekly differences were recoded to 0). Influenza-associated excess deaths were estimated separately for influenza A(H1N1)pdm09, A(H3N2) and B viruses.
Bootstrap resampling with 1000 resamples was to calculate 95% CIs for each estimated excess death number. All statistical analyses were performed using R, V.3.6.1 (R Foundation for Statistical Computing, Vienna, Austria, https://www.R-project.org/).
Role of the funding source
This study was supported by a grant from Sanofi Pasteur. Sanofi Pasteur had no role in design of the study, analysis of data or preparation of this manuscript.
Patient and public involvement
Patients or the public were not involved in the design, or conduct, or reporting, or dissemination plans of our research.
Results
Table 1 shows that age-standardised and sex-standardised annual CVD (from 1545 to 1783 per 100 000 population, p=0.002) and IHD (from 742 to 938 per 100 000 population, p=0.002) mortality rates increased significantly during 2011–2018, while there were non-significant declines in ischaemic stroke (from 209 to 166 per 100 000 population, p=0.27) and haemorrhagic stroke (from 148 to 108 per 100 000 population, p=0.27) mortality rates. The median of influenza virus-positive rates ranged from 1.5% to 12.3%, with subtype A(H3N2) being the most frequent, followed by subtype B and subtype A(H1N1), respectively. ILI+ and ILI numbers by year are presented in the online supplemental file 1. The two lowest influenza years of 2011–2012 and 2013–2014, correlated with the two lowest age-standardised and sex-standardised CVD mortality rates over the study period. Age-standardised and sex-standardised mortality rates were generally higher than the crude rates, likely reflecting population ageing.
Cardiovascular diseases mortality rate (per 100 000 population age ≥65 years) and influenza virus-positive rate (%) in Beijing, China during 2011–2018
Overall crude CVD (r=0.69, p<0.001), IHD (r=0.67, p<0.001), ischaemic stroke (r=0.43, p<0.001) and haemorrhagic stroke (r=0.27, p<0.001) mortality rates were all significantly correlated with influenza activity (see online supplemental file 1). Influenza virus activity showed marked seasonality matching CVD mortality patterns. Figure 2 shows the overall trend for influenza activity to have regular annual peaks at the end and beginning of each year; disease mortality and influenza activity peaks overlapped and without any time-lag. After adjusting for weekly temperature and study time, CVD, IHD and ischaemic mortality rates were all significantly associated with influenza virus activity (risk ratio (RR) and 95% CI: 1.02 (1.01, 1.02), 1.01 (1.00, 1.02) and 1.03 (1.02, 1.04), respectively, with every 10% increase in influenza virus-positive rate). This translated into an estimated RR of CVD, IHD and ischaemic stroke mortality of 1.08 (1.05, 1.11), 1.07 (1.03, 1.11), 1.17 (1.10, 1.24), respectively, when influenza virus-positive rate increased to 50%. However, haemorrhagic stroke mortality was not associated with influenza virus activity (RR 1.0 (0.99, 1.01) with every 10% increase in influenza virus-positive rate) (figure 3). Sensitivity analysis using negative binomial models showed robust results (see online supplemental file 1).

Time series of age-standardised and sex-standardised weekly cardiovascular mortality and weekly positive influenza virus rate in the population (≥65 years) in Beijing, China during 2011–2018. AHS, acute haemorrhagic stroke; AIS, acute ischaemic stroke; CVD, cardiovascular disease; IHD, ischaemic heart disease.

Incidence risk ratio for cardiovascular mortality per 10% increase in influenza virus-positive rate in the population (≥65 years) in Beijing, China during 2011–2018. AHS, acute haemorrhagic stroke; AIS, acute ischaemic stroke; CVD, cardiovascular disease; IHD, ischaemic heart disease.
Figure 4 shows that all subtypes of influenza virus were associated with increased CVD mortality: influenza A(H1N1)pdm09, RR 1.01 (95% CI 1.00, 1.02); influenza A(H3N2), RR 1.01 (95% CI 1.01, 1.02) and influenza B, RR 1.02 (95% CI 1.01, 1.03). Similar associations were evident for ischaemic stroke mortality: 1.03 (1.01, 1.05), 1.03 (1.01, 1.05) and 1.03 (1.01, 1.05) for influenza A(H1N1)pdm09, influenza A(H3N2) and influenza B, respectively. Only influenza A(H3N2) and influenza B were associated with increased IHD mortality (RR 1.02 (1.01, 1.03) and 1.02 (1.01, 1.03)). No subtype of influenza virus was associated with haemorrhagic stroke.

Incidence risk ratio for cardiovascular mortality per 10% increase in influenza virus-positive rate by influenza virus subtypes in the population (≥65 years) in Beijing, China during 2011–2018. AHS, acute haemorrhagic stroke; AIS, acute ischaemic stroke; CVD, cardiovascular disease; IHD, ischaemic heart disease.
There was no apparent time lag for influenza virus activity and increased CVD, IHD and ischaemic stroke mortality; the strongest association during or within a week of activity. The association declined but remained statistically significant up to 4, 3 and 5 weeks after influenza activity with CVD, IHD and ischaemic stroke mortality (figure 5).

Incidence risk ratio for cardiovascular mortality per 10% increase in influenza virus-positive rate with time lags in the population (≥65 years) in Beijing, China during 2011–2018. AHS, acute haemorrhagic stroke; AIS, acute ischaemic stroke; CVD, cardiovascular disease; IHD, ischaemic heart disease.
Annual excess CVD mortality attributable to influenza ranged from 54 to 96 per 100 000 population, which accounted for 3%–6% of the background CVD mortality without any influenza activity. This excess mortality was estimated to contribute between 916 and 1640 excess CVD deaths annually in those aged ≥65 years in Beijing. For CVD subcategories, IHD was associated with the highest excess mortality (27–49 per 100 000 per year), but ischaemic stroke showed the larger proportion of excess mortality over background mortality (8%–11%) (table 2).
Influenza-associated excess cardiovascular mortality in the population (≥65 years) Beijing, China during 2011–2018
Discussion
Our population-based data linkage study has shown consistent association of increased respiratory specimens testing positive for influenza virus (ILI+) in ILI cases with increased CVD, IHD and ischaemic stroke mortality in Beijing in the last decade. When influenza virus activity increased such that ILI+/ILI equalled to 50%, we estimated the excess CVD, IHD and ischaemic stroke mortality increased by 8%, 7% and 17%, respectively, in those aged ≥65 years. The association had minimal temporal lag and there was no significant excess haemorrhagic stroke mortality with influenza virus activity. These findings were consistent across different subtypes (A(H1N1)pdm09, A(H3N2) and B) of influenza infection, except A(H1N1)pdm09 was not associated with IHD mortality.
Our study provides important findings that differ from previous reports. First, the association of increased CVD mortality risks and influenza lagged for several weeks. Second, the fatal consequence of influenza happens within a short time window, which is contrary to some but not all studies.21 22 This could reflect our focus on older adults, those at highest risk of CVD, rather than broader population. As the strength of association for ischaemic stroke mortality and influenza was the strongest of all the CVD categories, it is possible that predisposing factors in the vascular tree or susceptibility to respiratory infection were higher in our study population compared with others.
Few studies have assessed the association of infection and haemorrhagic stroke. One large prospective study showed no such association of influenza and haemorrhagic stroke,23 and trials assessing the efficacy of influenza vaccination have failed to show significant benefits for haemorrhagic stroke.24 25 The large sample size of our study allowed us to optimise statistical power to examine associations of influenza activity and individual CVD subtypes including haemorrhagic stroke, with adjustment for various factors, such as daily temperature, seasonality and time. The stronger association of influenza with ischaemic CVD rather than haemorrhagic stroke deaths supports studies indicating that inflammation destabilises vulnerable atherosclerotic plaques and enhances circulating clotting factors.26 27
Our finding of no significant association of A(H1N1)pdm09 and IHD mortality is consistent with other data suggesting this strain is less likely to infect the elderly with existing immunity.28 Thus, the adverse consequence of A(H1N1)pdm09 infection could be mitigated, with few deaths reported from this virus in China.29 Conversely, A(H1N1)pdm09 was significantly associated with CVD and ischaemic stroke mortality, although the explanations are less clear. Host responses may differ across various circulating strains of the virus subtypes, with influenza-associated death rates highest when influenza B virus being dominant in China, while the highest death rates are associated with A(H3N2) activity in the USA.20 30 Both A(H3N2) and influenza B had comparable strengths of association for CVD, IHD and ischaemic stroke mortality, raising complexities over the allocation of resources based on circulating strains of influenza activity.
There are many studies suggesting that influenza vaccines protect against CVD, both primary and secondary prevention. However, most of them have employed different observational designs, which are prone to many biases.31–34 The question of whether influenza vaccination can prevent CVD mortality can only be answered in randomised trials, although as challenging as they are in accumulating adequate outcome events related to plausibly modest treatment effects.35 36 Yet, such studies are warranted given the need for evidence-based clinical and health policy recommendations over the coverage of influenza vaccination.
We recognise our study has several limitations. Most importantly, we lacked vaccination and other data at the individual level, and thus were unable to estimate the contribution of vaccination to the excess mortality. Furthermore, although temperature, seasonality and study time were accounted for in our analyses, other season-varying factors such as lifestyle and physiological changes, as well as other possible time-varying variables, could still have contributed to residual confounding. Although the large population of Beijing lies in the north of China, our results may not be generalisable to other areas, particularly those in the south of the country where the climate tends to be subtropical. Finally, despite BJCDC having established a robust mortality and influenza surveillance system, there is still the potential for misclassification and under-reporting of deaths leading to an underestimation of influenza-associated excess mortality.
In summary, our data linkage study extends earlier findings in showing a clinically important association of influenza and CVD mortality, overall and across specific subtypes and provides support for the broad population-wide benefits of vaccination as a simple and safe approach to improving outcomes for those at high risk of CVD events in the community.
References
Supplementary materials
Supplementary Data
This web only file has been produced by the BMJ Publishing Group from an electronic file supplied by the author(s) and has not been edited for content.
Footnotes
XD and JD are joint senior authors.
RL, XL and PY contributed equally.
Contributors XD, CA and JD conceptualised the study and acquired funding. PY, SW, JS, ZW and QW acquired the data and provided technical support for accessing and linking databases. XD, RL, XL, LH, SX and CJ formed the study protocol and statistical analysis plan. XLiu, TC, XL and GX conducted the statistical analysis and created figures. XL, TC, RL, XD, LH, CA, MDH and CRM interpreted the study results. RL, XL and XD drafted the manuscript, compiled and addressed comments from coauthors. CA revised the manuscript and provided intellectual input in advocating for policy change and developing a potential intervention strategy. All authors reviewed and approved the final version of the manuscript.
Funding This work was supported by Sanofi Pasteur (grant number FLU00105).
Competing interests None declared.
Patient consent for publication Not required.
Ethics approval The ethics committee of Beijing Anzhen Hospital approved the study.
Provenance and peer review Not commissioned; externally peer reviewed.
Data availability statement Data are available upon reasonable request to the corresponding author.
Supplemental material This content has been supplied by the author(s). It has not been vetted by BMJ Publishing Group Limited (BMJ) and may not have been peer-reviewed. Any opinions or recommendations discussed are solely those of the author(s) and are not endorsed by BMJ. BMJ disclaims all liability and responsibility arising from any reliance placed on the content. Where the content includes any translated material, BMJ does not warrant the accuracy and reliability of the translations (including but not limited to local regulations, clinical guidelines, terminology, drug names and drug dosages), and is not responsible for any error and/or omissions arising from translation and adaptation or otherwise.