Article Text

Abstract
Although people are living longer, there is no discernible pattern about the quality of life in an increasing lifespan. This restricts our capacity to predict and prepare for the consequences of population ageing. Accordingly, we propose a population ageing indicator that combines demographic and disability prevalence data through a characteristics approach and explore different scenarios to account for uncertainty in life quality projections. Our results, available for 186 countries, show that countries that rank older under conventional chronological ageing measures may rank younger under our qualitative measure. Additionally, we find substantial differences in our projections depending on different health assumptions, demonstrating the risk of using ageing indicators that make implicit assumptions about health characteristics.
- health economics
- medical demography
- epidemiology
Data availability statement
Data are available in a public, open access repository. All data relevant to the study are included in the article or uploaded as supplementary information.
This is an open access article distributed in accordance with the Creative Commons Attribution Non Commercial (CC BY-NC 4.0) license, which permits others to distribute, remix, adapt, build upon this work non-commercially, and license their derivative works on different terms, provided the original work is properly cited, appropriate credit is given, any changes made indicated, and the use is non-commercial. See: http://creativecommons.org/licenses/by-nc/4.0/.
Statistics from Altmetric.com
Key questions
What is already known?
Various studies have proposed qualitative indicators of population ageing accounting for healthy ageing scenarios.
These indicators showcase less worrisome ageing projections than chronological measures.
What are the new findings?
We compare future health assumptions of said indicators using a common methodology over different scenarios and find they lead to substantial differences in projections.
Our results are evidence of the risk in using ageing indicators that make implicit assumptions about health characteristics.
What do the new findings imply?
We demonstrate that understanding the degree of uncertainty in healthy ageing is imperative in designing appropriate public healthcare and social security systems and future productivity.
Introduction
Over the last two centuries, humans have experienced an unprecedented increase in life expectancy which combined with decreasing fertility rates have triggered an increase in the population’s median age and the share of individuals above typical ‘old-age’ thresholds, a phenomenon known as population ageing.1 2 For instance, between 1950 and 2015, the median age of the world’s population increased from 23 to almost 30 years2. However, this trend has not slowed down, and is one of the most significant features of current global demography, with every country projected to experience an increase in the share of people aged 60 and over in the coming decades.3
One of the most common population ageing indicators is dependency ratios (DRs), which compares different population groups dividing those considered ‘dependent’ over those considered ‘productive’. For example, the most popular version of the DR, the old-age DR (OADR) divides those over the age of 64 by those between the ages of 20 and 64.2 DRs have been broadly used to show how population ageing affects societies in many ways including, productivity,3 4 disability and dependence,5 6 social security sustainability7 and innovation.8 9 The reasoning is that old and young individuals have different characteristics. For example, if older individuals have lower saving rates, population ageing could decrease the average saving rate of the economy, affecting investment and productivity.3
Chronological DRs are those based only on one characteristic of the individual, their age. An individual is assigned to one group or another based only on their age, implicitly assuming that other characteristics of an individual are fixed by age. However, ageing is a multi-dimensional concept associated with physical, social and behavioural characteristics of individuals that are only partly associated with chronological ageing.8 10 Hence, chronological DRs alone might be modest proxies of population ageing.2 For example, they assume that health remains constant with age, even if life expectancy is increasing. This would lead to an increase in the share of life with poor health, an scenario known as the expansion of morbidity.11 12
In contrast, some studies argue that gains in life expectancy would translate into gains in other health characteristics.13 Thus, chronological DRs could overestimate the pace of population ageing, at least in terms of physical conditions of the population. Accordingly, they proposed DRs based on life expectancy, where individuals are considered old when they reach an age at which life expectancy falls below a certain threshold.2 13 These dynamics are analogous to the compression of morbidity scenario, which assumes that mortality at the older ages would reach a limit beyond there could be no further decline; however, we would see compression of morbidity into a smaller number of years at the end of life.11 14
The problem with the indicators described above is that we cannot confirm their assumptions on longer life expectancy and changes in quality of life.10 Longitudinal studies show inconsistent results, with some suggesting falling levels of severe disability and cognitive impairment in older adults, others indicating rising rates of chronic diseases and comorbidity but steady rates of disability, and yet others suggest increasing levels of disability. Furthermore, these patterns may also vary geographically.6 10 15–19 Understating the degree of this uncertainty and how it affects ageing projections is imperative in designing appropriate public healthcare and social security systems, as well as measuring how ageing will affect future productivity.1 6 20 21
To produce projections and cope with the uncertainty regarding changes in mortality and health characteristics, we propose a new ageing indicator that is quantified under alternative scenarios based on different assumptions of the population’s health characteristics. We include a constant prevalence by age scenario, a scenario that links disability to life expectancy, a scenario that projects disability using average growth rates from historical data, and a catch-up between countries scenario (complete description in the methods section).
Similar indicators have been proposed in other studies. Harwood et al generated projections of dependency based on disability using demographic projections by age groups and maintaining disability prevalence rates constant by age.5 Sanderson and Scherbov also proposed a measured based on disability prevalence, but generated projections linking prevalence rates to life expectancy.22 Skirbekk et al calculated DRs based cognitive functioning of senior citizens and showed that the ageing ranking for countries changes when their indicator is compared to the OADR.20 Chang et al used morbidity data to identify and measure the burden of age-related diseases. Then, the authors compared countries and historical data by estimating the average age at which countries’ populations have an equivalent age-related health burden.23 Balachandran and James estimated a multi-dimensional measure of population ageing based on life expectancy, health and human capital to compare a set of European and Asian countries. Our work expands previous literature in three ways. First, we expand the sample of countries included in projections to almost all UN members (186 from 193 members). Second, we proposed and compare multiple scenarios for the trajectories of health projections. Third, we base our calculations on the characteristics approach to ease the decomposition and comparability of our indicator.
Methods
The characteristics approach
We propose a DR, the disability dependency ratio (DDR), that measures population ageing based on health characteristics of the population. The indicator is developed following the characteristics approach developed by Sanderson and Scherbov which provides a method to build DR based on qualitative and demographic characteristics of populations. Developing a characteristics approach, means that each age group of the population is weighted by multiplying the number of individuals in the group by a matrix of qualitative indicators. Following this methodology facilitates the interpretation, comparability and decomposition of ageing indicators. For each country, we apply the characteristics approach by multiplying 5-year population groups by the group’s average disability prevalence rate. Thus, our indicator is affected by both, the age structure and the disability prevalence of the population.24 A limitation of this approach is the unidimensional and purely biomedical definition of healthy ageing.25 26 However, under a multidimensional operationalisation, data constraints would severely narrow our sample. The detailed protocol describing our application of this approach can be found in the online supplementary appendix for reproducibility.
Supplemental material
Data
We use the United Nation’s Population Prospects database for the demographic characteristic of our indicator (the total population in each age group). The qualitative characteristic is obtained using morbidity data from the Global Burden of Disease (GBD) database which provides estimations of disability prevalence by age group, sex and cause, for the 1990–2017 period and 195 countries.27 After multiplying each age-group by its prevalence rate, we follow Sanderson and Schervob22 and calculate the DDR as the number of adults (20+ years of age) with disabilities over the number of adults without disabilities for all 195 countries with available data in the GBD database.
Cross-sectional comparison and projections
With the data available, we can compare how the ranking of countries changes according to different ageing indicators for the 1990–2017 period. Then, we generate projections of the DDR under different assumptions. For each country, we use the United Nation’s Population Prospects database to project the demographic components of our indicators (the total population in each age group) and different scenarios for the disability prevalence of the population, including: (1) DDR constant prevalence: we keep the prevalence rate constant for each age group at its last historical value available, as in Harwood et al5; (2) DDR past trends: we project prevalence rate for each age group by setting the average annual percentual change in the prevalence rate equal to the observed average percentual change in historical data, as in Lafortune and Balestat28; (3) DDR life expectancy: we estimate the relationship between disability prevalence and life expectancy using a panel regression for each age-group and then forecast the prevalence rates using life expectancy projections from the UN, as in Sanderson and Scherbov22; and (4) DDR catch-up: the disability prevalence rate of each age group ‘catches-up’ between 2015 and 2100 at a constant rate, with the rate of the country with the lowest prevalence in 2015.
From the 195 countries with data available at the GBD database, the projections are available for 184 countries. Nine are dropped due to data availability at the United Nation’s Population Prospects database (Taiwan, Bermuda, Puerto Rico, Dominica, Northern Mariana Islands, Andorra, American Samoa, Marshall Islands and Greenland) and two are dropped because they are not included in the World Bank’s country income groups (Fed. States of Micronesia and State of Palestine).
Patient and public involvement statement
Patients and/or the public were not involved in the design, or conduct, or reporting, or dissemination plans of this research.
Results
Cross sectional comparison of DRs
Figure 1 shows how the Old-age and the Disability DRs differ across countries. The left panel shows the OADR in the horizontal axis and the DDR on the vertical axis for all countries with available data in the GBD database. The best-fit curve is flatter than the 45° line partly because countries on the bottom left of this distribution have a higher standardised disability prevalence than countries on the top right. However, even though there is cross-sectional evidence of the compression of morbidity29 the longitudinal evidence for this relationship is unclear; thus, countries on the bottom-left region of the distributions will not necessarily follow the exact path of countries on the top-right. In other words, as countries keep ageing and moving right over the horizontal axis, we do not know how close to the best fit line they will stay.

OADRs by country and region, 2015. Source: UN Population Prospects, Global Burden of Disease Databases and World Development Indicators.Note: OADR defined as those 65+ over those between 20 and 64. DDR defined as explained in the Methodology section. The size of the bubbles indicates the (actual or projected) number of years that took for the 60+ population to grow from 15% to 20% of the total population. The colour separates countries according to the World Bank income groups. OADR, old-age dependency ratio; DDR, disability dependency ratio; std DDR, standardised DDR using the world population. SSA, Sub Saharan Africa; MENA, Middle East and North Africa; SA, South Asia; EA&P, East Asia and Pacific; LAC, Latin America and the Caribbean; ECA, Europe and Central Asia; OECD, Organization for Economic Cooperation and Development; .
In fact, there are important differences between those countries, some of which can be observed in the size and colour of the bubbles of figure 1. The colour separates countries according to World Bank income groups while the size represents the number of years it took (or will take) for them to transition from a lower to a higher proportion of elders in the population. The image shows a clear pattern. In general, the countries on the top-right are richer and had longer periods of time to age. This means that the necessary adaptation that countries on the bottom left will need to go through, will have to be carried out much more quickly than was often the case in the past.10
Some oil producer countries escape the income ageing pattern. The bright red bubbles on the bottom left region are six rich oil producers with young populations including Bahrain, Brunei, Equatorial Guinea, Kuwait, Oman, Qatar, Saudi Arabia, Turkmenistan and United Arab Emirates. Typically, net-oil exporters are excluded from growth studies, including those focused on demographic factors.30 31 Most likely, due to a unique channel through which sustained natural resource windfalls create outliers in the ‘typical’ developmental process of a country, including the fertility-growth relationship. However, understanding this channel exceeds the purpose of this paper.
The right pane of figure 1 has a comparison of the same indicators for countries grouped in geographical regions. Consistent with Skirbekk et al, the chart reveals how the ‘ageing’ ranking changes depending on the indicator.20 Regions are ordered from left to right according to their OADR (the grey marker) in 2015. In contrast, the red marker shows their DDR in 2015. The first thing that emerges from the chart is how chronologically younger countries become older under the DDR, while chronologically older countries become younger. Furthermore, the relationship is inverted for some regions. Latin America and East Asia and Pacific are now younger than Sub-Saharan Africa, Middle East and North Africa, or South Asia.
As time goes by and all regions keep chronologically ageing, the final ranking will be determined by the evolution of disability. For the regions on the left, if disability prevalence decreases fast enough, they may end with a DDR similar to that of regions on the right. However, if their share of senior citizens keeps increasing but disability prevalence does not decline, they will end up with even higher dependency than regions on the right. This is depicted by the blue markers in the right pane of figure 1 which represent the DDR standardised using the world population.
As there is great uncertainty about the expected dynamics of disability and chronological ageing across-countries, the next section explores how ageing may unfold under different scenarios.
Projections
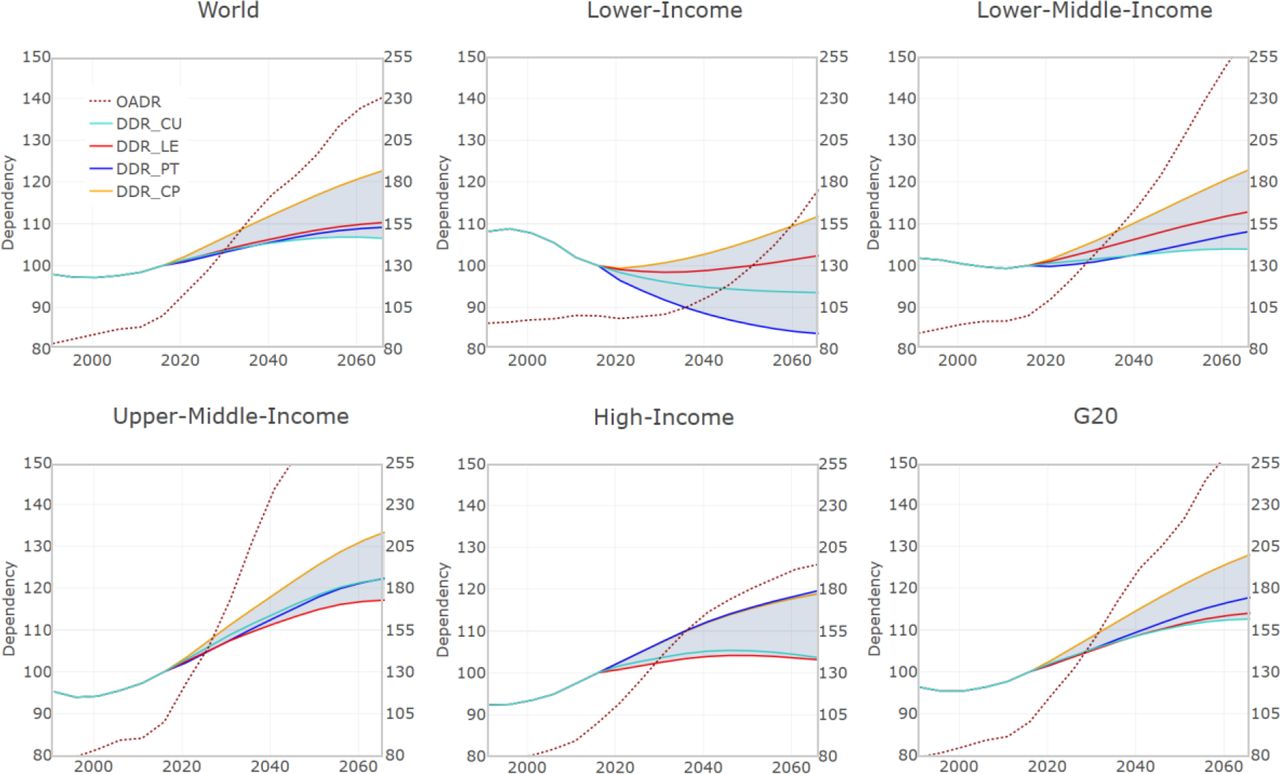
Figure 2 shows the projections of our DDR under the four scenarios described in the methodology section and the OADR (right axis) for the world and different income groups. The projections start in 2015, and all series are re-based to the same year to obtain comparable indexes (2015=100). The range of the OADR is greater than the range of the rest, hence it is plotted on the secondary axes. This issue shows how the pace of ageing greatly differs under different definitions. Furthermore, the OADR projections show an increase in dependency for most of the projection period and for all countries, while that is not the case for DDR, depending on the scenario.

OADRs by region, 2015–2065. Source: UN population prospects, global burden of disease databases and world development indicators. OADR is plotted on the right axes and defined as those aged 65+ over those between 20 and 64. DDR defined as explained in our methodology section. Series for the World include 186 countries for which there is data from all sources. The composition of the all regions is available in our online supplementary appendix. DDR, disability dependency ratio; DDR_CP, constant prevalence scenario; DDR_CU, DDR catch-up scenario; DDR_LE, DDR life expectancy; DDR_PT, DDR past-trends; OADR, old-age dependency ratio.
The area in light blue within the DDR scenarios depicts the range of expected ageing under our different projections. The variation for the world is modest but not trivial. The growth in dependency would be almost three times faster under the constant prevalence scenario (top bound of the ageing range) than under the catch-up scenario (lower bound).
The world’s top bound is consistent across regions and delineated by the constant prevalence scenario in all cases except for high-income countries where the constant prevalence and the past-trends line almost perfectly match through the whole projection. This implies that on average (and weighted by population size) disability prevalence has not changed in the historical period for high-income countries, according to GBD data.
The world’s lower bound is almost equally matched by the other three scenarios; however, the pattern is not consistent across regions. The past-trends scenario for the world is driven down by low income countries, where, in contrast with high-income countries, disability prevalence rates have been decreasing on average at a fast pace. This pattern can be appreciated in the chart for low-income countries, where the population is actually ‘getting younger’ under the past-trends scenario. Nonetheless, it is unlikely that disability prevalence rates will continue decreasing at the same pace for the whole projection period, as rates would reach zero per cent for some age groups. The prospects are also good for low-income countries under the catch-up scenario were the population is also getting younger for the whole projection.
Lower-middle-income countries show a pattern similar to that of low-income countries, although the past-trends and catch-up scenarios are inverted. Upper-middle-income countries show the most worrisome projections, with population ageing under all scenarios.
We include one panel that shows the projections for the G20 which in 2018 accounts to more than 85% of the world’s gross domestic product.32 In comparison with high-income-countries, the G20 excludes many small (by gross domestic product standards), young, oil producers but includes big medium income countries like India, China or Brazil.
Discussion
The changes that constitute and influence ageing are complex and involve many characteristics of individuals that are loosely correlated with chronological ageing. However, the most common ageing indicators are based solely on the population’s age, assuming that other characteristics such as health stay constant by age group. In contrast, some studies proposed ageing indicators where gains in health expectancy are translated into gains on other health characteristics. Nevertheless, there is no discernible pattern about the quality of life in an increasing lifespan.
Our work contributes to the development of quantitative and qualitative ageing indicators by combining health and demographic characteristics into one ageing measure. We follow the characteristics approach that allows to easily decompose our indicator into demographic and health components. Additionally, we propose several scenarios based on different explicit assumptions for the projection of health characteristics.
As in Skirbekk et al20 our results show that a multidimensional approach to ageing can significantly change the characterisation of countries around the world. Countries that rank older under conventional measures (like the OADR) may rank younger under qualitative measures. This result helps reconciling the growth-ageing contradiction.33 Additionally, like Sanderson and Scherbov22 we find that, if improvements in health continue, ageing might be less worrisome than what other non-qualitative ageing indicators like the OADR project. Nevertheless, given the lack of sustained evidence from longitudinal studies on life quality improvements at old age, caution should be taken with too optimistic projections as the ones from the DRs based on life expectancy. The variation in our projections resulting from different health assumptions is substantial which evinces the risk of making implicit assumption for health characteristics.
In comparison with other studies, extending the sample of countries allows us to generate projections for different income groups. For low-income countries we find that, even though, they will undergo a faster chronological demographic transition, if they maintain past (or even less successful) gains in health, their qualitative ageing indicator will not increase for several decades. In contrast, high-income countries show considerable ageing under the constant prevalence or past-trends scenario and upper-middle-income countries are projected to age in all scenarios.
An important issue with our projections is the absence of variation resulting from inequality within countries. Our results are based on average aggregated projections; however, health inequality within countries could add variation that we are unable to explore. Another limitation of this approach is the unidimensional and purely biomedical operationalisation of healthy ageing in our indicator, which contrasts with multidimensional theories discussed in the literature.25 26 Restricting research to only biomedical studies may bound the advancement of successful ageing conceptualisation, research and public policy. This is in part, due to the unrealistic prospect of elderly individuals ageing in perfect physical condition. Other relevant individual characteristics, including psychosocial components, could be incorporated to obtain a more comprehensive measure.11 However, the data requirements of such an approach would significantly narrow our sample of countries. Additionally, disability is one of the most common concepts used in the literature to operationalise healthy ageing.25 34
It would be interesting to explore how our results could be used to address research on ageing and productivity as in Lozano et al35 and Aiyar et al.9 These papers develop a methodology to assess how labour productivity is affected due to health deterioration as a consequence of population ageing. Our indicator could be used to assess worst-case and best-case scenarios.
Our results can also be used to compare and assess eligibility reforms in pension systems. Many pension systems have implemented increases in retirement age based on projected raises in life expectancy.36 Our indicator could be used to compare those with reforms based on projected raises in disability-free life expectancy.
Data availability statement
Data are available in a public, open access repository. All data relevant to the study are included in the article or uploaded as supplementary information.
References
Supplementary materials
Supplementary Data
This web only file has been produced by the BMJ Publishing Group from an electronic file supplied by the author(s) and has not been edited for content.
Footnotes
Handling editor Seye Abimbola
DW and AR-U contributed equally.
Contributors DW conceived the study, developed the methods, collected the data and completed all analyses. AR-U closely supervised every step providing crucial input and should be considered a first author together with DW. CB and JO provided feedback to the methods, and edited and reviewed the manuscript. All authors interpreted results and reviewed and contributed to the final draft.
Funding This work is the result of a 2018 Ignacio H. Larramendi Research Grant of Fundación MAPFRE. AR-U' work received funding from the Gillings Fellowship in Global Public Health and Autism Research, Grant Award YOG054. JO acknowledges the financial support of Spanish Ministry of Science, Innovation and Universities (formerly, Ministry of Economy and Competitiveness), Project ECO2016-76506-C4-3-R.
Competing interests None declared.
Provenance and peer review Not commissioned; externally peer reviewed.