Article Text

Abstract
Introduction Data on the association between longitudinal trajectory patterns of albuminuria and subsequent end-stage kidney disease (ESKD) and all-cause mortality in diabetic kidney disease (DKD) are sparse.
Research design and methods Drawing on nationally representative data of 329 patients with biopsy-proven DKD and an estimated glomerular filtration rate above 30 mL/min/1.73 m2 at the time of biopsy, we used joint latent class mixed models to identify different 2-year trajectory patterns of urine albumin to creatinine ratio (UACR) and assessed subsequent rates of competing events: ESKD and all-cause death.
Results A total of three trajectory groups of UACR were identified: ‘high-increasing’ group (n=254; 77.2%), ‘high-decreasing’ group (n=24; 7.3%), and ‘low-stable’ group (n=51; 15.5%). The ‘low-stable’ group had the most favorable risk profile, including the baseline UACR (median (IQR) UACR (mg/g creatinine): ‘low-stable’, 109 (50–138); ‘high-decreasing’, 906 (468–1740); ‘high-increasing’, 1380 (654–2502)), and had the least subsequent risk of ESKD and all-cause death among the groups. Although there were no differences in baseline characteristics between the ‘high-decreasing’ group and the ‘high-increasing’ group, the ‘high-decreasing’ group had better control over blood pressure, blood glucose, and total cholesterol levels during the first 2 years of follow-up, and the incidence rates of subsequent ESKD and all-cause death were lower in the ‘high-decreasing’ group compared with the ‘high-increasing’ group (incidence rate of ESKD (per 1000 person-years): 32.7 vs 77.4, p=0.014; incidence rate of all-cause death (per 1000 person-years): 0.0 vs 25.4, p=0.007).
Conclusions Dynamic changes in albuminuria are associated with subsequent ESKD and all-cause mortality in DKD. Reduction in albuminuria by improving risk profile may decrease the risk of ESKD and all-cause death.
- albuminuria
- longitudinal studies
- kidney failure
- chronic
- mortality
Data availability statement
The inspection and usage of the raw data in this study is restricted according to the ethical approval. All data relevant to the study are included in the article or uploaded as online supplemental material.
This is an open access article distributed in accordance with the Creative Commons Attribution Non Commercial (CC BY-NC 4.0) license, which permits others to distribute, remix, adapt, build upon this work non-commercially, and license their derivative works on different terms, provided the original work is properly cited, appropriate credit is given, any changes made indicated, and the use is non-commercial. See: http://creativecommons.org/licenses/by-nc/4.0/.
Statistics from Altmetric.com
Significance of this study
What is already known about this subject?
Albuminuria is the hallmark of diabetic kidney disease (DKD) and is an independent risk factor for both end-stage kidney disease (ESKD) and all-cause death.
Albuminuria often fluctuates over the long course of DKD, and therefore the one-time albuminuria-oriented risk assessment of ESKD and all-cause mortality may be changed over the course of DKD.
What are the new findings?
A total of three distinct 2-year longitudinal trajectory patterns of albuminuria that linked to rates of subsequent ESKD and all-cause death were identified: ‘high-increasing’, ‘high-decreasing’, and ‘low-stable’ patterns of albuminuria.
Subsequent rates of ESKD and death differed among patterns of longitudinal trajectory of albuminuria, even though the albuminuria levels were the same at baseline.
How might these results change the focus of research or clinical practice?
Dynamic changes in albuminuria are associated with subsequent ESKD and all-cause mortality in DKD.
Reduction in albuminuria by improving risk profile may decrease the risk of subsequent ESKD and all-cause death.
Introduction
Worldwide, diabetic kidney disease (DKD) is not just the most prevalent form of chronic kidney disease (CKD), but it is also the most leading cause of end-stage kidney disease (ESKD).1–4 DKD can also cause premature death.5 Albuminuria is known to be the hallmark of DKD and has been an independent risk factor for both ESKD and all-cause death.6–10 However, albuminuria often fluctuates over the long course of DKD, being influenced by various modifiable and non-modifiable factors.11–16 Therefore, the albuminuria-oriented risk assessment of ESKD and all-cause mortality may be changed over the course of DKD. In other words, a deep understanding of the longitudinal trajectory of albuminuria over time would allow for personalized dynamic risk assessment of ESKD and all-cause death and can provide more individualized therapy to mitigate disease progression toward ESKD and all-cause death. However, due to the lack of statistical methods and software packages until recently, previous studies focused on a single or limited number of measurements of albuminuria, ignoring the longitudinal changes of albuminuria, although repeated measurements of albuminuria are frequently available over time in clinical practice.
The joint latent class mixed model allows the simultaneous modeling of repeated measurements of biomarkers data and time-to-event data, and therefore gained popularity in recent years.17–19 Briefly, this model considers the population of subjects as heterogeneous and assumes that it consists of homogeneous latent subgroups of subjects that share the same biomarker trajectory and the same risk of the event.20 21 Therefore, this model has the advantageous applicability of uncovering latent trajectory patterns of albuminuria that link to subsequent rates of ESKD and all-cause mortality in patients with DKD.
The aim of this study was to investigate how 2-year longitudinal trajectories of albuminuria level in patients with DKD relate to subsequent ESKD and all-cause death, using joint latent class mixed models in a real-world cohort of biopsy-proven DKD.
Research design and methods
Study design and participants
We used data from a nationwide DKD study, supported by the Ministry of Health, Labour and Welfare of Japan and the Japan Agency for Medical Research and Development. The rationale and study designs are available elsewhere.22 23 In brief, the study is an observational, retrospective, kidney biopsy-based cohort study of 895 patients with type 2 diabetes aged 30–82 years who underwent clinical kidney biopsy between 1985 and 2016 at 18 hospitals across Japan. The study population had a pathological diagnosis, with DKD as the only kidney disease diagnosis. The majority of study population were under the care of each hospital or its satellite clinics every 3 months and were followed up from the date of biopsy until the earliest date of (1) ESKD (defined as initiation of hemodialysis, peritoneal dialysis, pre-emptive kidney transplantation, or death from uremia); (2) all-cause death before ESKD; or (3) censoring (censoring for loss to follow-up or administrative censoring occurring at the end of December 2019).
Since our primary focus was to determine 2-year longitudinal trajectory patterns of albuminuria and their associations with subsequent ESKD and all-cause mortality, 329 patients who had an estimated glomerular filtration rate (eGFR) above 30 mL/min/1.73 m2 at baseline and who had at least 2 years of follow-up without events of ESKD and death during this period were included in this analysis. Although the data from the study cohort are unbalanced data that include different numbers of albuminuria measurements for each patient, we used all 329 patients even if they had a few measurements of albuminuria because excluding these patients could lead to imprecise and biased estimates.24 The study flow and selection of study population are summarized in online supplemental figure 1.
Supplemental material
Measurements and definitions
Clinical characteristics, medication, and laboratory data were extracted from the medical records of each patient on each subsequent visit from the time of kidney biopsy and by the time when the study patients developed ESKD, died before ESKD, or censored. The obtained data included age, gender, body mass index (BMI), known duration of diabetes, hemoglobin A1c, eGFR (computed using the Modification of Diet in Renal Disease study equation for Japanese25), urine albumin to creatinine ratio (UACR), systolic blood pressure, diastolic blood pressure, total cholesterol, low-density lipoprotein cholesterol, high-density lipoprotein cholesterol, triglycerides, medication usage including renin-angiotensin system (RAS) blocker, glucose-lowering agent (oral hypoglycemics and/or insulin), and statin, medical history of cardiovascular disease, and history of smoking. The number of serum creatinine and UACR measurements during the 2-year follow-up period was also reported. Type 2 diabetes was defined as diabetes onset after the age of 30 years. Diabetes duration was defined as the time from the date of diabetes onset to the date of kidney biopsy.
Pathological findings were evaluated according to the Renal Pathology Society Diabetic Nephropathy Classification.26 In brief, glomerular lesions were classified as follows: (1) class I, glomerular basement thickening and only mild, non-specific changes on light microscopy; (2) class II, mild (IIa) or severe (IIb) mesangial expansion without either nodular lesions or global sclerosis in >50% of the glomeruli; (3) class III, nodular lesions without global sclerosis in >50% of the glomeruli; and (4) class IV, global sclerosis in >50% of the glomeruli. Pathological findings other than glomerulus were also evaluated as follows: interstitial lesions (interstitial fibrosis and tubular atrophy (grades 0–3) and interstitial inflammation (grades 0–2)) and vascular lesions (arteriolar hyalinosis (grades 0–2) and large vessels arteriosclerosis (grades 0–2)). These procedures were conducted by three pathologists.
The outcomes of interest were ESKD and all-cause death events. The occurrence of ESKD and the event of all-cause death were ascertained by medical records.
Statistical analysis
We used joint latent class mixed models to identify different patterns of 2-year UACR trajectory that linked to rates of subsequent two competing events: ESKD and all-cause death before ESKD. In short, joint latent class mixed models identify homogeneous latent subgroups of individuals who share similar trajectory of repeated measurements with similar risk of time-to-event outcome. Unlike conventional analysis of repeated measurements and time-to-event outcomes, this approach overcomes the issue of informative censoring at handling longitudinal data.20 21
UACR values were log-transformed prior to the analysis due to its positive skewed distribution. For capturing latent subgroups of UACR trajectory, we modeled the non-linear shape of UACR trajectory by a class-specific linear mixed effects model with linear and quadratic terms of follow-up time. We added random intercepts and slopes of linear term of follow-up time to allow for individual deviations from the mean trajectory of each subgroup. We tested models with subgroups ranging from 2 to 5, and we selected the final model based on a combination of Bayesian information criterion (BIC), mean posterior class membership probabilities, relative entropy, sample size of each class, and clinical interpretability of resulting classes. We assigned patients to a class based on the highest probability of class membership.
Clinical characteristics at the time of biopsy among subgroups of UACR trajectory were compared using analysis of variance or Kruskal-Wallis test for continuous variables and χ2 statistics for categorical variables.
Because ESKD and all-cause death were considered competing events in this study, we used the cumulative incidence method to examine the observed event probabilities of each among the subgroups of UACR trajectories. We used subdistribution hazard models proposed by Fine and Gray27 to handle competing risk and adjust for all demographic and comorbid conditions and explore the association of 2-year UACR trajectories with subsequent events of ESKD or all-cause death before ESKD.
In additional analyses, we compared the baseline characteristics and incident rates of ESKD and all-cause death between identified UACR trajectory groups who had high UACR levels at baseline. In addition, the association between trajectory patterns of UACR and 40% decline in eGFR over 2 years was analyzed, since a series of studies revealed that 30%–40% decline in eGFR over 2–3 years was strongly associated with subsequent risk of ESKD and death.28
For descriptive analysis, we used Stata V.15.1, and for joint latent class analysis we used the ‘Jointlcmm’ function from the R package ‘lcmm’ in the statistical software R V.3.6.1 (R Foundation for Statistical Computing, Vienna, Austria). All statistical tests were two-sided, and we considered p values less than 0.05 to be statistically significant.
Results
Characteristics and trajectory patterns of albuminuria
We selected the model with three latent classes based on the lowest BIC. Also, this model had the mean posterior class membership probabilities ranging between 0.79 and 0.84 and the highest relative entropy among models with different numbers of classes, suggesting that this model provided better discrimination. The estimation and comparison of the models for a varying number of latent classes are summarized in online supplemental table 1.
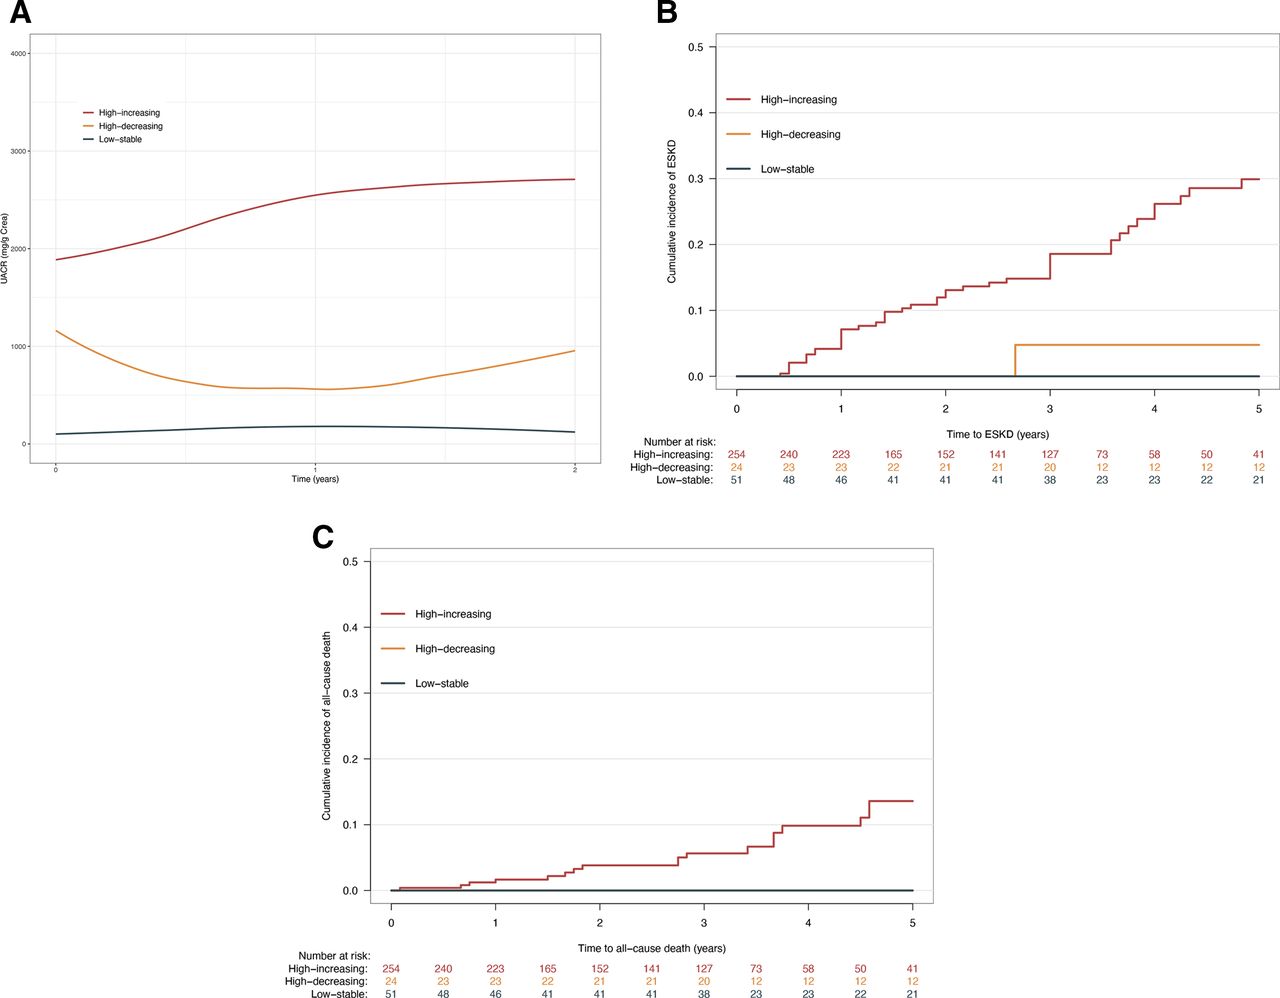
We drew the mean UACR trajectories of each class based on class membership allocation by the mean posterior class membership probabilities (figure 1A). Class 1 contained the majority of patients (n=254; 77.2%) and was characterized by ‘high-increasing’ albuminuria during the 2 years of follow-up. Class 2 contained 24 patients (7.3%) and was characterized by ‘high-decreasing’ albuminuria during the 2 years of follow-up. Class 3 contained 51 patients (15.5%) and was characterized by ‘low-stable’ albuminuria during the 2 years of follow-up.

Trajectories of albuminuria and rates of ESKD and all-cause death. (A) Trajectories of UACR over 2 years of follow-up based on class membership allocation by the mean posterior class membership probabilities. (B) Cumulative incidence of ESKD stratified by class membership allocation by the mean posterior class membership probabilities. (C) Cumulative incidence of all-cause death before ESKD stratified by class membership allocation by the mean posterior class membership probabilities. ESKD, end-stage kidney disease; UACR, urine albumin to creatinine ratio.
Table 1 shows the baseline characteristics of patients, overall and stratified by the trajectory patterns of UACR. The characteristics of the overall cohort were as follows: median (IQR) age 60 (50–67) years old, 71.7% men, known duration of diabetes 13 (9–20) years, BMI 23.6 (21.6–25.8), systolic blood pressure 140 (128–154) mm Hg, diastolic blood pressure 77 (69–90) mm Hg, hemoglobin A1c 7.3% (6.4%–8.9%) or 56.3 (46.4–73.8) mmol/mol, total cholesterol 202 (169–240) mg/dL, eGFR 53.7 (35.3–66.0) mL/min/1.73 m2, and UACR 1078 (408–2148) mg/g creatinine. Approximately two-thirds of the study population were on RAS blocker. When comparing baseline characteristics by the trajectory patterns of UACR, the ‘low-stable’ group had fewer risk factors associated with ESKD and all-cause death compared with the other groups: patients in the ‘low-stable’ group were more likely to be younger, were more likely to have lower BMI, shorter diabetes duration, higher eGFR, lower UACR, and better blood pressure and cholesterol levels. Additionally, use of RAS blocker, glucose-lowering medication and lipid-lowering medication was lower in this group. Also, the percentage of ever having smoked and history of cardiovascular disease were more likely to be lowest in the ‘low-stable’ group among other groups.
Baseline characteristics of the study population, overall and stratified by the trajectory patterns of UACR
Next, we drew the mean 2-year trajectories of systolic blood pressure, diastolic blood pressure, total cholesterol, hemoglobin A1c, and BMI to see the difference in these parameters during the 2 years of follow-up among groups (online supplemental figure 2A–E). The ‘low-stable’ group had the lowest levels of systolic and diastolic blood pressure, which remained low throughout the first 2 years of follow-up. Between the ‘high-increasing’ group and the ‘high-decreasing’ group, it appeared that the ‘high-decreasing’ group had better control over blood pressure and total cholesterol levels during this period.
Trajectory patterns of albuminuria and rates of ESKD and death
During the median (IQR) follow-up duration of 3.0 (1.5–4.5) years after 2 years of trajectory determination period, 73 (22.2%) developed ESKD, 23 (7.0%) died before ESKD, and 233 (70.8%) were censored. The cumulative incidence of ESKD and all-cause mortality before ESKD is shown in figure 1B,C. The cumulative incidence of ESKD increased in the order of the low-stable’ group, ‘high-decreasing’ group, and the ‘high-increasing’ group. On the other hand, the cumulative incidence of all-cause death was highest in the ‘high-increasing’ group, but there seemed to be no difference between the ‘high-decreasing’ group and the ‘low-stable’ group.
Table 2 presents the subdistribution HR and 95% CI for the association between the trajectory patterns and incident ESKD and all-cause death. Compared with the reference group (‘low-stable’ group), the unadjusted subdistribution HR (95% CI) of ESKD was 5.77 (2.57 to 7.58) for the ‘high-decreasing’ group and 10.61 (4.47 to 14.38) for the ‘high-increasing’ group, respectively. After adjusting for demographic and laboratory characteristics at baseline, the subdistribution HR of ESKD for the ‘high-decreasing’ group and the ‘high-increasing’ group remained significant with the same order, compared with the ‘low-stable’ group. On the other hand, the subdistribution HR of all-cause death was highest in the ‘high-increasing’ group among groups in both univariable and multivariable regression, but there was no difference between the ‘high-decreasing’ group and the ‘low-stable’ group.
SHR and 95% CI of the UACR trajectory groups for incident ESKD and all-cause death
Subgroup analyses
Comparison of baseline characteristics and crude incidence rates of ESKD and all-cause death between the ‘high-increasing’ group and the ‘high-decreasing’ group
The ‘low-stable’ group apparently had the most favorable risk profile, which may not be considered as a reference group, so we made comparative analysis between the ‘high-decreasing’ group and the ‘high-increasing’ group. There were no differences in most baseline characteristics between the ‘high-decreasing’ group and the ‘high-increasing’ group (online supplemental table 2). However, the crude incidence rates of ESKD and all-cause death were lower in the ‘high-decreasing’ group compared with the ‘high-decreasing’ group (table 3).
Crude incidence rates of ESKD and all-cause death by ‘high-increasing’ group and ‘high-decreasing’ group
Trajectory patterns of albuminuria and rates of 40% decline in eGFR
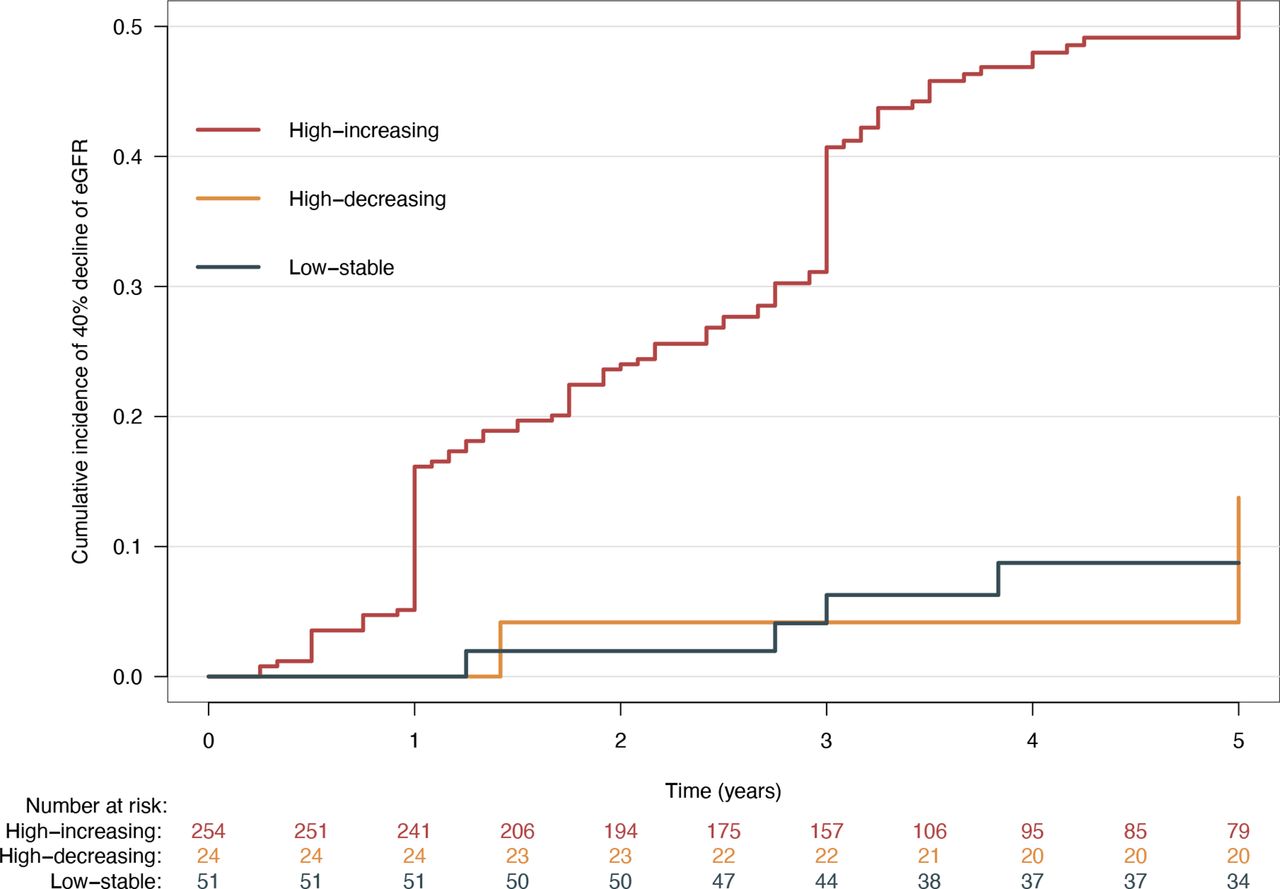
During the median (IQR) follow-up duration of 2.5 (0.5–4.0) years, 159 (48.3%) developed 40% decline in eGFR and 170 (51.7%) were censored. The cumulative incidence of 40% decline in eGFR increased in the order of the low-stable’ group, ‘high-decreasing’ group, and the ‘high-increasing’ group (figure 2). The HR of 40% decline in eGFR increased in the order of the low-stable’ group, ‘high-decreasing’ group, and the ‘high-increasing’ group in univariable and multivariable analyses (online supplemental table 3).

Cumulative incidence of 40% decline in eGFR by the trajectory patterns of UACR. eGFR stratified by class membership allocation by the mean posterior class membership probabilities. eGFR, estimated glomerular filtration rate; UACR, urine albumin to creatinine ratio.
Conclusions
Drawing on nationally representative data of patients with biopsy-based DKD, we identified three distinct 2-year longitudinal trajectory patterns of albuminuria that linked to rates of subsequent two competing events: ESKD and all-cause death before ESKD. The group with the 2-year trajectory pattern with ‘high-increasing’ albuminuria had the highest rates of ESKD and all-cause death, and the group with the 2-year trajectory pattern of ‘low-stable’ albuminuria had virtually no risk of ESKD and all-cause death in subsequent 5 years. Meanwhile, relative risk reduction of ESKD and all-cause death was seen in the group with the trajectory pattern of ‘high-decreasing’ albuminuria, compared with the group with ‘high-increasing’ albuminuria, even though the baseline characteristics were similar at baseline.
Albuminuria is a biomarker of endothelial and microvascular dysfunction29 30 and has been reported to be associated with ESKD and all-cause mortality in patients with diabetes.6–10 Therefore, it has been widely measured in clinical practice for facilitating decision making in patients with DKD. However, albuminuria often fluctuates over the long course of DKD, with modifiable and non-modifiable factors.11–16 For example, in a study from Japan that observed the natural history of patients with type 2 diabetes and microalbuminuria, 28% of patients with microalbuminuria progressed to macroalbuminuria, whereas 51% of patients with microalbuminuria regressed to normoalbuminuria during 6 years of follow-up.14 Similarly, in the Steno-2 study from Denmark that observed the course of patients with DKD who were assigned to multifactorial treatment or conventional treatment, 31% of patients with microalbuminuria progressed to macroalbuminuria, whereas 30% of patients with microalbuminuria regressed to normoalbuminuria during 7.8 years of follow-up.15 Moreover, a meta-analysis of 28 cohorts including 693 816 patients (80% with diabetes) and 7461 ESKD events has shown that change in albuminuria over 2 years was associated with subsequent risk of ESKD.16 These findings suggest that a single albuminuria measurement-driven risk assessment of ESKD and all-cause mortality is likely to be oversimplification and thus may not provide optimal support for dynamic risk assessment. Indeed, we observed that subsequent rates of ESKD and all-cause death differ among 2-year longitudinal trajectory patterns of UACR in patients with biopsy-proven DKD. Our methodology automatically clustered longitudinal trajectory patterns of albuminuria that linked to ESKD and all-cause death, which may allow for personalized dynamic risk assessment of ESKD and all-cause death and can provide more individualized therapy to mitigate the disease progression toward ESKD and all-cause death.
We observed relative risk reduction of ESKD and all-cause death in patients with a ‘high-decreasing’ trajectory compared with patients with a ‘high-increasing’ trajectory, although the baseline characteristics of these patients were very similar, especially with respect to blood pressure and the percentage of use of RAS blocker. Thus, we additionally drew the mean 2-year trajectories of time-varying parameters such as systolic blood pressure, diastolic blood pressure, total cholesterol, hemoglobin A1c, and BMI and calculated the percentage of the use of RAS blocker at 2 years of follow-up, to see the difference in these parameters during the 2 years of follow-up among groups. We found that even though the percentage of use of RAS blocker remained the same, it seems that the ‘high-decreasing’ group had better control over blood pressure during this period. This finding is compatible with a meta-analysis that concludes that the achieved blood pressure, rather than a specific drug or drug class use, is the primary determinant of renal benefit.31 Even though the ‘high-decreasing’ group demonstrated reduction in albuminuria compared with the ‘high-increasing’ group, the achieved level of albuminuria was not good as that of the ‘low-stable’ group. This may be due to the fact that other metabolic risk profiles remained above the recommended target provided by the American Diabetes Association’s guideline.32 We believe that achieving the recommended goal for all metabolic profile reduces albuminuria and also the residual risk of ESKD and all-cause death.
Recently, growing evidence suggests that a substantial proportion of patients with type 2 diabetes have a renal function loss without macroalbuminuria, or have a renal function loss even without microalbuminuria, and these phenotypes of DKD are called ‘non-proteinuric DKD’ or ‘non-albuminuric DKD’.33–40 Although it is unclear whether an increase in the number of patients with these phenotypes of DKD may be due to an increase of elderly patients with diabetes, or an increase of multidisciplinary renoprotective treatment in general use, previous studies showed that they have a slow rate of renal function loss.22 41 42 However, this finding was based on a single measurement of ‘baseline UACR’, and data on whether patients with DKD develop ESKD without ever developing microalbuminuria or macroalbuminuria are sparse. Only a study from the Steno Diabetes Center reported that nearly 20% of patients with DKD developed ESKD without ever developing macroalbuminuria, suggesting that developing macroalbuminuria may not be a prerequisite for ESKD.42 However, contrary to the Steno’s findings, we observed that none of our patients with a 2-year trajectory of ‘low-stable’ developed ESKD in the following 5 years. This may be due to differences in the study population. The study population in our study comprised biopsy-proven DKD, while that of the Steno Diabetes Center included patients with clinically diagnosed DKD, which possibly included other interstitial dominant renal disease, such as interstitial nephritis, superimposed on DKD. Analysis of the natural history of DKD will probably unveil this issue.
This study has several strengths. The study population is from a real-world cohort of DKD with a long follow-up time, which allows us to observe longitudinal trajectories of UACR and hard outcome events rich enough. Instead of using traditional models that assume the albuminuria level is stable over the course of DKD, we applied joint latent class mixed models which allow us to identify non-linear or even more flexible patterns of UACR trajectory that linked to the rates of ESKD and competing all-cause death, which is hard to detect by human eyes.
We acknowledge that our study has limitations. First, because of the nature of retrospective studies, we cannot conclude the causation between trajectory patterns of albuminuria, and ESKD and all-cause death. For example, we cannot assure that changing the shape of UACR trajectory by lowering albuminuria levels reduces the rates of ESKD and all-cause death, even though we found a strong association between longitudinal albuminuria levels and the rates of ESKD and all-cause death. Second, there may be a selection bias in the study population. The majority of patients with diabetes and CKD do not undergo kidney biopsy since they are presumed to have DKD based on clinical history and laboratory data. Therefore, there may be a selection bias in our study because the study population may have been biopsied because they were suspected of having any kind of kidney disease rather than DKD. Accordingly, our findings may not apply to the general population of DKD. Third, the study population comprised Asian, mostly Japanese patients, and our findings may not apply to populations from different geographical origins. Fourth, the measurement of urinary albumin excretion in our study was determined by measurement of UACR, although the 24-hour urine collection is the gold standard for measurement of albuminuria. However, previous studies have shown that the UACR value demonstrated the non-inferiority of predictive capability for renal disease progression.43 Moreover, it is unrealistic in clinical practice to measure 24-hour urine collection at each visit. Fifth, the number per group, especially the number of the ‘low-stable’ group, was small; thus, our findings may not apply to the general population of DKD. Sixth, a substantial proportion of patients were excluded due to the occurrence of events or censoring within the first 2 years. Therefore, we have performed a comparative analysis of baseline characteristics between the current study group (n=329) and the excluded group (n=300) (online supplemental table 4). However, there were no differences in clinical characteristics except for gender ratio. We believe that the current study was conducted in a less biased cohort.
In conclusion, in this analysis of a real-world cohort of biopsy-proven DKD, we identified three different patterns of 2-year longitudinal UACR trajectory that linked to the rates of ESKD and competing all-cause death. Subsequent rates of these adverse outcomes differed among patterns of longitudinal UACR trajectory, even though the UACR levels were the same at baseline. These findings may allow for personalized dynamic risk assessment of ESKD and all-cause death and can provide more individualized therapy to mitigate disease progression toward ESKD and all-cause death.
Data availability statement
The inspection and usage of the raw data in this study is restricted according to the ethical approval. All data relevant to the study are included in the article or uploaded as online supplemental material.
Ethics statements
Ethics approval
This study was approved by the institutional review board of the Toranomon Hospital (approval no. 2082-H) and conducted in accordance with the Declaration of Helsinki.
Acknowledgments
The authors thank various people for their contribution to this project: Dr Sam Brilleman, Public Health and Preventive Medicine, Monash University, Melbourne, Australia, for his valuable statistical support on this project; Dr Yoko Yoshida and Ms Yuki Inoue, The Institute for Adult Disease, Asahi Life Foundation, and Ms Yurina Takaishi, Ms Keiko Sahara, and Ms Tokiko Hoshikawa, Toranomon Hospital, for their help in collecting the data.
References
Supplementary materials
Supplementary Data
This web only file has been produced by the BMJ Publishing Group from an electronic file supplied by the author(s) and has not been edited for content.
Footnotes
Contributors MY, KF, JH, and TW designed the study protocol, researched the data, contributed to the discussion, wrote the manuscript, and reviewed and edited the manuscript. TT, MS, YYa, MO, SK, AH, YI, NSak, YO, ShM, DI, HMi, TS, NSaw, YYu, HK, YSu, HS, NU, YUe, SN, HY, TN, KS, KK, YSh, HMa, SeM, and YUb contributed to the discussion and reviewed the manuscript. TW is the guarantor of this work and as such had full access to all the data in the study and takes responsibility for the integrity of the data and the accuracy of the data analysis.
Funding This study was supported in part by the Ministry of Health, Labour and Welfare Grant-in-Aid for Diabetic Nephropathy and Nephrosclerosis Research (JP17ek0310003) and a grant for medical research from the Okinaka Memorial Institute for Medical Research, Tokyo, Japan (20201-18).
Competing interests None declared.
Provenance and peer review Not commissioned; externally peer reviewed.
Supplemental material This content has been supplied by the author(s). It has not been vetted by BMJ Publishing Group Limited (BMJ) and may not have been peer-reviewed. Any opinions or recommendations discussed are solely those of the author(s) and are not endorsed by BMJ. BMJ disclaims all liability and responsibility arising from any reliance placed on the content. Where the content includes any translated material, BMJ does not warrant the accuracy and reliability of the translations (including but not limited to local regulations, clinical guidelines, terminology, drug names and drug dosages), and is not responsible for any error and/or omissions arising from translation and adaptation or otherwise.