Article Text

Abstract
Objectives (1) To develop reference values for health-related fitness in European children and adolescents aged 6–18 years that are the foundation for the web-based, open-access and multilanguage fitness platform (FitBack); (2) to provide comparisons across European countries.
Methods This study builds on a previous large fitness reference study in European youth by (1) widening the age demographic, (2) identifying the most recent and representative country-level data and (3) including national data from existing fitness surveillance and monitoring systems. We used the Assessing Levels of PHysical Activity and fitness at population level (ALPHA) test battery as it comprises tests with the highest test–retest reliability, criterion/construct validity and health-related predictive validity: the 20 m shuttle run (cardiorespiratory fitness); handgrip strength and standing long jump (muscular strength); and body height, body mass, body mass index and waist circumference (anthropometry). Percentile values were obtained using the generalised additive models for location, scale and shape method.
Results A total of 7 966 693 test results from 34 countries (106 datasets) were used to develop sex-specific and age-specific percentile values. In addition, country-level rankings based on mean percentiles are provided for each fitness test, as well as an overall fitness ranking. Finally, an interactive fitness platform, including individual and group reporting and European fitness maps, is provided and freely available online (www.fitbackeurope.eu).
Conclusion This study discusses the major implications of fitness assessment in youth from health, educational and sport perspectives, and how the FitBack reference values and interactive web-based platform contribute to it. Fitness testing can be conducted in school and/or sport settings, and the interpreted results be integrated in the healthcare systems across Europe.
- physical fitness
- physical endurance
Data availability statement
Data may be obtained from a third party and are not publicly available. This article includes data from more than 100 datasets. Data sharing permission should be requested to the researchers of each individual dataset. References for each dataset can be found in online supplemental table 1.
This is an open access article distributed in accordance with the Creative Commons Attribution Non Commercial (CC BY-NC 4.0) license, which permits others to distribute, remix, adapt, build upon this work non-commercially, and license their derivative works on different terms, provided the original work is properly cited, appropriate credit is given, any changes made indicated, and the use is non-commercial. See: http://creativecommons.org/licenses/by-nc/4.0/.
Statistics from Altmetric.com
WHAT IS ALREADY KNOWN ON THIS TOPIC
Fitness testing in youth is important from health, educational and sport points of view.
The European Union-funded ALPHA project reviewed the existing evidence and proposed a selection of field-based fitness tests that showed the highest test–retest reliability, criterion/construct validity and health-related predictive validity among available tests.
WHAT THIS STUDY ADDS
The FitBack project provides the most up-to-date and geographically diverse reference fitness values for Europeans 6–18 years of age.
This study introduces the first web-based, open-access and multilingual fitness reporting platform (FitBack) providing interactive information and visual mapping of the European fitness landscape.
HOW THIS STUDY MIGHT AFFECT RESEARCH, PRACTICE OR POLICY
From a health perspective, very low fitness levels are a non-invasive indicator of poor health at both individual and group levels (eg, school and region), which have utility for health screening and may guide public health policy. There are already examples of regional and national fitness testing systems that are integrated into healthcare systems.
From an educational perspective, fitness testing is part of the school curriculum in many countries, and the FitBack platform offers physical education teachers an easy-to-use tool for interpreting fitness test results by sex and age.
From a sport perspective, these reference values can help identify young individuals who are talented in specific fitness components.
Introduction
Robust and consistent evidence supports that physical fitness is a powerful marker of health in children and adolescents.1 2 Among the different fitness components, cardiorespiratory fitness (CRF, used in the literature and this article interchangeably with aerobic fitness) and muscular strength (used in the literature and this article interchangeably with muscular fitness) have shown the strongest and most consistent health-related associations and are therefore considered to be the main health-related fitness components.3 4 Other fitness components include flexibility, motor fitness and body composition/anthropometry (height, body mass, body mass index (BMI) and waist circumference). Recently, data from large registries have added compelling evidence linking both CRF and muscular strength in late adolescence with all-cause mortality and cardiovascular-specific and cancer-specific mortality in later life.5–8 In addition, these two fitness components predict severe, chronic and irreversible all-cause disease 30 years later as indicated by granted disability pensions,9–12 and also specifically cardiovascular, musculoskeletal, neurological and psychiatric diseases granted by a disability pension.9–12 Particularly, CRF is the most well-studied and strongest predictor of future health.2 Indeed, a position stand from the American Heart Association has highlighted the clinical value of CRF in youth and recommended that it be regularly assessed.13 In addition to the well-documented associations between fitness and physical/mental health among youth,1–4 14 emerging evidence supports that better fitness is related to better cognition, academic performance, and healthier structural and functional brain outcomes.15–29 For example, recent observations from the ActiveBrains project have shown that total brain size, as well as total grey and white matter volumes, is larger in fit compared with unfit children with overweight/obesity.30 This is important because total brain size is positively associated with intelligence.31 These findings are in line with those from Chaddock and colleagues, who included children also with normal weight, and found that fitter kids had larger grey matter volumes in subcortical brain regions such as hippocampus17 and dorsal stratium.19
The evidence hereby presented about fitness as a powerful marker of health in youth supports the relevance of fitness assessment at the individual and population levels. However, the availability of different fitness batteries/tests leads to a lack of consistency and comparability across studies. To address this problem, the European Commission funded the ALPHA project. By conducting a set of systematic reviews2 32 33 and methodological papers, the ALPHA consortium aimed to identify the field-based fitness tests that demonstrated the highest test–retest reliability, criterion/construct validity and health-related predictive validity (see ALPHA summary article34). Anthropometry and body composition are known to be tightly linked to fitness performance and health and were therefore considered as fitness components in the ALPHA project. The final output of the project was the ALPHA-fitness test battery for children and adolescents, which in its high-priority version (a shorter, more suitable version for school-based use) recommended using: the 20 m shuttle run test for assessing CRF; the handgrip and standing long jump tests for assessing muscular strength and power; and BMI and waist circumference as indicators of total and central obesity, respectively. A year later and after following a similar systematic review process, the US Institute of Medicine (now the National Academy of Medicine) recommended these same tests for the assessment of youth physical fitness,35 36 strengthening the recommendation of using the ALPHA fitness test battery.
As the next step to the ALPHA project, the European Commission funded the FitBack consortium (www.fitbackeurope.eu), representing the European Network for the Support of Development of Systems for Monitoring Physical Fitness of Children and Adolescents. The major goal of the network is to take an important step toward the implementation of fitness surveillance and monitoring across Europe as an educational tool for physical literacy.37 The final output of the FitBack project has been the development of a web-based, open-access and multilanguage fitness platform which allows the results of fitness testing to be automatically and interactively interpreted based on sex-specific and age-specific reference values and is supported by user-friendly visual feedback and tips for improvement. For this purpose, we gathered available fitness data on European children and adolescents. Previous fitness reference values published were mostly from individual countries (see references in online supplemental table 1) or multicentre EU projects (eg, IDEFICS - Identification and prevention of Dietary- and lifestyle-induced health EFfects in Children and infantS - and HELENA - Healthy Lifestyle in Europe by Nutrition in Adolescence - projects38 39) collecting data in one to two cities per country. The study by Tomkinson and colleagues provided the first European reference values that included numerous countries and covered a wide age demographic (subjects 9–17 years old).40 However, until now, European reference values have not covered all school-age children (primary, secondary and high school) from age 6 years to 18 years. Also, the writing group was aware of nationally representative fitness monitoring systems and large datasets not included in Tomkinson’s study, indicating the need to update existing reference values. There was also a pressing need to develop an automated, freely accessible web platform containing these normative values to facilitate the interpretation of sex-specific and age-specific fitness test results.
Supplemental material
The aim of this article is to develop health-related fitness reference values for European children and adolescents aged 6–18 years. Additionally, we provide European fitness maps and country ranking for the main health-related fitness components, all together as part the new, free-access, FitBack web platform (www.fitbackeurope.eu). Since paediatric obesity is being comprehensively monitored by other organisations (eg, World Obesity Federation, www.worldobesity.org/; WHO-Europe www.euro.who.int/en/health-topics/disease-prevention/nutrition/activities/who-european-childhood-obesity-surveillance-initiative-cosi), the focus of this article is mainly on CRF and muscular strength. Nonetheless, we also provide reference values and European maps for anthropometric measures (body height, body mass, BMI and waist circumference) as online supplemental material.
Methods
Data search and pooling
A systematic review of existing datasets including fitness tests in children and adolescents was previously performed by Tomkinson et al and details of the search have been published.40 These data were included in the FitBack dataset, with Monte Carlo simulation used to produce pseudo data (from reported means and SDs) when raw data were unavailable. In addition to this, the authors of the FitBack network conducted a centralised narrative search based on fitness terms to identify new datasets not included in the Tomkinson et al review.40 For inclusion, valid data on sex, age and at least one of the ALPHA fitness tests (high-priority version) was required. In the previous study by Tomkinson et al, the age range was 9–17 year old, whereas in this study, we widened the age demographic to include subjects aged 6–18 years old. It is important to note that our search strategy was focused on fitness, and specific searches on adiposity, BMI or waist circumference were not conducted for pragmatic reasons (eg, the very large number of studies including these key words). Therefore, it is possible that we missed relevant anthropometry-specific datasets. This, together with the fact that other organisations are comprehensively monitoring paediatric obesity, is the reason why we primarily focused on CRF and muscular strength, and reported results for anthropometric measures (body height, body mass, BMI and waist circumference) as online supplemental material.
The FitBack network involved numerous experienced researchers working in paediatric fitness across Europe, which helped to identify unpublished fitness datasets that were pooled with gathered data. Moreover, large datasets from existing surveillance systems in Europe such as SLOfit,41 NETFIT42 and Fitescola43 were also included. Further, we excluded older datasets if a more recent and more representative dataset was available for certain countries. The ambition was to use the most recent available data for each country, which in some cases was a single large dataset, while in others was the accumulation of several studies or datasets covering different geographical regions within a country. Sources used for generating the reference values are available on the FitBack website (www.fitbackeurope.eu/en-us/fitness-map/sources) as well as in online supplemental table 1.
Physical fitness measures
The FitBack dataset was compiled for studies that used the ALPHA fitness test battery2 32–34 since these tests have shown to be feasible, reliable, valid, and scalable for children and adolescents. Moreover, some of them are used in well-established European national fitness surveillance and monitoring systems like SLOfit,41 NETFIT42 and Fitescola.43 Specifically, CRF was assessed using the 20 m shuttle run test.44 The number of completed stages was used as an indicator of CRF. However, different studies had expressed the result of the 20 m shuttle run test in other units, such as completed laps (shuttles) or speed at the last completed stage, and there are at least three known protocols/versions of this test.45 All data were converted and harmonised into completed stages according to the original Léger protocol,44 as described elsewhere.45 Muscular strength was assessed by the handgrip strength (ie, upper-limb muscular strength) and standing long jump tests (ie, lower-limb muscular strength). Total and abdominal adiposities were assessed by BMI and waist circumference, respectively, following standardised procedures. For handgrip, most studies collected data from both hands, with the average of the best performance from both hands used in our analyses. Two studies had handgrip strength data only for the dominant hand, which is known to be systematically higher compared with the non-dominant hand. Exploratory analyses on Spanish data in children46 showed a 0.6 kg mean difference between hands, and thus, we applied a –0.3 kg correction factor to these two studies to estimate the average score.
Statistical analysis
We applied different cleansing procedures to the data. First, data were trimmed to remove values outside the probable lower and upper limits. The limits were defined based on authors’ experiences working with previous large datasets. The limits used were 20 m shuttle run (0–21 stages), handgrip strength (0–80 kg), standing long jump (15–330 cm), body height (80–220 cm), body mass (0–200 kg), BMI (7–60 kg/m2) and waist circumference (40–130 cm). Second, outliers were identified and removed as follows. For each fitness measure, herein referred to as the test, a multivariate regression model including the test as the dependent variable and age (modelled as a cubic spline with 5 degrees of freedom (df)), sex and their interaction as independent variables was fitted. Studentised residuals were obtained, and then 0.01% of the subjects with the smallest and largest studentised residuals were removed from further analysis. Weights were computed via iterative poststratification (aka iterative proportional fitting)47 to match the sample joint distributions by age, sex and country to population data. Country-specific population values were obtained from EUROSTAT. The sample weights were trimmed to avoid excessively large sampling variances.47
Percentile curves and reference values were developed using generalised additive models for location, scale and shape (GAMLSS).48 Several continuous (Box-Cox Cole and Green (BCCG), Box-Cox power exponential (BCPE), Box-Cox-t (BCT), generalised inverse Gaussian) distributions were fitted to the data, optimising the df for P-splines fit for all parameters of the respective distributions using Schwarz Bayesian criterion (SBC); appropriate link functions were used for the parameters. BCCG is routinely used in the lambda mu sigma (LMS) method.49 BCPE and BCT are extensions of LMS adding an extra parameter,
ν
, to allow modelling (positive or negative) kurtosis (with  BCPE and BCCG (LMS) coincide). In all the models,
  and
and  were used for the power transformation of age. Separate analyses were performed for boys and girls. The final model for each test and sex was determined by using SBC. The analysis was performed using R language for statistical computing (R V.3.6.3)50; GAMLSS were fitted using R package GAMLSS51; poststratification weights were obtained using R package survey.51 The best fitting model for each test is presented in online supplemental table 2.
Results
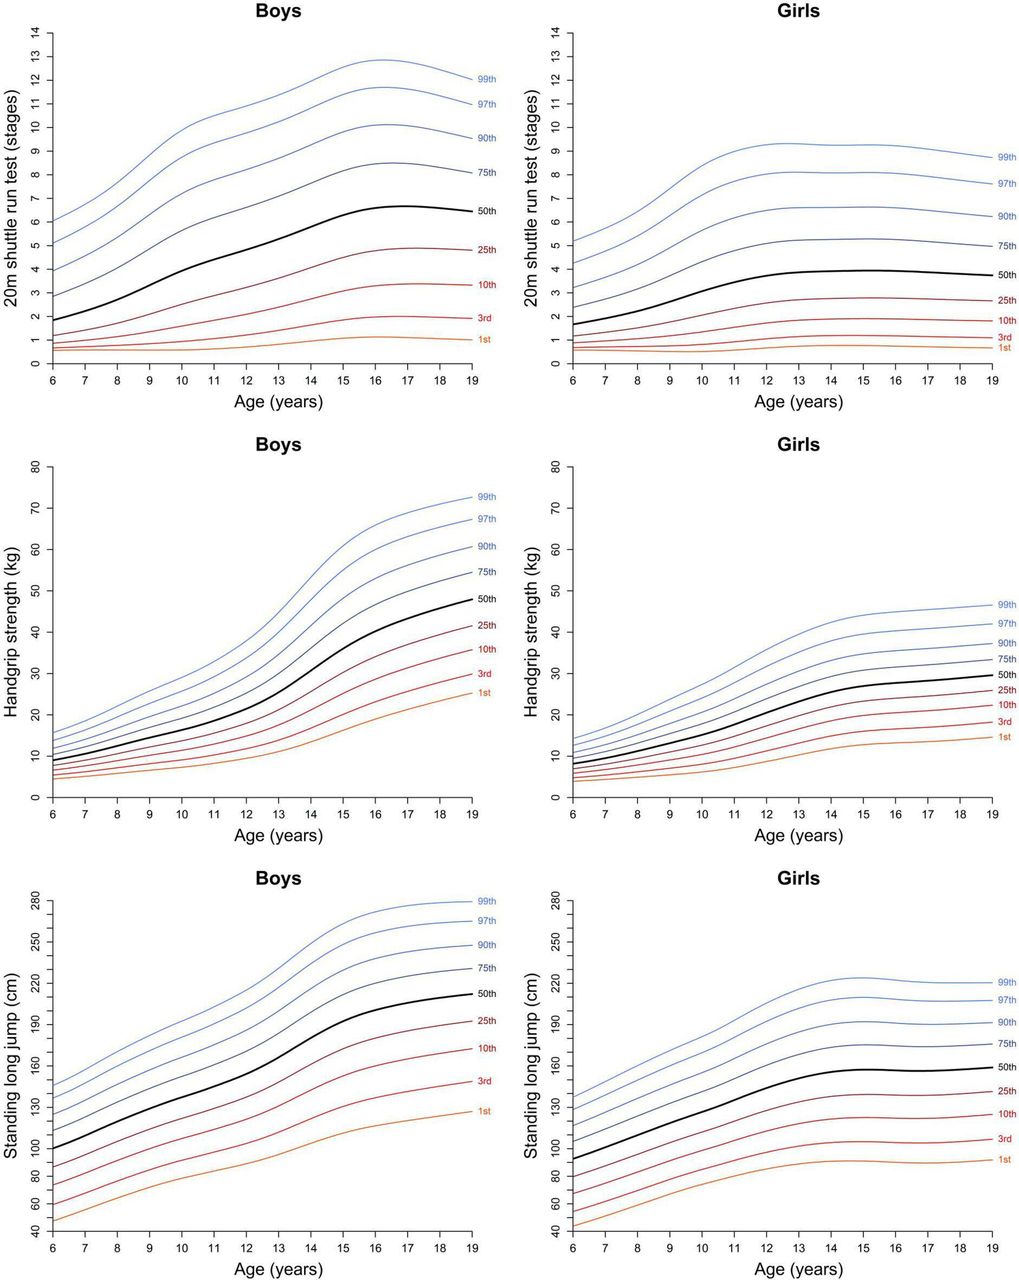
After cleaning and removing outliers, 7 966 693 test results were available, including 1 026 077 for the 20 m shuttle run; 787 966 for handgrip strength, 1 345 159 for standing long jump, 1 466 821 for body height, 1 466 295 for body mass, 1 464 795 for BMI, and 409 580 for waist circumference. These data came from 106 datasets belonging to 34 European countries, on children and adolescents aged 6 to 18 years. We originally aimed to collect data as recent as possible to obtain up-to-date reference values, preferably since 2000. Most (69%) datasets (representing 95% of all test results) were collected post-2000; however, pre-2000 data were included when post-2000 were unavailable at the country level. Using these data, we developed CRF and muscular strength reference values (tables 1–3) and corresponding percentile curves (figure 1). Reference values for body height, body mass, BMI and waist circumference are presented in online supplemental tables 3-6 and online supplemental figures 1 and 2. Percentile curves for CRF and muscular strength are higher for boys compared with girls across all ages, with differences increasing with age. The age-related increase in fitness performance tends to stabilise from age 14 years to 15 years onwards. Variation between the fittest (eg, percentiles 90–99) and least fit (eg, percentiles 1–10) is larger for boys compared with girls, particularly for the 20 m shuttle run and handgrip strength tests.

Percentile curves for cardiorespiratory and muscular strength tests among European children and adolescents. Smoothed percentiles were calculated using the generalised additive model for location, scale and shape method, and weights were applied according to country population. Data sources are available online (https://www.fitbackeurope.eu/en-us/fitness-map/sources) and in online supplemental table 1.
Reference values (percentiles) for cardiorespiratory fitness as assessed by the 20 m shuttle run test (expressed in completed stages as a decimal) in European children and adolescents (N=1 026 077)
Reference values (percentiles) for muscular strength as assessed by the handgrip strength test (expressed in kg, average of the maxima for both hands) in European children and adolescents (N=787 966)
Reference values (percentiles) for muscular strength as assessed by the standing long jump test (expressed in cm) in European children and adolescents (N=1 345 159)
Mean country-level percentiles and rankings are shown in table 4. Country-level rankings based on mean percentiles are provided for each fitness test, as well as an average estimate for each fitness component (CRF, muscular strength) and the overall European fitness ranking. The top 5 most aerobically fit countries were Iceland, Norway, Slovenia, Denmark and Finland, and the top 5 physically strong countries were Denmark, Czech Republic, The Netherlands (only one muscular strength test available), Slovenia and Finland. Online supplemental tables 7 and 8 show the corresponding country-level mean percentile and ranking positions for body height, body mass, BMI and waist circumference.
Mean percentile and ranking position of each country according to the pooled EU reference values
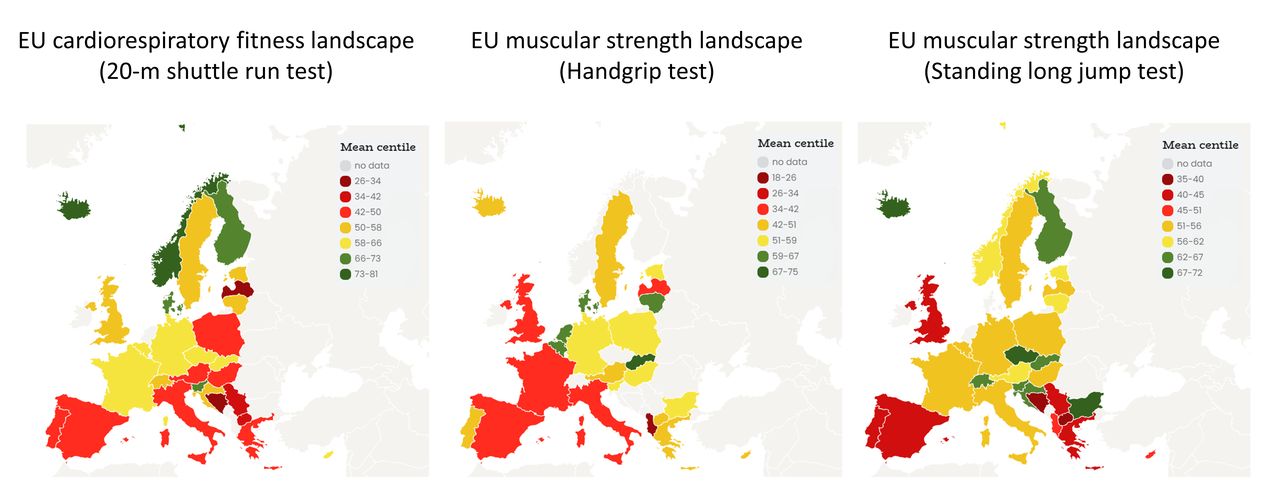
Country comparisons according to mean percentiles are also graphically represented in figure 2, with European fitness maps for each test shown separately. The traffic light colour code was used to represent country-specific percentile ranks, with red indicating lower fitness levels, yellow indicating intermediate fitness levels and green indicating higher fitness levels. The corresponding European maps for BMI and waist circumference are presented as online supplemental figure 3. These maps are available in an interactive mode at the FitBack web platform (www.fitbackeurope.eu/en-us/fitness-map) for boys and girls, together and separately. Visual inspection of the fitness maps shows that Southern European countries and the UK generally performed the worst. The correlation between country-level CRF and muscular strength rankings was moderate (r=0.59) and is graphically represented in figure 3. Shaded areas represent those countries ranked in the top 10 for CRF, muscular strength or both.

European fitness maps for cardiorespiratory and muscular strength in children and adolescents. Sex-specific and age-specific percentile values were calculated using available country-level data and were averaged across sexes and ages to obtain the mean percentile for each country compared with the EU reference values. Smoothed percentiles were calculated using the generalised additive model for location, scale and shape method, and weights were applied according to country population. Separate European fitness maps for girls and boys for these tests (as well as those for the obesity markers of body mass index and waist circumference) are available online (www.fitbackeurope.eu/en-us/fitness-map). The website map is interactive so that detailed information for each country is shown with the mouseover function. Not all countries have representative data, and therefore, caution should be paid when interpreting country comparisons presented in this study and in the platform. Data sources are available online (www.fitbackeurope.eu/en-us/fitness-map/sources) and in online supplemental table 1. EU, European Union.

Country average ranking in muscular strength and CRF in European children and adolescents. CRF in European children and adolescents. The ranking for muscular strength was computed as the average of the country ranking position in HGS and SLJ tests, while ranking for CRF directly reflects the country ranking position in the 20mSRT. Grey shaded areas indicate countries ranked in the top 10 for either muscular strength, CRF or both. This figure was created based on the data presented in table 4. Four countries (Albania, Bulgaria, Luxembourg and The Netherlands) were not included since they had either missing muscular strength or CRF data. Not all countries have representative data and therefore caution should be paid when interpreting country comparisons presented in this study and in the platform. Data sources are available online (www.fitbackeurope.eu/en-us/fitness-map/sources) and in online supplemental table 1. 20mSRT, 20 m shuttle run test; CRF, cardiorespiratory fitness; HGS, handgrip strength; SLJ, standing long jump.
Discussion
Main findings in the context of previous literature
This article provides the most up-to-date and comprehensive reference values for the health-related fitness of European children and adolescents aged 6–18 years. We also provided country-level mean percentiles for each fitness component. Our overall country-level fitness rankings suggest that Northern (Denmark, Finland, Iceland and Norway) and Central Eastern European countries (Slovenia, Czech Republic and Slovakia) have the fittest children and adolescents, while Southern European countries (Spain, Italy and Greece) and the UK are comparatively less fit. Interestingly, we observed a moderate positive correlation between country-level CRF and muscular strength, indicating that despite being different fitness components, countries having higher CRF levels generally also had higher muscular strength levels. A major contribution of the present study is that it comes together with the FitBack interactive web platform (www.fitbackeurope.eu), which is free, multilingual (English, Spanish, French, German and Italian) and ready to be used by researchers and practitioners in physical education, sport and health, as well as by policy makers across Europe. FitBack can be useful and informative even for other continents temporally until they develop their own normative values and similar web platforms. The FitBack platform provides individual and group-based fitness reports supported by educational materials for implementation of fitness monitoring to support fitness education (ie, to help understand why fitness and fitness testing are important, how to interpret fitness test results, how to set exercise goals, how to improve fitness levels, etc) and improve physical literacy, as well as interactive European fitness maps based on our reference values.
To date, the largest and best available fitness reference values for European children and adolescents were those published by Tomkinson et al in 2018.40 Our study updates such work by adding new data and expanding the age range from 9 years to 17 years to 6–18 years.40 It is challenging to directly compare the previous and current reference values, given between-study differences in included studies, countries, ages and sexes. Nevertheless, as an example, the 50th percentile values for the 20 m shuttle run ranged from 3.4 to 4.1 stages in girls aged 9–17 years and from 4.4 to 7.7 stages in boys aged 9–17 years in Tomkinson’s study, with the corresponding FitBack values ranging from 2.9 to 3.8 in girls and from 3.6 to 6.6 in boys. For handgrip, the corresponding values were 13.6–28.4 kg in girls and 15.3–45.0 kg in boys in Tomkinson’s study and 14.1–28.6 kg in girls and 15.4–44.6 kg in boys in FitBack. Further, the corresponding values for the standing long jump test were 123.9–156.4 cm in girls and 133.8–205.8 cm in boys Tomkinson’s study, and 122.7–156.8 cm in girls and 133.4–207.8 cm in boys in FitBack. Thus, the median fitness levels in the FitBack study are slightly lower than those in Tomkinson’s study for the 20 m shuttle run, and nearly identical for handgrip strength and the standing long jump. These between-study differences are likely because the included datasets differ in sample size, collection time frames, country representation and sample representativeness. Tomkinson’s reference values for the 20 m shuttle run were based on 445 092 data points from 24 countries (see table 9 of Tomkinson et al study40), whereas the FitBack reference values were based on 1 026 077 data points from 30 European countries. The corresponding sample sizes for handgrip strength and standing long jump are n=203 295 vs 787 966 and n=464 900 vs 1 345 159 for Tomkinson et al’s study versus FitBack, respectively.
Usefulness and practical implications of fitness testing and monitoring
Our reference values, when integrated into the interactive FitBack web platform, have practical utility and implications. First, fitness testing and monitoring is extremely important from a public health and clinical point of view, as recently acknowledged by the American Heart Association13 and others.52 Measuring cardiometabolic risk factors from blood samples is invasive and ethically questionable for youth at the population level. Likewise, mental and cognitive health assessments are often complex, sensitive and time consuming. Since physical fitness has repeatedly and consistently been shown to be a powerful marker of physical, mental and cognitive health in youth, fitness testing and monitoring will provide valuable insights into the health status of youth at individual and group levels. However, clinicians may not have the time, resources, facilities or expertise to conduct fitness testing (eg, the 20 m shuttle run test) in clinical settings. Therefore, we believe that the most feasible alternative and future goal is that population-level fitness testing be conducted in schools, with test results and interpretation incorporated into the healthcare system databases and forming part of an individual’s medical records that can be viewed by paediatricians and school doctors/nurses. This might be even more relevant in low-to- middle-income countries. Such practice has been implemented at the regional level in Galicia, Spain,53 and at the national level in Slovenia40 and Finland.54 In addition, our article and the interactive FitBack website provide a valuable and cost-effective solution for establishing fitness monitoring at the school, community, regional and national levels. For instance, policy makers at education, sport and health institutions can obtain valuable information about regional differences or temporal trends by monitoring fitness levels over time and use these reference values and the FitBack tool for proper sex-specific and age-specific interpretation. Indeed, the use of fitness surveillance to inform decision making is one of the top-ranked priorities in paediatric fitness according to international experts.55 As a timely example, fitness monitoring can flag a sudden decline in fitness, and therefore health, due to unique/unexpected situations, such as COVID-19 pandemic-related lockdowns and the substantial, rapid declines in youth fitness levels reported in countries with fitness surveillance systems.56 57 Thus, interventions for specific target groups can be implemented to prevent worse deterioration of fitness levels.
Second, fitness monitoring is part of physical education curricula in many European countries, but most European teachers do not currently have access to an easy-to-use and automatic tool for interpreting sex-specific and age-specific fitness test results. With our article and the FitBack platform, we aimed to contribute to an extensive implementation of fitness monitoring across European schools. In this context, the FitBack platform also provides information to avoid undesirable practices, such as grading students based on their fitness levels and fitness competitions among students, by using fitness testing as an educational tool to facilitate learning and understanding about fitness and its importance to health and sport and setting individual goals for improvement. Such an approach to fitness testing should help improve physical literacy among European youth. Physical literacy can be defined as ‘the motivation, confidence, physical competence, knowledge and understanding to value, and take responsibility for, maintaining purposeful physical pursuits/activities throughout the life course”.58 Despite some debate how fitness and its monitoring correspond to the physical literacy paradigm,59 the FitBack consortium supports the interpretation that fitness and motor skills collectively represent physical competence, which is a key component of physical literacy. In line with this, some physical literacy assessment tools (eg, Canadian Assessment for Physical Literacy and Passport For Life) assess motor skills and physical fitness for physical competence.59 In this context, fitness testing should be much more than just ‘one more school assessment’. Schools are in a unique position to positively affect the lifelong physical activity and physical fitness levels of their students by instilling values and developing skills that will help children throughout their lives. Moreover, the FitBack network has recently been granted by Erasmus+Sport programme with a new project called ‘FitBack4Literacy’, which aims to design and test a physical literacy toolkit including the FitBack reporting system. In the next 3 years (2023–2025), this toolkit will be developed and provided in 15 European languages and made freely available on the FitBack platform. Thus, the FitBack platform will have greater potential to be transformed in pedagogical practice by physical education teachers as well as generalist teachers who also conduct physical education classes in the early schooling years. Thus, enhancing physical fitness through goal setting and an appropriate physical activity programme and tracking individual changes through fitness monitoring may improve students’ physical literacy journey. Those with better fitness education may be more attuned to their body and what is required for good function, and may be able to foster lifelong physical activity habits.
Third, our reference values can be used for sport/athletic profiling and monitoring, as well as talent identification and development.43 60 Youth who have fitness levels above the 90th percentiles may be considered talented in certain fitness components, and sports participation could be promoted to them and their family. Likewise, changes in fitness levels in response to a lifestyle intervention could be tracked against our sex-specific and age-specific percentile bands to identify expected, better than expected or worse than expected developmental changes.
Limitation and strengths
While the FitBack network gathered roughly 8 million test results for the development of new health-related reference values, the included data are not representative of all European youth. Some countries such as Slovenia, Hungary and Portugal (www.fitbackeurope.eu/en-us/monitoring-fitness/best-practice) have established fitness monitoring systems that cover all school ages and all country regions. Other countries such as Greece61 and Poland62 have conducted nationally representative fitness testing at particular points in time, while most European countries do not have nationally representative fitness data available. This implies that our country-level comparisons should be taken cautiously, given that not all data are representative of their source populations. Our ambition was to identify the best available and most recent data (using the ALPHA fitness tests) for each country to update existing CRF and muscular strength reference values, and to strengthen the evidence supporting the FitBack platform. Unfortunately, included fitness data were collected at different times, and temporal trends in fitness may have biased our results. To minimise the potential for bias, old data collected in the 1980s were excluded from our analyses (see online supplemental table 1). Only harmonised cross-country testing at the same time will provide the most accurate comparisons. While not nationally representative, the HELENA study collected harmonised fitness data in 2005–2008 across 10 European cities, and the results suggested that adolescents living in Southern Europe (Spain, Italy and Greece) had lower levels of CRF and muscular strength, as well as more total and central adiposities, than their peers living in Central Northern Europe.63 These findings are consistent with the FitBack results hereby presented and are in line with previous reports.64 65 Another limitation of our study is the protocol variation across studies. In order to improve this moving forward, we recommend researchers use the ALPHA fitness test battery manuals of operations and explanatory videos that are freely available (http://profith.ugr.es/alpha-children available in English and Spanish), and which have been incorporated into the FitBack platform (www.fitbackeurope.eu/en-us/make-report/about-testing). Finally, while we obtained data from 77% (34/44) of European countries (https://www.schengenvisainfo.com/countries-in-europe/), additional data are required from the remaining countries to paint a complete European fitness picture. On the other hand, there are some important strengths/contributions from our study and the FitBack network, including (1) the development of the largest and most up-to-date fitness reference values for school-age Europeans; (2) increased awareness of the importance of fitness surveillance and monitoring; (3) the identification of countries that have access to large fitness databases and those which do not, and (4) to facilitate fitness testing and interpretation through the FitBack platform, which we hope will improve the amount, quality and availability of future fitness data. All these points can add to ongoing international initiatives such as country report cards to support the Active Healthy Kids Global Matrix (https://www.activehealthykids.org/global-matrix/), which now includes physical fitness as a core indicator.
Conclusion
There is overwhelming evidence supporting the importance of fitness testing from a health, educational and sport point of view. Further, the EU-funded ALPHA project identified the most reliable and valid fitness tests, providing the methods (manuals of operations and videos) needed to evaluate youth health-related fitness levels in a standardised manner across Europe. Now, the FitBack project provides the scientific and practitioner communities with the steps needed for the implementation of youth-based fitness assessment and interpretation in school or sporting settings across Europe. Our sex-specific and age-specific reference values have practical implications and are the foundation of the FitBack platform for interactive individual and group-based interpretation of fitness levels. These reference values should be revisited in the future as more countries introduce national surveillance systems to reflect the updated fitness levels of European youth. The FitBack network, therefore, welcomes new members and is searching for missing and new fitness data.
Data availability statement
Data may be obtained from a third party and are not publicly available. This article includes data from more than 100 datasets. Data sharing permission should be requested to the researchers of each individual dataset. References for each dataset can be found in online supplemental table 1.
Ethics statements
Patient consent for publication
Ethics approval
This study involves human participants. The entire Fitback procedures for pooling together existing fitness data were evaluated and approved by the ethics committee in sports science at the University of Ljubljana, Slovenia (the University coordinator the FitBack project). The participants gave informed consent to participate in the study before taking part.
Acknowledgments
The authors acknowledge the support of all FitBack network members who provided data on physical fitness of children and adolescents (see www.fitbackeurope.eu/en-us/fitness-map/sources and online supplemental table 1), including also large European Union-funded consortium projects such as HELENA and IDEFICS. We thank D Mayorga-Vega for his assistance on obtaining the fitness data from Poland.
References
Supplementary materials
Supplementary Data
This web only file has been produced by the BMJ Publishing Group from an electronic file supplied by the author(s) and has not been edited for content.
Footnotes
Twitter @ortegaporcel, @gil_cosano, @ruizruizjonatan, @BrendanOK_, @GRHSANDERCOCK, @clavelivan, @Idoialabgo1, @SportEdu1
Contributors Designed research, contributed to the conception and interpretation of the analyses: FBO, BL, RB, JJG-C, JM, GRT, JRR, EM, GS, IM, TT, MS, CS, AC, MK, TC, LBS and GJ. Statistical analysis: BL and RB. Drafted the manuscript. FBO. Participated/responsible for fitness data collection: FBO, JM, JRR, EM, GS, IM, MS, MK, TC, LBS, ML, AE, BM, LSS, MP, NL, KK, KDT, LS, CD, LR, SG, JC-P, JV, BOK, OLV, TG, GS, MM-D, CN, E-MR, SP, SKuu, MJMC, IC, IL, JD, DC, SK, SS, MJN, KB, MS-L, TAL, GT, DN, WA and NW. All authors critically revised the manuscript and approved the final version of the manuscript to be submitted. FBO and GJ are the guarantors of this article, and therefore accept full responsibility for the work and/or the conduct of the study, had access to the data and controlled the decision to publish.
Funding This research was co-funded by the Erasmus+ Sport Programme of the European Union within the project FitBack No 613010-EPP-1-2019-1-SI-SPO-SCP and Slovenian Research Agency within the Research programme Bio-psycho-social context of kinesiology (number P5-0142). FBO, JJG-C, JRR and IL are supported by the University of Granada, Plan Propio de Investigación, Visiting Scholar grants and Excellence actions: Units of Excellence; Unit of Excellence on Exercise, Nutrition and Health and by the Junta de Andalucía, Consejería de Conocimiento, Investigación y Universidades and European Regional Development Fund (SOMM17/6107/UGR) and CIBERobn Physiopathology of Obesity and Nutrition.
Map disclaimer The inclusion of any map (including the depiction of any boundaries therein) or of any geographical or locational reference does not imply the expression of any opinion whatsoever on the part of BMJ concerning the legal status of any country, territory, jurisdiction or area or of its authorities. Any such expression remains solely that of the relevant source and is not endorsed by BMJ. Maps are provided without any warranty of any kind, either express or implied.
Competing interests None declared.
Patient and public involvement Patients and/or the public were not involved in the design, conduct, reporting or dissemination plans of this research.
Provenance and peer review Not commissioned; externally peer reviewed.
Supplemental material This content has been supplied by the author(s). It has not been vetted by BMJ Publishing Group Limited (BMJ) and may not have been peer-reviewed. Any opinions or recommendations discussed are solely those of the author(s) and are not endorsed by BMJ. BMJ disclaims all liability and responsibility arising from any reliance placed on the content. Where the content includes any translated material, BMJ does not warrant the accuracy and reliability of the translations (including but not limited to local regulations, clinical guidelines, terminology, drug names and drug dosages), and is not responsible for any error and/or omissions arising from translation and adaptation or otherwise.