


Summary
The Kopeh Dagh is a linear mountain range separating the shortening in Iran from the stable, flat Turkmenistan platform. In its central part is an array of active right-lateral strike-slip faults that obliquely cut the range and produce offsets of several kilometres in the geomorphology and geological structure. They are responsible for major destructive earthquakes in the 19th and 20th centuries and represent an important seismic hazard for this now-populous region of NE Iran. These strike-slip faults all end in thrusts, revealed by the uplift and incision of Late Quaternary river terraces, and do not continue beyond the Atrak river valley, which forms the southern margin of the Kopeh Dagh. The cumulative offset on these strike-slip faults, and their associated rotation about vertical axes, can account for ∼60 km of N–S shortening. This value is similar to estimates of the Late Quaternary N–S right-lateral shear between central Iran and Afghanistan, which must be accommodated in NE Iran. The strike-slip faults also require ∼30 km of along-strike extension of the Kopeh Dagh, which is taken up by the westward component of motion between the South Caspian Basin and both Eurasia and Central Iran. It is probable that these motions occurred over the last ∼10 Ma.
1 Introduction
This paper is concerned with the active tectonics of the Kopeh Dagh mountains in NE Iran, and their role in the collision between Arabia and Eurasia. The Kopeh Dagh form a linear intracontinental fold and thrust belt trending NW–SE between the stable Turkmenistan platform and Central Iran (Fig. 1), and mark the northern limit to deformation in NE Iran. The active tectonics of the Kopeh Dagh region has received much less recent attention than other parts of Iran, such as the Zagros (Tatar 2002; Talebian & Jackson 2004), Eastern Iran (Berberian & Yeats 1999; Walker & Jackson 2004), and the Alborz of north Iran (Axen 2001; Jackson 2002; Allen 2003) and as a result, their role in the accommodation of the Arabia–Eurasia convergence within Iran is less well understood.
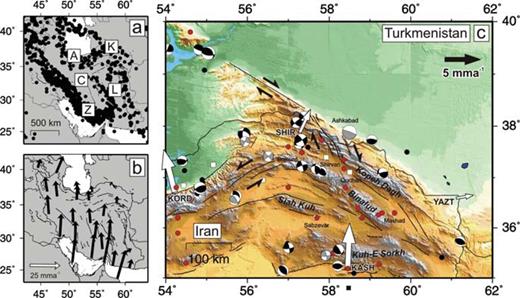
(a) Locations of earthquake epicentres (Mw≥ 5) across Iran during the period 1964–1998 (Engdahl 1998). Earthquakes are concentrated in the Zagros (Z), Alborz (A), and Kopeh Dagh (K) mountain belts, which surround relatively aseismic Central Iran (C) and the Lut desert (L). (b) Velocities relative to Eurasia measured by GPS, showing that approximately N–S shortening between Arabia and Eurasia is accommodated throughout Iran (Vernant 2004). (c) Summary seismotectonic map of NE Iran, with GPS velocities measured at four points. Red circles show earthquake epicentres from historic records, during the period 400 BC to 1962 AD (Ambraseys & Melville 1982). Black circles show instrumentally recorded earthquake epicentres (Mw≥ 5) for the period 1964–2004, from the updated catalogue of Engdahl (1998). Black fault-plane solutions are body-wave modelled earthquakes from the catalogue of Jackson (2001) and Jackson (2002). Grey fault-plane solutions are first motion solutions from McKenzie (1972), Jackson & Fitch (1979) and Jackson & McKenzie (1984).
In this paper we use historical and instrumental seismicity, along with observations from satellite imagery, topographic data (SRTM) and field observations of the geomorphology to clarify the active tectonics of the Kopeh Dagh. These different data types cover a range of timescales of deformation, enabling us to identify the most important features, and to reveal patterns, which would otherwise be difficult to see. The aim is to better understand the deformation occurring within the Kopeh Dagh in the context of the Arabia–Eurasia collision. An important by-product of this work is a better understanding of the seismic hazard in this region, which has experienced a number of devastating historical earthquakes (Ambraseys & Melville 1982; Berberian & Yeats 1999) and which is now much more densely populated. As a result of this work, the faulting in the epicentral region of these earthquakes, and their potential for generating future earthquakes, are much clearer.
2 Tectonic and Geological Background
2.1 Regional tectonics
Shortening in Iran accommodates the northward motion of the Arabian shield into Eurasia. Recent GPS measurements (McClusky 2003; Vernant 2004) indicate that Arabia moves approximately northwards, with respect to Eurasia, at ∼23 mma−1 at the longitude of the Kopeh Dagh (Fig. 1b). This is slower than previous estimates for plate motion based on pre-GPS plate-circuit models (DeMets 1994). The seismicity within Iran suggests that much of the deformation is concentrated in the Zagros, Alborz and Kopeh Dagh mountains, and in east Iran (Fig. 1a), surrounding Central Iran and the Lut desert, which are virtually aseismic and behave as relatively rigid blocks (Jackson & McKenzie 1984). This view is supported by the limited GPS data (Vernant 2004; Masson 2005). The Zagros accommodates about half of the northward motion of Arabia (e.g. Tatar 2002), with the Alborz, central Caspian Sea, and Kopeh Dagh taking up the rest further north (Vernant 2004; Masson 2005). East of ∼56°E, the northward motion of Arabia is partly accommodated by subduction beneath the Makran (Vernant 2004), with the remainder accommodated by shortening in the Kopeh Dagh and Binalud ranges of NE Iran (Fig. 1c). Shortening north of the Zagros requires N–S right-lateral strike-slip faulting between Central Iran and stable Afghanistan (part of Eurasia). This is observed in the N–S right-lateral fault systems either side of the Lut desert, in east Iran (e.g. Walker & Jackson 2002, 2004).
Estimates for the amount of shortening across NE Iran vary. Recent GPS measurements in NE Iran (Vernant 2004) are limited to three stations at KASH, SHIR and YAZT (Fig. 1b and c). These show ∼7 mma−1 N–S shortening between Kashmar (KASH), south of the Binalud, and the region north of the Kopeh Dagh. Lyberis & Manby (1999) constructed balanced geological sections across the western part of the Kopeh Dagh and estimated ∼75 km of N–S shortening, which they assumed had occurred over the last 5 Ma, yielding a much higher rate of shortening of ∼16 mma−1. The available GPS measurements indicate a N–S convergence in NE Iran, which is oblique to the NW–SE trend of the Kopeh Dagh range. However, the shortening in the Kopeh Dagh must die out in the SE against the Afghanistan border, as western Afghanistan is evidently part of Eurasia (Jackson & McKenzie 1984; Vernant 2004). In addition, the N–S right-lateral shear between Afghanistan and Central Iran is distributed over an E–W width of at least 400 km (Walker & Jackson 2004) south of the Kopeh Dagh. These two considerations make it likely that there is a strong SE-NW gradient of shortening in NE Iran, increasing from the Afghanistan border towards the Caspian lowlands. Neither the existing GPS nor geological investigations indicate how that shortening is achieved by the active faulting, which is the principal focus of this paper. As we will show, the geometry and kinematics of the faulting are clear, despite the poor knowledge of fault slip rates in the region. A better understanding of the slip rates will require a denser GPS network or regional fault dating program, neither of which are have yet been undertaken.
The northern limit of the Kopeh Dagh is marked by an abrupt linear range front trending 120° (Fig. 1c), north of which lie the flat lowlands of the Turan platform, part of stable Eurasia. NW of Ashkabad a prominent, linear right-lateral strike-slip fault, the Ashkabad fault, follows the range front. There is little direct evidence for the strike-slip offset on this fault, but Lyberis & Manby (1999) estimate a total of ∼35 km, by resolving their estimate of ∼75 km total N–S shortening onto the Ashkabad fault and thrusting perpendicular to it. In the central part of the range, the Kopeh Dagh must have been thrust over the Turan platform, as the free-air gravity anomaly shows a depression characteristic of the bending in a foreland basin (Maggi 2000). SE of Ashkabad, the range front is less linear and continuous, and the nature of the faulting is less clear. The change in character of the range front occurs near 57°–58°E, where the Ashkabad fault is met by a zone of NNW–SSE trending right-lateral strike-slip faults that cross the high Kopeh Dagh between Bojnurd and Quchan, and which are very clear on the satellite imagery. This change in structural and geomorphological style near 57°–58°E is in the region of a large (magnitude 7.2) destructive earthquake near Ashkabad in 1948. Although it produced some co-seismic ground deformations (Tchalenko 1975) the type of faulting associated with it is not clear. Likewise, the available seismological information is ambiguous (McKenzie 1972). The focal mechanism is shown in Fig. 1(c) as a low angle thrust parallel to the range, but only the steep NW–SE nodal plane is reasonably determined by first motions (McKenzie 1972), which does not rule out the possibility that it could have been NW–SE right-lateral strike-slip.
To the south of the Kopeh Dagh lie a series of elongated mountain ranges: the Binalud, which is a structural and geological eastward continuation of the Alborz (Alavi 1992), the Siah Kuh near Sabzevar and the Kuh-e-Sorkh near Kashmar (Fig. 1c). The orientation of these ranges becomes progressively more E–W towards the south. Little detail is known about these systems, although they are bounded by active faults mostly on their southern sides, and large historical earthquakes are known to have been associated with them. In this paper we are principally concerned with the relations between the Kopeh Dagh and the Binalud. The ranges to the south will be discussed elsewhere.
2.2 Geology
The Kopeh Dagh is made up of a sequence of mostly conformable and complete Mesozoic–Tertiary sedimentary rocks (Stöcklin 1968; Berberian 1976). These consist of limestone, marl and sandstone sequences, which have been shortened into open symmetric folds, with typical wavelengths of 5–20 km (Huber 1977a, b; Afshar Harb 1987). In this way, the resistant Cretaceous Tirgan limestone forms the characteristic linear peaks of the mountain belt, while the softer sandstones and marls form the low, intervening valleys. The rocks of the Kopeh Dagh represent a closing ocean basin, as NE Iran became sutured to the Turan platform of Eurasia. The change from marine rocks to terrestrial, therefore, gives us an idea of when collision occurred and the mountains of the Kopeh Dagh were formed. This seems to have been diachronous, with emergence migrating from east to west, leaving Pliocene marine strata in the west, while non-marine rocks of equivalent age were deposited in the east (Lyberis & Manby 1999). Structurally, the rocks of the Kopeh Dagh are distinct from those of Central Iran, and belong to the Turan platform (Stöcklin 1974; Alavi 1996).
By contrast, the Alborz-Binalud range to the south forms the northeastern limit to Central Iran. The boundary they form with the Kopeh Dagh runs along the Atrak valley (Fig. 2) and represents the northeastern suture between Iran and Eurasia (Alavi 1992, 1996). The tectonic history of the Alborz-Binalud chain is older and more complicated than that of the Kopeh Dagh. The most recent phase of uplift began in the Late Cretaceous-Palaeocene (Stöcklin 1974). During this time the Kopeh Dagh lay to the north beneath a shallow marine sea, and red clastic sediments were deposited, derived from the erosion of the early Alborz (Berberian 1976; Berberian & King 1981). Uplift in the Kopeh Dagh occurred later, although the exact timing is not well constrained. Estimates vary; Berberian & King (1981) loosely date uplift as post ‘Early-to-Middle Oligocene’ (post ∼30 Ma), while Lyberis & Manby (1999) suggest Pliocene–Quaternary (∼5 Ma) uplift.
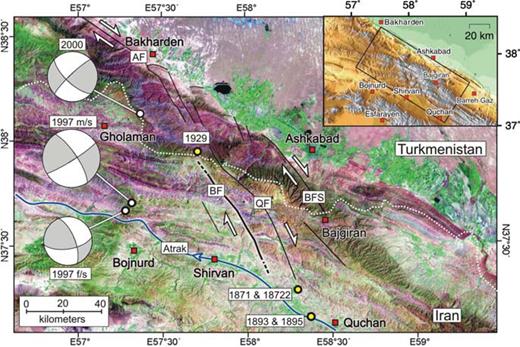
Landsat7 satellite image (bands 541) of the central Kopeh Dagh, comprising the Bakharden–Quchan fault zone. Major faults are marked in black, AF = Ashkabad fault, BS = Baghan fault, QF = Quchan fault, BFS = Bajgiran fault system. Probable epicentres of major earthquakes of the last 150 yr, that are discussed in this paper, are shown by yellow circles. The heavy line of the Baghan fault shows the mapped surface rupture of the 1929 earthquake (see Fig. 6, after Tchalenko 1975). F/s means foreshock, and m/s means main shock. Inset shows the location of the Bakharden–Quchan fault zone within the Kopeh Dagh.
2.3 Seismicity
Due to the importance of trade routes linking Europe and the Middle East with Asia, and long-term settlement of the fertile Atrak river valley (Fig. 2), there is a long and detailed historical record of NE Iran stretching back about 2000 yr (Ambraseys & Melville 1982; Berberian & Yeats 1999). In more modern times, particularly destructive earthquakes occurred near Quchan (1851, 1871–1872, 1893 and 1895) and near Shirvan (1929), which, if repeated, would have very serious consequences in the now more-densely populated Atrak valley (Tchalenko 1975). Identifying the probable faults responsible for these earthquakes is one of the goals of this paper.
Modern instrumental data are available from the 1960s. Since this time there have been few teleseismically recorded earthquakes in the central Kopeh Dagh, except in the western part of the NNW–SSE right-lateral strike-slip zone between Bojnurd and Quchan, called the Bakharden–Quchan fault zone, after Tchalenko (1975) (Fig. 2). In particular, a series of three earthquakes of Mw 5.4–6.4 occurred north of Bojnurd in 1997–2000, and will be discussed here. All the earthquakes in NE Iran, whose depths can be confirmed by teleseismic body-wave modelling, have centroids shallower than 15 km (Priestley 1994; Jackson 2002), and are thus restricted to the upper crust. There is no evidence for subcrustal seismicity.
3 Strike-Slip Faulting in the Bakharden—Quchan Fault Zone
The system of NNW–SSE right-lateral strike-slip faults in the Bakharden–Quchan fault zone between Bojnurd and Quchan is one of the most prominent structural and topographic features of the central Kopeh Dagh (Fig. 2) and several large earthquakes have occurred within it in the last 150 yr. Faults within the zone are expressed clearly in the geomorphology. Our approach has been, first, to understand the relationship between the geomorphology and the faulting in these historical earthquakes. We can then use this address two fundamental questions: (1) how do these strike-slip faults end, and do they cross the Atrak river valley in to the Binalud? and (2) can we identify other active faults that have not moved in earthquakes in modern times? We first describe the geomorphology of the faulting that was known, or inferred to be responsible, for earthquakes at Quchan (1851, 1871–1872, 1893 and 1895) and near Shirvan (1929). We then describe two recent earthquakes, which occurred north of Bojnurd in 1997. Lastly, based on the geomorphological expression of the faulting in these events, we identify a previously unknown major fault system near the populous city of Shirvan, and a smaller fault system probably responsible for an earthquake in 2000 near Gholaman.
3.1 Quchan earthquakes (1851, 1871–1872, 1893 and 1895)
3.1.1 Historical seismicity
Of the largest earthquakes to occur in the Kopeh Dagh in the last 150 yr, five occurred around the town of Quchan, in the Atrak Valley (Table 1 and Fig. 3). Little is known about the 1851 event, although it is thought to have been of M∼ 6.9 (Ambraseys & Melville 1982), and caused some destruction to the town. A bigger shock (M∼ 7.1) occurred on 1871 December 23 with a large aftershock (M∼ 7.0) on 1872 January 6 (Fig. 3). These earthquakes caused widespread devastation to Quchan itself, and many surrounding villages (for a detailed account see Tchalenko 1975; Ambraseys & Melville 1982). The region of maximum damage occurred in a roughly N–S band, with Quchan at its southern end (Fig. 3c). No surface rupture was reported, and any that might have occurred will have since been destroyed by farming. However, satellite imagery reveals this macroseismic region to coincide with a NNW–SSE fault, prominent in the topography, satellite imagery (Figs 3a and b) and geological map (Afshar Harb 1987), which we call the Quchan fault. This fault obliquely cuts the topography and structure of the Kopeh Dagh, and displaces the bedrock geology in clear right-lateral offsets (discussed in Section 5.2). In the north, it turns obliquely into the Ashkabad fault zone (Fig. 2). Its southern limit is less clear, although it cannot be seen displacing geology south of the Atrak valley, in the Binalud Mountains. The location and extent of the damage in the 1871–1872 earthquakes suggest the Quchan fault continues south of the high mountains, at least as far as the northern edge of the Atrak valley. SRTM digital topography shows a line of drainage incision, projecting south along the line of the Quchan fault, beyond the last visible offset of bedrock geology (Cretaceous Tirgan limestone) in the mountains (Fig. 3c). This projected line corresponds with the main damage region in the 1871–1872 earthquake sequence. This line is likely to represent the continuation of the fault into the Atrak valley, where a vertical component on the fault results in uplift to the east, causing all the rivers to incise.
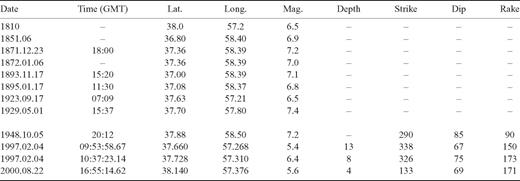
The most significant earthquakes to occur in the Kopeh Dagh over the last 150 yr; above the line consists of data from historical records (Ambraseys & Melville 1982), and below are instrumental records (McKenzie 1972; Jackson 2002). The magnitude for the instrumental records is Mw. Time is in hours, minutes and (where applicable) seconds.
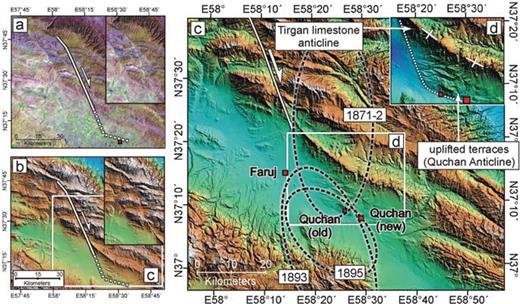
(a) Landsat7 satellite image of the Quchan fault, which displaces the geology of the Kopeh Dagh in a right-lateral sense. Inset shows the fault without the overlay, for clarity. (b) SRTM digital topography (90 m) of the region in (a) showing the Quchan fault displacing the topography, again with the uninterpreted topography in the inset. (c) Topographic map of the Quchan region, showing the regions of maximum destruction from the 1871, 1872, 1893 and 1895 earthquakes (Tchalenko 1975). The solid white line shows the southern limit of the visible surface expression of the Quchan fault, before it enters the Atrak valley. (d) Region within white box in (c) (same scale) shows the Quchan anticline without damage ellipses for clarity. The dashed line shows the likely southern continuation of the fault to the Quchan anticline. This line is marked by a topographic edge, east of which uplift has formed terraces into which active rivers are currently incising. 5 km west of Old Quchan, the Quchan fault turns into a ESE–WNW trending blind thrust fault, which runs along the S-edge of the Quchan anticline.
Around 19:30 local time on 1893 November 17 another large earthquake (M ∼ 7.1) completely destroyed Quchan and surrounding areas, killing more than 5000 people (about half the population). The region of maximum damage was similar to that of the 1871–1872 sequence, but did not extend as far north, instead striking E–W along the valley (Fig. 3c). An exceptionally cold winter resulted in many more deaths due to exposure and starvation.
Despite initial plans to rebuild Quchan outside the region of maximum damage, it remained in its original location. Then, at 11:30 on 1895 January 17, another large earthquake (M 6.8) occurred. Destruction of Quchan was nearly total, although casualties were relatively light, due to a foreshock warning, the early time of day, and the lack of mud brick houses left to collapse (most new houses used timber). The region of maximum damage was virtually the same as the 1893 earthquake, although did not extend as far south (Fig. 3c). After this earthquake, Quchan was rebuilt 10 km to the east, where it remains to this day. Its new location is still within the region of maximum damage in the 1893 and 1895 earthquakes (Tchalenko 1975; Ambraseys & Melville 1982).
3.1.2 Geomorphology
Just north of Old Quchan is a structure known as the Quchan anticline (Afshar Harb 1987) consisting of uplifted Neogene and Cretaceous Limestone (Fig. 3c). Digital topography highlights the significance of this anticline, which forms a raised hill ∼150 m above the flood plain, striking WNW–ESE (Figs 4a and d), and within the damaged regions in 1893 and 1895. In the field, the south side of the Quchan anticline displays uplifted terraces of the Atrak river. These can be seen emerging from the current flood plain in the west, reaching a maximum height near Old Quchan, and then dying away back to the active flood plain in the east. The higher terraces are tilted more than the lower, thus forming a diverging fan of levels in cross section (Fig. 4c), and indicating that their uplift must have a local cause, rather than be a response to a regional change in base level. Along the front of the anticline, one prominent terrace level is capped by a cemented limestone conglomerate (Fig. 5c), which accentuates its morphology.
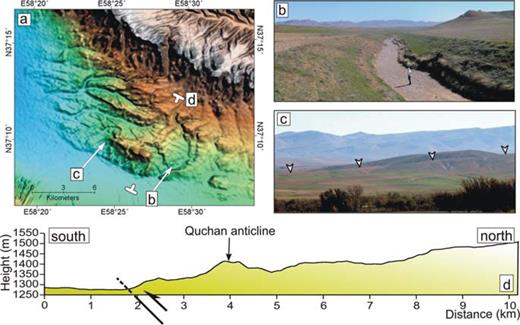
(a) SRTM digital topographic map of the Quchan anticline, which forms a significant feature in the local topography, rising ∼150 m above the valley floor. Locations of field photos (b) and (c), and a NE–SW topographic profile (d) are shown. (b) View N from the E end of the Quchan anticline. Active river incision occurs north of the Quchan thrust. (c) View N of the W end of the Quchan anticline, where river terraces diverge from the active flood plain in the W, increasing in height to the E. (d) Topographic profile extracted from SRTM digital topography (90 m), which shows the uplifted and eroded Quchan anticline. The approximate location of a blind N-dipping thrust (the Quchan thrust) responsible for the uplift is shown.
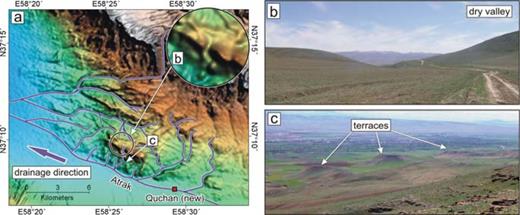
(a) SRTM topographic map of the Quchan anticline, with the drainage shown in blue. Rivers drain south from the high Kopeh Dagh into the Atrak Valley, where they flow west, eventually to drain into the Caspian Sea. Circular inset shows a zoom of the dry valley on the crest of the Quchan anticline. (b) A possible dry valley on the crest of the Quchan anticline. This may have been formed by a now-deflected southward-draining river (examples of which are present to the north), which became abandoned due to the uplifting anticline. (c) View SW from the top of the Quchan anticline, where a prominent terrace level capped by a limestone breccia can be seen along the southern front of the Quchan anticline. The settlement in the valley is Old Quchan (see Fig. 3c).
It seems likely that a blind thrust fault runs along the south side of the Quchan anticline, causing the area to the north to uplift. This results in the formation of river terraces, into which active south-flowing rivers are currently incising (Fig. 4b). This interpretation is supported by the drainage pattern itself. Figs 5(a) and (b) show an abandoned river valley on the fold crest, which currently has no significant catchment. The original river must have drained south through this valley, but was deflected by the uplift of the anticline. North of this dry valley, three rivers, whose headwaters drain south, are deflected to the west, where they drain around the back of the anticline (Fig. 5a).
Evidence from the geomorphology strongly suggests that the Quchan anticline is an active structure, uplifting as a result of a north-dipping thrust fault. The structure is at least 10–15 km long. Its location at the southern end of the clear morphological expression of the Quchan strike-slip fault, and on its eastern side, suggests that it represents the structural termination of the strike-slip fault. It is possible the resistant Tirgan limestone, which has been folded into an anticline and forms the southern range front of the Kopeh Dagh ∼10 km north of Quchan (Fig. 3), could represent an older thrust termination to the Quchan fault. However, it seems clear from the geomorphology that the Quchan anticline has been most active in the Quaternary. This arrangement is very common with strike-slip faults, and has been described elsewhere in Iran (Berberian 2000b; Walker 2003) and other settings of continental convergence (Meyer 1998; Bayasgalan 1999). Furthermore, no right-lateral offsets can be seen in the geology south of Quchan, as shown by the undisturbed morphology and geology of an extinct Pliocene volcano ∼20 km to the south (see Section 5.2 and Fig. 12). Therefore, we conclude that the Quchan fault does not cross the Atrak valley into the Binalud, but terminates eastwards along it as a thrust.
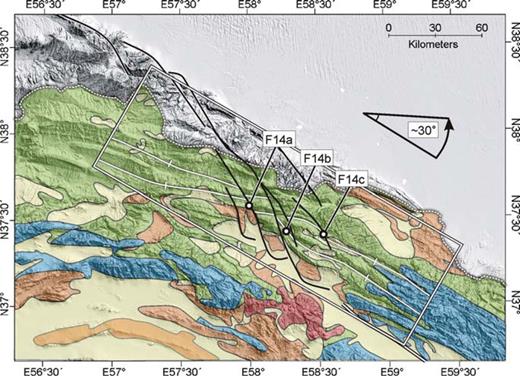
Topographic map overlain by geology of the central Kopeh Dagh (blue = Jurassic limestones and dolomites, green = Cretaceous limestones and marls, Orange = Tertiary sandstones, mud and conglomerates, Cream = Quaternary alluvial cover, and red = Neogene(?) volcanics). The white box shows the approximate bounds of the Bakharden–Quchan fault zone, and the strike-slip faults with the largest offsets, within it (see Fig. 13). The offsets on these faults are shown in Fig. 14. The geology of the Kopeh Dagh strikes parallel to the range, expressed as a series of anticlines. The white lines show anticlines within the Cretaceous (Tirgan limestone), which strike across the entire zone. These are seen to be offset between the main strike-slip faults, and rotated anticlockwise 20°–30°.
3.2 Baghan fault and the 1929 earthquake rupture
3.2.1 Historical seismicity
A large (Ms∼ 7.0) earthquake caused damage north and east of Shirvan (Fig. 2) on 1929 May 1 at 19:07 local time (Tchalenko 1975; Ambraseys & Melville 1982). This earthquake is of particular interest as it produced coseismic ground ruptures more than 50 km in length (Fig. 6a). Field investigation in the 1970s found a linear fault scarp, visible in places as a 1 m topographic step uplifted to the NE (Ambraseys & Melville 1982). No direct evidence of a coseismic right-lateral offset was found, although our field investigation revealed many offset streams, visible in the geomorphology as shutter-ridges, indicating an overall right-lateral slip (Fig. 6c). Larger-offset examples can be seen in the satellite imagery (Fig. 6b). Around 3500 people were killed, this figure being relatively low due to the sparse population along the fault. Damage was greatest in the NW, where the instrumental epicentre is apparently located (see Tchalenko 1975), though the uncertainty must be considerable. Significant damage also occurred at the SE end near Baghan (Fig. 7a), such that relocation of Shirvan was considered at the time (Tchalenko 1975). A large aftershock was recorded on 13 July (∼M 6) near the town of Faruj (Fig. 6a). The relatively well-defined damage area for this smaller event makes it clear that its location was to the SE of Baghan, within the Atrak valley, and beyond the extent of the main shock rupture.
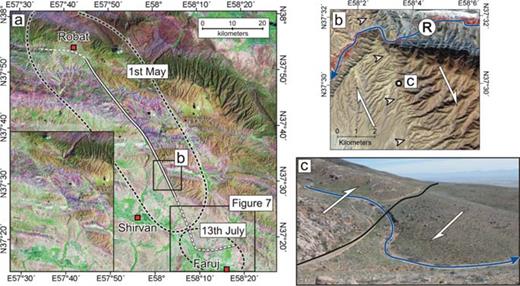
(a) Landsat7 satellite image of the region around Shirvan. The black line shows the location of the mapped surface rupture associated with the 1929 earthquake (Tchalenko 1975). The dashed line to the north, near Robat, had no surface rupture, but suffered heightened damage, suggesting the fault may possibly have turned into a E–W trending thrust, beneath a prominent E–W anticline, at its north end. The dashed line to the south also had no surface rupture, but does continue south along strike of the main surface rupture. It is expressed as a topographic edge, east of which rivers incise leaving behind terrace levels (see Fig. 7). White dashed lines represent the regions of maximum damage in the May 1 mainshock, and July 13 aftershock. The inset shows the fault cutting through the geology of the Kopeh Dagh, but without an overlay, for clarity. (b) Aster satellite image of a segment of the Baghan fault, near Baghan, where the big river, marked R at the top of the image, has a right-lateral offset of ∼1 km. (c) Field photo looking SE ∼5 km N of Baghan (7a) showing deflected drainage (blue) along the line of the fault (black line). Along this segment of the fault, there are many ‘shutter-ridges’ reflecting recent right-lateral strike-slip motion.
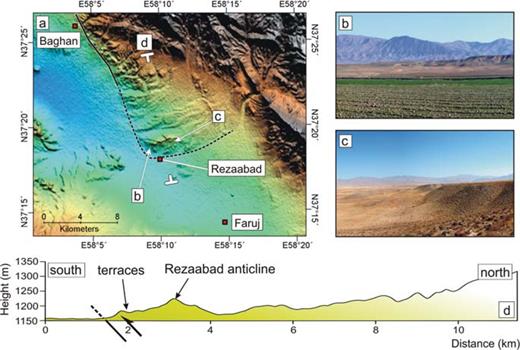
(a) SRTM digital topographic map of the southern end of the Baghan fault, which ends in the Atrak valley in a E–W trending anticline ∼80 m high, by the village of Rezaabad. Locations of field photos (b) and (c), and a N–S topographic profile (d), are shown. (b) View N of the W end of the Rezaabad anticline, in the foreground. It is composed of three different terrace levels. (c) View W of the terrace level at the southern front of the anticline. (d) N–S topographic profile across the Rezaabad anticline, showing the area north of the buried thrust to be uplifted. The features of this profile are very similar to those across the Quchan anticline (Fig. 4d).
From the satellite imagery, the ground rupture can be seen to coincide with another large strike-slip fault cutting obliquely through the high Kopeh Dagh (Fig. 6a inset). This fault displaces bedrock geology in a right-lateral sense. It runs parallel to the Quchan fault, and has a similar offset (see Section 5.2). Tchalenko (1975) refers to this fault as the Baghan-Germab fault. In this study we refer to it simply as the Baghan fault.
3.2.2 Geomorphology
The geomorphology of the Baghan fault, and its apparent terminations, are very similar to those of the Quchan fault. To the NW, the fault is not continuous all the way to the Ashkabad fault, but apparently ends at the Iran–Turkmenistan border near Robat (Fig. 6a). However, other similar faults appear along-strike to the north, and do continue into the Ashkabad fault (Fig. 2a). To this extent, these faults can all be interpreted as one long fault system.
The southern end of the Baghan fault is very similar to that at Quchan. The fault does not seem to cross the Atrak valley, as the geology is not displaced along strike to the south, in the Binalud mountains (for a discussion of the overall offsets on this and the Quchan fault, see Section 5.2). Digital topography shows a line of incision, with the east side uplifted, continuing SE of the known surface rupture limit in 1929 (Fig. 7a). Tchalenko (1975) also observed a vertical component, uplifted to the NE, in the preserved 1929 earthquake rupture. As a result, rivers draining to the SW are incised upstream of the projected line of the fault (Fig. 7a). Field evidence reveals shutter ridges, and offset streams of a right-lateral nature as far south as Baghan (Figs 6b and c), but further south in the Atrak valley, a lack of topography on the west side of the fault means offsets are difficult to preserve. Also, farming has destroyed any 1929 coseismic offsets that may have formed in the valley itself.
Digital topography reveals where the fault ends in the south, at the village of Rezaabad. Here the line of incision changes strike abruptly from NNW to ENE, marked by a 80 m high E–W trending anticline, the Rezaabad anticline. This anticline is made entirely of river terrace material, and is extensively farmed. The anticline is smaller than that at Quchan, and its features are less pronounced. Nonetheless, its principal characteristics are clear. At least three terraces of the Atrak river emerge from the flood plain (Figs 7b and c), diverging such that the higher is tilted most. Once again, the divergence of these terraces indicates a local cause of uplift. The most prominent terrace is visible on SRTM digital topography (Fig. 7d). As at Quchan, we interpret the Rezaabad anticline to be active and located above a blind thrust that marks the southern termination of the Baghan fault. The anticline coincides with the approximate location of the large aftershock on 1929 July 13 near Faruj, which may have occurred on this structure.
Thus, the Baghan fault ends in the SE with an E–W trending thrust, which dies out eastwards over about 10 km; a situation very similar to the Quchan thrust termination. The available evidence suggests the Baghan fault does not cross the Atrak valley.
3.3 Bojnurd earthquakes (1997)
3.3.1 Seismicity
The 1997 February 4 (10:37am GMT) earthquake of Mw 6.4 near Bojnurd was the biggest earthquake to occur in the Kopeh Dagh in the last 50 yr. The epicentral region was ∼30 km north of Bojnurd (Fig. 8a). It was preceded by a foreshock of Mw 5.4 at 09:53 am GMT. Because most people were working outdoors and there was a warning foreshock, casualties were relatively light (∼100 killed), but the villages of Naveh, Yekehshakh, Qezelqan, and Sheikh were completely destroyed (Fig. 8a). Body-wave analysis for the main shock indicates a strike-slip fault, with a small vertical displacement (strike: 326°, dip: 75°, rake: 173°) and centroid depth of 8 km (Jackson 2002). The teleseismic epicentre is shown in Fig. 8(a), and is slightly west of the region of maximum damage. A temporary local seismic network was deployed by the Seismology division of the Geophysics Institute of Tehran University between 11 February and 1997 March 20. The aftershock distribution is elongated along a NW–SE trend, is 10–15 km long, and is centred in the same valley as the most-damaged villages (Fig. 8a). This suggests that the NW–SE, right-lateral nodal plane is likely to be the fault plane. Although, we have no information regarding uncertainties in the aftershock locations, their distribution is consistent with both the region of maximum damage, and the field and structural observations below. The southern limit of the main aftershock distribution is ∼10 km N of the village of Sheikh, which sustained particularly heavy damage. This was probably caused by a directionality effect, with an enhanced near-field SH wave pulse in the direction of rupture propagation, causing an elevated level of damage beyond the end of the fault (Somerville 1997). Direct evidence for this interpretation comes from analysis of strong-motion data recorded by The Building and Housing Research Center in Iran (), which indicate a shorter, but higher amplitude pulse in Bojnurd, ∼30 km south of the epicentre, compared to a longer and lower amplitude pulse at Gifan, ∼20 km north of the epicentre, and Raz, ∼30 km north of the epicentre (for locations, see Fig. 8a), consistent with propagation to the SE. A detailed analysis of the strong motion data, including the comparison between fault-normal and fault-parallel velocities, spectra and durations, is presented elsewhere (Hollingsworth 2006). The teleseismic epicentre (from R. Engdahl, 2005, personal communication; updated catalogue of Engdahl 1998) represents the initial rupture location and, as expected, lies at the NW end of the inferred fault (as discussed below), though it maybe in error by up to 10 km.
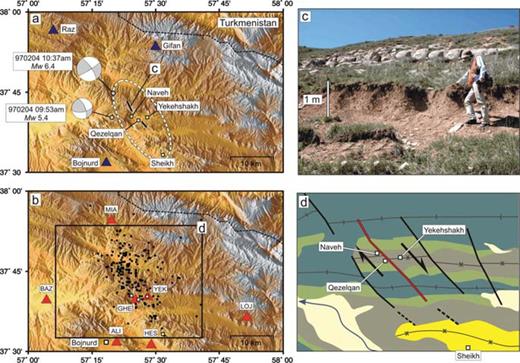
(a) Topographic map of the Bojnurd region. The 1997 foreshock and main shock fault plane solutions from body-wave modelling (Jackson 2002) are shown, with locations from the updated catalogue of Engdahl (1998). Black lines indicate field observations of ground deformations. The white ellipse represents the region of maximum destruction. Blue triangles show the strong motion station locations of Bojnurd, Gifan and Raz. (b) Aftershock locations recorded by the Seismology division of the Geophysics Institute of Tehran University, between 1997 February 11 and March 20. Red triangles are station locations. Black box shows the area in (d). (c) Field photo of ground ruptures north of Naveh. View is looking SW from N37.425° E57.237° (see (a) for location). (d) Simplified geological map of the boxed area in (b) showing the geological fault which we infer ruptured during the 1997 Bojnurd earthquake (red line). Dark green = Tirgan limestone (L. Cretaceous), light green = Sarcheshmeh marls (L. Cretaceous), grey = Sanganeh grey shales and marls (M. Cretaceous), yellow = Cenozoic shallow-marine and terrestrial clastics, and cream = Quaternary river deposits (adapted from Afshar Harb 1987).
3.3.2 Geomorphology
Fieldwork in 2004 and discussions with inhabitants of Naveh and Yekehshakh revealed the locations of ground deformations possibly associated with the 1997 earthquake. North of Naveh, en echelon left-stepping ruptures, up to 1 m high, could be seen running along the mountain side at N37.425° E57.237° for ∼2 km, and with an overall trend of ∼340° (Fig. 8c). They occur on a steep slope and are certainly accentuated by landsliding in places. Further south across the valley, between Qezelqan and Yekehshakh at N37.390° E57.275°, villagers reported similar scarps, directly along strike of those north of Naveh. Satellite imagery and digital topography both indicate a right-lateral strike-slip fault ∼15 km long, displacing bedrock geology along the line of the observed ground deformations. This is a known geological fault (Afshar Harb 1987), where Cretaceous limestones and marls have been offset ∼1 km.
Taken together, the seismological, geomorphological and geological evidence, combined with the localized damage distribution, all suggest the observed ground ruptures were probably of tectonic origin and occurred on the main rupture surface. Thus, we conclude that the 1997 Bojnurd earthquake ruptured on a right-lateral strike-slip fault of similar strike to other faults at Quchan and Shirvan. The fault is not as prominent in the topography or geological structure as the Quchan or Baghan faults, but is typical of others in the region that are also capable of generating earthquakes of Mw 6.4 or greater.
4 Other Active Faults
Having examined the faulting at Quchan, Baghan and Rezaabad, and north of Bojnurd, we now examine evidence in the geomorphology and bed-rock geology for other similar, NW–SE right-lateral strike-slip faults in the region. Two places are worthy of particular attention. Firstly, near the city of Shirvan, a significant population base, is a strike-slip fault system with thrust terminations similar to those described at Rezaabad (on the Baghan fault) and Quchan. Secondly, north of Bojnurd, near Gholaman and the Turkmenistan border, is a system of distributed, subparallel strike-slip faults associated with modern and historical earthquakes.
4.1 Shirvan fault system
West of the Baghan fault a series of similar right-lateral strike-slip faults, although with smaller individual offsets, can be seen in the satellite imagery and digital topography (Fig. 9a). North of Shirvan, one of these strike-slip faults cuts through the bedrock mountains into the Atrak valley and turns, at its southern end, into two E–W thrust faults, the southern one running through Shirvan itself (Fig. 9a and b). At the edge of the Atrak valley the strike-slip fault is seen as a N–S line marking the edge of the topography (Fig. 9b), consisting of uplifted terraces on the eastern side that are incised. The geomorphology is very similar to the Baghan and Quchan faults, and implies a vertical component to the slip, with uplift in the east. The NW–SE fault ends abruptly at Shirvan, where the edge of incision changes to an E–W escarpment. This escarpment is the edge of an anticline, with terrace material on the south side tilted to the south (Fig. 9d), presumably above a buried thrust that dips north. Another, similar escarpment trends to the ESE 3 km north of Shirvan, and is more pronounced, indicating the presence of a buried thrust fault with greater displacement (Fig. 9c). In a gravel quarry on the edge of this northern escarpment (N37.408° E58.034°) a splay of the thrust reaches the surface. The height change across this escarpment is ∼30 m (Fig. 9e). The southern anticline is smaller, with a ∼10 m height change across it (Fig 9e). These two anticlines are made of terrace material, and die away to the east, where they meet the active flood plain. Towards their western junction with the strike-slip fault, their relief above the flood plain increases (Fig. 9f).
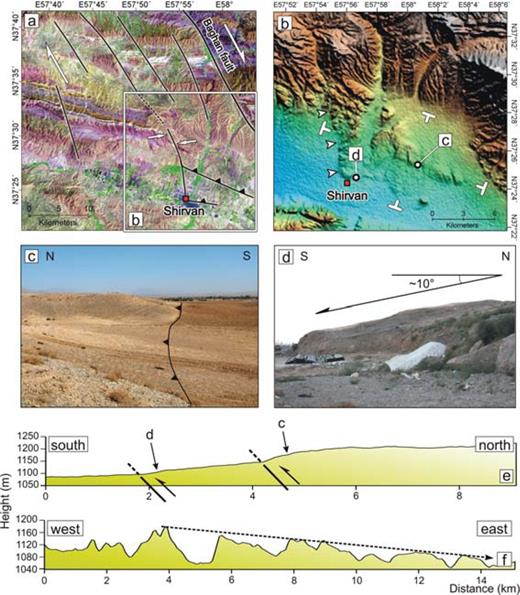
(a) Landsat7 satellite image of the region west of the Baghan fault (black line at the far right). Black lines show faults, which can be seen to offset the geology of the Kopeh Dagh. Notice the stepped right-lateral displacement of the ‘white’ limestone and marls of the Abderaz Formation (U. Cretaceous) at the top of the image. (b) SRTM digital topography of the area around Shirvan. The white arrows show the edge of incision, made by the N–S strike-slip fault which continues S to Shirvan, where it turns into a E–W blind thrust fault. A second more pronounced thrust can also be seen in the topography ∼3 km north of Shirvan. The location of two topographic profiles (e) and (f), and the field photos in (c) and (d) are also shown. (c) Field view looking E at the scarp of the larger northern escarpment. The flat area to the left is an uplifted terrace. (d) Field view looking W of S-dipping terrace material on the S-side of the southernmost Shirvan thrust. (e) N–S topographic profile extracted from SRTM digital topography showing the folds formed by the E–W blind thrusts. (f) E–W profile showing the decrease in topography towards the E, as the thrust dies out.
The strike-slip fault which ends in Shirvan is ∼35 km long, with a right-lateral offset of ∼2 km estimated from the geology using satellite imagery. The fresh geomorphological expression of the thrusts suggests the strike-slip fault is active, and poses a serious seismic hazard to Shirvan.
The Shirvan fault is parallel to the Baghan and Quchan faults. Although it is shorter and with a smaller offset, it is part of a wider zone of similar faults (Fig. 9a), with a combined offset of ∼8 km, which are all visible on the satellite imagery, digital topography and geological maps (Afshar Harb 1987). It is likely that they are all active.
4.2 Gholaman fault system
The town of Gholaman lies in a valley near the Iran–Turkmenistan border, ∼50 km north of Bojnurd and was destroyed by an earthquake (∼M 6.5) in 1810 (Ambraseys & Melville 1982). More recently, a Mw 5.4 earthquake occurred in the same valley on 2000 August 22. Body-wave analysis indicates a very similar mechanism to that of the 1997 Bojnurd earthquake (strike: 133°, dip:-69°, rake: 171°, after Jackson 2002). Fig. 10 shows the location of the earthquake within the valley (10a), and its overall location in the Bakharden–Quchan fault zone (10b).
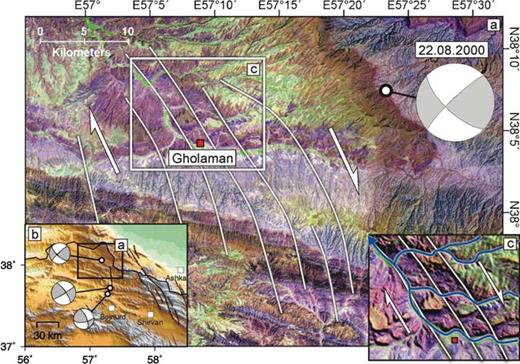
(a) Landsat7 satellite image of the Gholaman area in the high Kopeh Dagh. The teleseismic location of the 2000 August 22. earthquake, from the updated catalogue of Engdahl (1998), is shown, with the body-wave modelled fault plane solution of Jackson (2002). Black lines show a series of right-lateral stepping faults striking NW–SE across the area. (b) Topographic map of the central Kopeh Dagh, with the Gholaman area of (a) highlighted. (c) Close-up view of Gholaman with Landsat7 satellite imagery ‘draped’ over SRTM digital topography. The drainage network has been highlighted in blue. The rivers all show a right-lateral offset where they cross the faults of the Gholaman fault system. This suggests the faults have probably been active in the Quaternary.
Although the teleseismic location does not fall on one particular fault visible on the satellite imagery, the whole region around Gholaman can be seen to be cut by a series of NW–SE right-lateral faults (Fig. 10a). Offsets on individual faults are relatively small, despite their length, but the overall distributed shear in the region is ∼2 km.
Fig. 10(c) shows right-lateral offsets on the rivers which drain west, and then north through the valley. These offsets suggest the Gholaman fault system has been active in the Quaternary, and is capable of producing destructive earthquakes throughout the valley. The Gholaman faults form the western limit of the Bakharden–Quchan fault system. The right-lateral offsets in this area are generally less than those to the east (i.e. Baghan and Quchan faults).
5 DISCUSSION
5.1 The pattern of faulting
The most important feature of the deformation in the Kopeh Dagh, along the NE margin of Iran, is that it varies along strike (Fig. 11). East of ∼59°E there is little evidence for strike-slip faulting, either along the range front in Turkmenistan, or on faults cutting the range itself. Instead, shortening seems to be accommodated by thrusting along the northern and southern edges of the range (Lyberis & Manby 1999; Berberian 2000a). Although the two best-determined earthquake mechanisms (Fig. 1), one in the Turkmenistan foreland near Ashkabad, and the other near the border junction between Iran–Afghanistan–Turkmenistan, show N–S slip vectors, there are insufficient data to see whether the thrusting generally occurs with shortening oblique, or orthogonal to, the range.
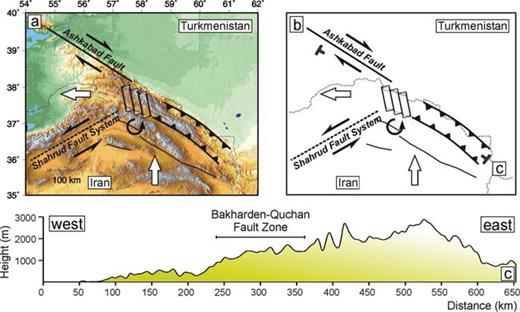
(a) Topographic map of NE Iran, with a schematic tectonic summary. West of ∼58° N–S Iran–Eurasia motion is accommodated by strike-slip on the Ashkabad and Shahrud fault systems, as well as some shortening by orthogonal thrusting. The Bakharden–Quchan fault zone accommodates N–S shortening and E–W extension by rotating anticlockwise as a series of blocks. Thus, the west Kopeh Dagh is being expelled to the west. (b) Simplified view of the tectonics of NE Iran. The location of a topographic profile NW–SE across the Kopeh Dagh is shown. (c) NW–SE topographic profile extracted from SRTM digital topography across the entire Kopeh Dagh range. The highest relief is east of the Bakharden–Quchan fault zone, where shortening occurs only by thrust faulting. To the west of the zone, the relief dies away as strike-slip faulting plays a more important role in accommodating N–S shortening.
Between 57°E and 59°E the dominant structural feature is the zone of NNW–SSE right-lateral strike-slip faults, which cut obliquely across the Kopeh Dagh, but do not continue south of the Atrak valley into the Binalud. The strike-slip faults of this Bakharden–Quchan fault zone end, on their SE sides, in ∼E–W thrust faults that die out to the east. The NW end of the Bakharden–Quchan fault zone marks the SE limit of the clear surface expression of the Ashkabad fault, which bounds the north side of the range west of ∼57°.
Southwest of ∼57°E and the Bakharden–Quchan fault zone, the fault pattern changes again. The eastern end of the Alborz mountains is dominated by a system of NE–SW trending left-lateral strike-slip faults, the Shahrud fault system (Wellman 1966; Jackson 2002). This left-lateral system mirrors the right-lateral NW–SE Ashkabad strike-slip fault in the north and the two of them bound the flat, low-lying, and presumably inactive, Turkmen lowlands on the eastern side of the Caspian Sea. Jackson (2002) note that this geometry allows a westward component of motion of the South Caspian Sea basin, relative to both Eurasia and Iran, in a manner resembling the westward motion of Turkey between the North and East Anatolian Faults. However, the pattern is more complicated than in Turkey, because in NE Iran both the left-lateral Shahrud and right-lateral Ashkabad fault systems are clearly associated with mountains, produced by shortening on thrust faults. The few available thrust faulting earthquake mechanisms in both places suggest that the deformation in both places is spatially separated (or ‘partitioned’) in to parallel thrust and strike-slip faults with orthogonal slip vectors (Jackson 2002), but the overall directions of motion across them are uncertain, and await better coverage with GPS.
A consequence of this change within the Kopeh Dagh, from oblique/orthogonal shortening in the SE to partitioned strike-slip and shortening in the NW, together with the westward ‘expulsion’ of the South Caspian Basin relative to Eurasia, is along-strike elongation of the Kopeh Dagh that must accompany its across-strike shortening. This is a familiar geometric arrangement also seen in other regions such as trench-island arc systems (McCaffrey 1991), the Himalayas (McCaffrey & Nábělek 1998) and the Zagros, where the right-lateral Kazerun, Karebas, Sabzpushan and Sarvestan faults appear at the SE-end of the Main Recent fault (Talebian & Jackson 2002, 2004). This effect is probably responsible for the NW–SE topographic profile along the Kopeh Dagh (Fig. 11c), showing the highest topography in the east, where there is little strike-slip faulting, and a gently declining elevation towards the NW, where strike-slip faulting is more important, and the amount of crustal thickening is presumably less. The along-strike extension is achieved kinematically by the strike-slip faults cutting across the Kopeh Dagh in the Bakharden–Quchan fault zone. The visible offsets on these faults allow a rough quantitative estimate of these various effects.
5.2 Quantitative estimates of the deformation
While it is difficult to estimate the amount of shortening on thrusts and folds, the offsets on the main strike-slip faults of the Bakharden–Quchan system are clearly visible in the satellite imagery, topography and existing geological maps. These strike-slip faults can accommodate along-strike extension in the Kopeh Dagh in two ways, by rotating anticlockwise about a vertical axis, in which case the boundaries of the zone can remain in a constant orientation, or without such rotation, in which case the boundaries of the zone must change orientation with time. Digital topography (Fig. 12) and satellite imagery indicate a change of strike (20–30° anticlockwise) of the linear folds of the Kopeh Dagh, as they enter the Bakharden–Quchan fault system, suggesting that the region is accommodating along-strike extension and across-strike shortening by rotations about a vertical axis. As we show in Section 3.1, the strike-slip faults of the Bakharden–Quchan zone do not continue south into the Binalud, but end in E–W thrusts that die away with distance from the strike-slip termination. This is a characteristic of strike-slip terminations seen elsewhere (e.g. Bayasgalan 1999; Berberian 2000b), which also involve rotations about a vertical axis.
Fig. 13 shows a simplified tectonic representation of the Bakharden–Quchan fault zone, with offsets on the most obvious faults estimated from displaced geology in the satellite imagery, which are often expressed by truncated anticlines (Fig. 14). An illustration of this method is shown in Fig. 15, where the offset across the Quchan fault is measured. Excellent bedrock exposure, visible in the satellite imagery (15a and b) and topography (Fig. 15c), allows a convincing reconstruction of 15 km total right-lateral motion.
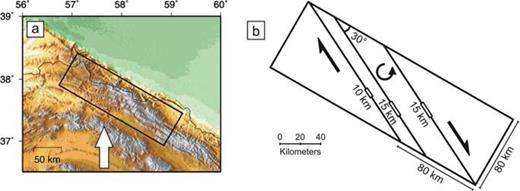
(a) Topographic map of the central Kopeh Dagh, showing the approximate bounds of the Bakharden–Quchan fault zone. (b) Simplified tectonic representation of the Bakharden–Quchan fault zone. This zone has many subparallel faults at a variety of scales. The right-lateral offset on the three largest faults, striking at 30° to the edge of the range, is shown in (b) and in Fig. 14, and will be an underestimate of the total strike-slip offset, as we do not consider the numerous smaller faults which are also present.
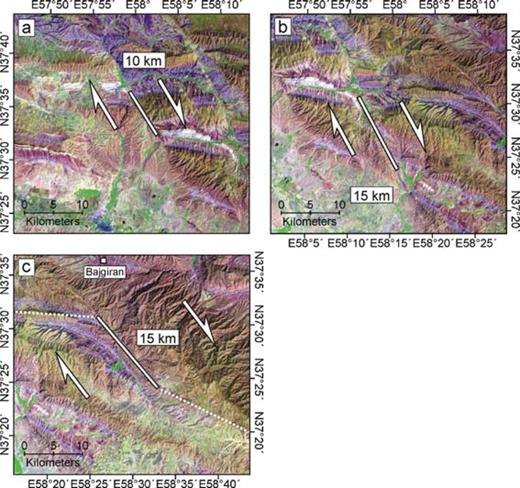
(a) Landsat7 image of a segment of the Baghan fault, where its total offset can be measured as ∼10 km, between the ‘white’ beds of the Abderaz Formation (limestones and marls). (b) Segment of the Quchan fault where ∼15 km of total right-lateral offset can also be measured between ‘white’ beds of the Abderaz Formation. (c) Segment of a right-lateral strike-slip fault 5 km SE of Bajgiran. This fault has no known seismicity, but can be seen clearly on the satellite imagery, digital topography and geological map, and has a total offset of ∼15 km, between ‘purple’ Sarcheshmeh Formation marls.
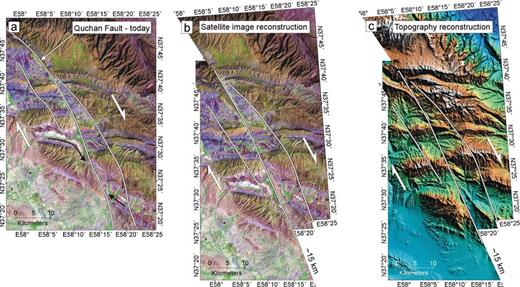
(a) Landsat7 image of the Quchan fault cutting the southern part of the Kopeh Dagh. The main strand of the fault is marked in white, with smaller strands either side. The black arrows highlight ‘white’ Abderaz Formation marls, which are offset across the Quchan fault. On the western-side they are rotated into the fault zone, which represents a minimum 5 km offset. This differs from the interpretation of Huber (1977b) and Afshar Harb (1987) who constructed their maps using air photos, and without the benefit of modern satellite imagery, which better distinguishes between different rock types. (b) Reconstruction of the geology across the Quchan fault indicates ∼15 km total right-lateral offset. (c) Reconstruction of the topography by ∼15 km restores the truncated anticlines to linear E–W features.
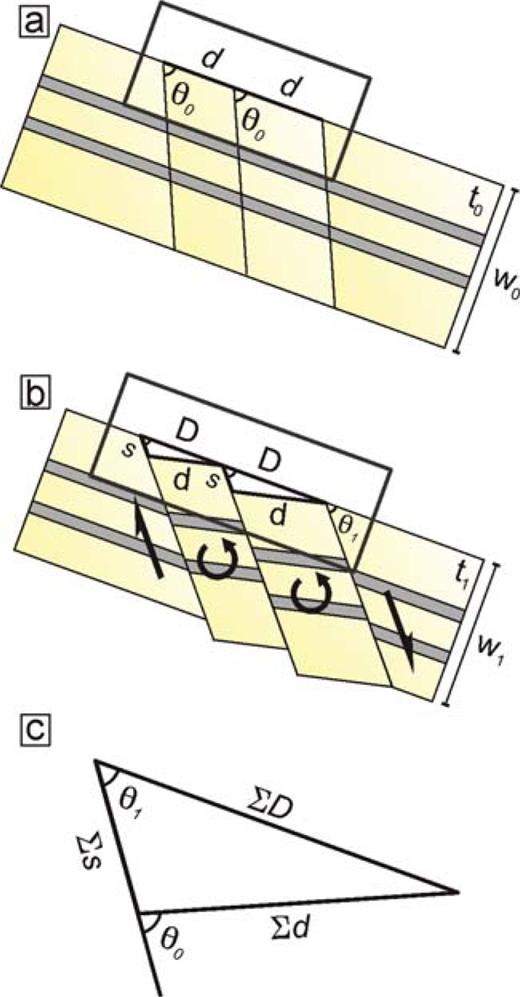
(a) Sketch of the rotating strike-slip system in the central Kopeh Dagh. When the NW–SE faulting starts, it forms an angle (θ0) with the NW–SE boundary of the deforming zone. The original width of each block is d, the sum of which gives the original length of the deforming boundary (Σd). W0 represents the original width of the deforming zone. (b) After offset(s) and rotation of the faults, the new length along the deforming zone is D, and the faults have rotated to a smaller angle (θ1). W1 represents the new width of the deforming zone. (c) Because all the blocks rotate the same amount, we can consider a single triangle with lengths ΣD, Σd and Σs (i.e. the sum of all the right-lateral offsets). If the current angle (θ1) the faults make with the deforming zone boundary is known, and ΣD and Σs, the original length of the deforming boundary (Σd) can be calculated using the cosine rule.
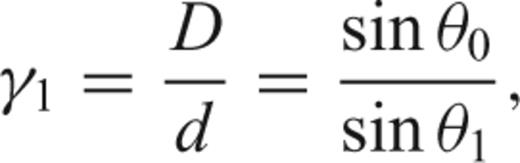
In the case of the Bakharden–Quchan strike-slip zone, the present-day along-strike width (ΣD) is 80 km (Fig. 13) and the current strike, relative to the zone boundary, is θ1= 30°. The original along-strike width d can be calculated for each block from D, θ1 and the observed offset on the fault s using the cosine rule (Fig. 16c), or, since all the blocks appear to have rotated the same amount, we can simply sum the offsets (Σs) and use the total along-strike width (ΣD). This calculation yields an original along-strike width (ΣD) of 50 km for a total offset (Σs) of 40 km, and thus a value for γ1 of 1.6. The associated amount of rotation, calculated from eq. (1), would be 23°, which agrees with the observed 20–30° (see Fig. 12). Thus, the total strike-slip offset and the rotation are both consistent with an along-strike extension of γ1= 1.6 or 30 km. Since the rotating strike-slip faults preserve surface area, the extension of the zone by 30 km to yield its present day width of 80 km and length of 80 km, implies an across-strike shortening of 50 km.
These estimates are, of course, approximate. As in the case of rotating normal faults, they ignore the obvious problem of what happens at the transition from rotating to non-rotating blocks; which cannot be achieved by rigid block motion. Some internal deformation of the blocks must be required. Nor is it likely that surface area is really preserved, as it is quite likely that some thrust component of motion accompanies the strike-slip. Furthermore, the total strike-slip offset based on the obvious big faults probably underestimates the real total, as some apparently happens on smaller, distributed faults. Nonetheless, the agreement between the γ1 values calculated from the offsets and the rotations suggest that the total offset is approximately correct. The history of estimating γ1 from rotating fault blocks in sedimentary basins, also suggests that these simple calculations are likely to be correct to within about 20 per cent (White 1990).
There is little with which to directly compare these estimates. The along-strike extension must be accommodated by slip on the Ashkabad fault to the NW and the motion of the South Caspian Basin relative to Eurasia. There are no direct estimates of strike-slip offset on the Ashkabad fault, as there is little to see on the featureless plain that bounds its NE side. A westward displacement of the South Caspian Basin by ∼30 km can certainly be accommodated by shortening on its margins to the north, on the Apsheron Sill, and in the west beneath the Talesh mountains (Jackson 2002). Consistent with this, Allen (2003) estimated ∼30–35 km left-lateral motion on the WNW–ESE Mosha fault, in the central Alborz. Although Lyberis & Manby (1999) estimate a strike-slip offset of 35 km on the Ashkabad Fault, this is obtained by resolving their structural estimate of 75 km N–S shortening in the western Kopeh Dagh into its pure strike-slip and thrusting components. From the available GPS data, the preliminary estimate of shortening between station KASH (Fig. 1b) and Turkmenistan is ∼7 mma−1 (Vernant 2004). If this is resolved onto its pure strike-slip and thrusting components, the Ashkabad fault slips at ∼3.5 mma−1, and shortening across the range is ∼6 mma−1. This suggests there is more shortening across the range, than extension along its strike. The block rotations discussed above can account for ∼30 km along-strike extension, and ∼50 km across-strike shortening, corresponding to a N–S motion of ∼60 km. Lyberis & Manby (1999) estimate ∼75 km N–S shortening across the western Kopeh Dagh, from line-balanced sections. Allen (2003) estimate 25–30 per cent shortening across the Alborz-Binalud, based on their structural cross-section, which amounts to ∼30 km at the longitude of Tehran. Walker & Jackson (2004) estimate about 70–95 km of Late Tertiary N–S right-lateral shear between the Lut desert and Afghanistan, which would require a similar amount of shortening in NE Iran, and is a value similar in magnitude to that which we estimate from the rotating block model described above. However, our model certainly underestimates the total N–S shortening in NE Iran, as some additional shortening must have occurred to form the fold axes that are offset in the Kopeh Dagh, as well as the thrusts in the Binalud and Siah-Kuh mountains to the south. The discrepancy between the estimate of Walker & Jackson (2004) and our value for shortening across the central Kopeh Dagh is 10–35 km. Although no detailed structural sections across the range have been undertaken, folding across the central Iranian Kopeh Dagh, between 57.4°E 37.35°N and 57.75°E 37.9°N, accounts for a minimum 10 per cent N–S shortening before the onset of strike-slip faulting (based on the section by Afshar Harb 1987). When considering the entire range, this gives a minimum 10 km pre-strike-slip N–S shortening. Therefore, our minimum estimate of 70 km total N–S shortening across the central Kopeh Dagh is consistent with other studies.
The only real indication of possible rates of shortening in NE Iran is from the very sparse GPS data. Station KASH, south of the Binalud (Fig. 1c), currently moves north with respect to Eurasia at ∼7 mma−1. If all that shortening were concentrated in the Kopeh Dagh it would take about 10 Ma to achieve the amount of shortening we estimate (i.e. ∼70 km). This rises to ∼14 Ma when considering the 30 km estimate for shortening across the Alborz-Binalud (Allen 2003). This is not unreasonable and is within the rather loose geological constraints, which date the formation of the Kopeh Dagh to ‘post-Early-to-Middle Oligocene’ (or post ∼30 Ma) (Berberian & King 1981). This, in turn, yields an approximate slip rate for the Baghan fault of ∼1 mma−1, Quchan fault of ∼1.5 mma−1 and Bajgiran fault of ∼1.5 mma−1, based on their respective 10, 15 and 15 km offsets (Fig. 14).
6 Conclusions
The most important result of this work is the identification of an array of active right-lateral strike-slip faults that obliquely cut the Kopeh Dagh and which are almost certainly responsible for major destructive earthquakes in both modern and historical periods. These faults have identifiable ends, where they turn into thrusts, which indicate that they are restricted to the Kopeh Dagh range and do not continue beyond it. Their significance to the regional tectonics appears to be in achieving an across-strike shortening and along-strike extension by rotating about vertical axes. The amount of along-strike extension is ∼30 km, and is taken up by the westward component of motion of the South Caspian Basin relative to both Central Iran and Eurasia. The total N–S motion represented by these rotating strike-slip faults is about 60 km, a value similar to the Late Quaternary N–S right-lateral shear between Central Iran and Afghanistan farther south. From the limited GPS data currently available, these motions could be achieved in about 10 Ma, at present-day rates. This makes the Kopeh Dagh comparable with the Greater Caucasus, differing from other active regions in the Middle East, such as the Zagros, Alborz, North and East Anatolian faults, where only 3–7 Ma are needed to account for the total convergence of Arabia with Eurasia (Allen 2004).
Acknowledgments
We thank Julian Bommer and John Alarcón for their help with interpreting the strong-motion data for the 1997 Bojnurd earthquake. Eric Bergman and Robert Engdahl kindly provided their most recent earthquake locations. Morteza Talebian provided helpful discussions, as did Eric Fielding, Brian Emmerson, Matt Miller and Alex Copley. Premalatha Balan gave helpful insights regarding DEMs. We thank the Geological Survey of Iran for organising all aspects of the fieldwork, and for their dedicated approach to understanding the active tectonics of their country. We are particularly grateful to Mr Taheri, Nasser Naimi and Nassir Nadheri of GSI Mashad, and Dr Ghorashi, Dr Bahroodi, Reza Tajik, and Asghar Dolati of GSI Tehran, who all helped with various aspects of this work. Mark Allen and Manuel Berberian are thanked for their helpful reviews. Various images in this paper were created using the public domain Generic Mapping Tools (GMT) software (Wessel & Smith 1998). This is Cambridge Earth Science contribution ES 8425.
References
