


Abstract
Plant senescence is regulated by a coordinated genetic program mediated in part by changes in ethylene, abscisic acid (ABA), and cytokinin content. Transgenic plants with delayed senescence are useful for studying interactions between these signaling mechanisms. Expression of ipt, a cytokinin biosynthetic gene from Agrobacterium tumefaciens, under the control of the promoter from a senescence-associated gene (SAG12) has been one approach used to delay senescence. We transformed petunia (Petunia x hybrida cv V26) with PSAG12-IPT. Two independently transformed lines with extended flower longevity (I-1-7-22 and I-3-18-34) were used to study the effects of elevated cytokinin content on ethylene synthesis and sensitivity and ABA accumulation in petunia corollas. Floral senescence in these lines was delayed 6 to 10 d relative to wild-type (WT) flowers. Ipt transcripts increased in abundance after pollination and were accompanied by increased cytokinin accumulation. Endogenous ethylene production was induced by pollination in both WT and IPT corollas, but this increase was delayed in IPT flowers. Flowers from IPT plants were less sensitive to exogenous ethylene and required longer treatment times to induce endogenous ethylene production, corolla senescence, and up-regulation of the senescence-related Cys protease phcp1. Accumulation of ABA, another hormone regulating flower senescence, was significantly greater in WT corollas, confirming that floral senescence was delayed in IPT plants. These results extend our understanding of the hormone interactions that regulate flower senescence and provide a means of increasing flower longevity.
Flower senescence represents the last stage of floral development and results in wilting or abscission of whole flowers or flower parts (Stead and Van Doorn, 1994). The process, like whole plant senescence, is an active one that is executed via a defined genetic program. Once a flower has been pollinated or is no longer receptive to pollination, the programmed senescence of petals allows for the removal of a metabolically costly tissue whose sole role in sexual reproduction is to attract a pollinator. In many flowers, pollination-induced petal senescence results in the degradation of macromolecules from a structure that is no longer needed and allows for the remobilization of nutrients to developing tissues like the ovary (Stead, 1992).
Senescence is accompanied by changes in endogenous ethylene, abscisic acid (ABA), and cytokinins, and these changes are believed to mediate signaling events that control the process. In many flowers, senescence is accompanied by a burst of ethylene production, and treatment with exogenous ethylene accelerates ethylene production and corolla senescence (Borochov and Woodson, 1989). Chemical or genetic inhibition of ethylene biosynthesis or perception also delays flower senescence (Veen, 1979; Fujino et al., 1980; Savin et al., 1995; Wilkinson et al., 1997; Bovy et al., 1999). In ethylene-insensitive plants like daylily, ABA is thought to be the primary hormonal regulator of flower senescence, and exogenous application of ABA accelerates visual senescence symptoms and regulates transcription of senescence-related genes (Panavas et al., 1998). In ethylene-sensitive flowers like carnation (Dianthus caryophyllus), ABA accelerates flower senescence by increasing the endogenous production of ethylene (Ronen and Mayak, 1981).
In contrast to the actions of ethylene and ABA, cytokinins delay senescence in vegetative and floral tissues (Van Staden et al., 1988). An inverse relationship between cytokinin content and senescence occurs in some flowers (Van Staden et al., 1988). Cytokinin content in roses (Mayak et al., 1972), carnation (Van Staden and Dimalla, 1980), and Cosmos sulfureus (Saha et al., 1985) is greatest in young flowers and decreases during corolla opening and development. Rose varieties with longer vase lives have been reported to contain more cytokinins than those with shorter vase lives (Mayak and Halevy, 1970).
Results from exogenous application of cytokinins in vase solutions have been variable (Weaver, 1972; Halevy and Mayak, 1981; Baker, 1983). Cytokinin application delayed senescence in carnations (MacLean and Dedolph, 1962; Heide and Oydvin, 1969; Mayak and Dilley, 1976; Mayak and Kofranek, 1976; Upfold and Van Staden, 1990), roses (Mayak and Halevy, 1970, 1974), Gerbera sp. (Van Meeteren, 1979), and petunia (Petunia x hybrida; Taverner et al., 1999; M.L. Jones, unpublished data), but the response depended on the type and concentration of cytokinin and the stage of flower development.
Interactions between cytokinins and other hormones during senescence have been less studied. Cytokinin applications to carnation flowers delay senescence and are associated with reduced ethylene biosynthesis and decreased sensitivity to ethylene (Eisinger, 1977; Mor et al., 1983; Cook et al., 1985). A more recent study suggested that ethylene production during petunia senescence promotes cytokinin degradation and inactivation by O-glucosylation (Taverner et al., 1999). The sensitivity of flowers to ethylene increases as they mature, and this sensitivity change also has a role in the initiation of senescence (Nichols, 1968; Barden and Hanan, 1972; Mayak et al., 1977; Halevy and Mayak, 1981; Woodson and Lawton, 1988).
Until very recently, no genes involved in cytokinin biosynthesis had been identified from plants (Kakimoto, 2001; Takei et al., 2001; Zubko et al., 2002; Sun et al., 2003). Plants with altered cytokinin content have been generated by transformation with the Agrobacterium tumefaciens cytokinin biosynthetic gene, ipt (Medford et al., 1989). The ipt gene encodes isopentenyl transferase, an enzyme that catalyzes the condensation of dimethylallylpyrophosphate and 5′-AMP to isopentenyladenosine (iPA) 5′-phosphate. This is assumed to represent a rate-limiting step in cytokinin biosynthesis because the introduction of the ipt gene into plants results in increased accumulation of many forms of cytokinins (Akiyoshi et al., 1984; Barry et al., 1984; Morris, 1995). Very low increases in endogenous cytokinin content of transgenic plants have been associated with pleiotropic effects including inhibition of root growth, stunted shoots, reduced apical dominance, increased stem diameter, and retarded leaf senescence (Schmulling et al., 1999).
An approach to target the expression of ipt to senescing tissues with the promoter from SAG12, a senescence-associated gene from Arabidopsis, demonstrated a direct effect of cytokinins on plant senescence (Gan and Amasino, 1995). Numerous plants transformed with SAG12-IPT have significant delays in leaf senescence (Gan and Amasino, 1995; Jordi et al., 2000; Zhang et al., 2000; McCabe et al., 2001). Studies with these plants have confirmed that changes in cytokinin content impact the initiation of leaf senescence, nitrogen partitioning, photosynthetic enzyme activities, and chlorophyll degradation during senescence (Wingler et al., 1998; Dervinis, 1999; Jordi et al., 2000; McCabe et al., 2001). Sustained cytokinin content also enhances flooding and drought tolerance (Dervinis, 1999; Zhang et al., 2000). Although there are reports of SAG12-IPT plants with enhanced flower longevity (Zhang et al., 2000; Schroeder et al., 2001), there has been no investigation of the effects of endogenous cytokinin levels on the regulation of flower senescence beyond these phenotypic observations.
We used transgenic petunias expressing the PSAG12-IPT chimeric gene to determine the effects of increased cytokinin levels in petals on flower senescence and to investigate the interactions between cytokinin accumulation and ethylene production, ethylene sensitivity, and ABA accumulation. Comparisons with non-transformed control plants demonstrated interactions between these signaling molecules that resulted in significantly delayed floral senescence.
RESULTS
Analysis of SAG12-IPT Transgenic Petunias
Two independently transformed lines with increased flower longevity were identified. These two transgenic lines, designated I-1-7-22 and I-3-18-34 (or IPT22 and IPT34) also showed delayed leaf senescence and contained a single copy of the ipt transgene (Dervinis, 1999). ELISA confirmed that 100% of the seedlings in the T4 generation contained the nptII protein, indicating that both lines were homozygous for the transgene construct (data not shown). PCR confirmed the presence of the ipt transgene in IPT22 and IPT34 plants and its absence in wild-type (WT) plants (data not shown).
The first visual symptom of flower senescence, corolla wilting, was observed in unpollinated WT flowers by 160 h after anthesis (Table I). Pollination accelerated the onset of senescence, and pollinated WT flowers were senescent by 51 h after pollination (hap). Naturally senescing IPT22 and IPT34 flowers did not show symptoms of wilting until 303 or 284 h after anthesis, respectively. This represented a 6-d increase in bloom display life over WT flowers. Senescence was not significantly accelerated by pollination in IPT22 or IPT34 flowers, which wilted at 294 and 272 hap, respectively.
Time to visible wilting of WT and SAG12-ipt flowers following pollination and during natural age-related senescence
Data represents the average of three independent experiments including five flowers each (n = 15).
Plant Line | Time to Wilting after Pollination | Time to Wilting during Natural Senescence | |
|---|---|---|---|
| h ± se | |||
| WT | 51.2 ± 8.2 | 160.0 ± 22.6 | |
| IPT22 | 294.4 ± 26.9 | 303.6 ± 25.5 | |
| IPT34 | 272.4 ± 34.6 | 284.8 ± 24.8 | |
Plant Line | Time to Wilting after Pollination | Time to Wilting during Natural Senescence | |
|---|---|---|---|
| h ± se | |||
| WT | 51.2 ± 8.2 | 160.0 ± 22.6 | |
| IPT22 | 294.4 ± 26.9 | 303.6 ± 25.5 | |
| IPT34 | 272.4 ± 34.6 | 284.8 ± 24.8 | |
The ipt gene was up-regulated by pollination in IPT22 and IPT34 corollas (Fig. 1). Initial experiments with RNA gel blots using 10 to 20 μg of total RNA and 32P-labeled ipt probe were not sensitive enough to detect ipt message in corollas after pollination (data not shown). Fluorescence-based quantitative reverse transcription (RT)-PCR (real time RT-PCR) was therefore used to determine relative levels of ipt transcript in IPT22 and IPT34 corollas at various times after pollination. Ipt transcript was detected in corollas from these plants as early as anthesis (0 hap). Similar increases in ipt transcript abundance were detected from 0 to 12 hap in both IPT22 and IPT34 corollas. Ipt transcript accumulation increased at 18 hap in IPT22 corollas. Transcript levels continued to increase at 24 hap and then decreased at 36 hap. An increase in ipt mRNAs was detected at 48 hap in IPT34 corollas. Both transgenic lines had the largest accumulation of ipt mRNAs at 48 hap. This represented a 60-fold increase in the level of ipt transcripts detected at anthesis (0 hap). Transcript abundance then decreased at 72 hap in both IPT22 and IPT34 corollas. Under the experimental conditions described (see “Materials and Methods”) ipt mRNAs were not detected in WT corolla samples.
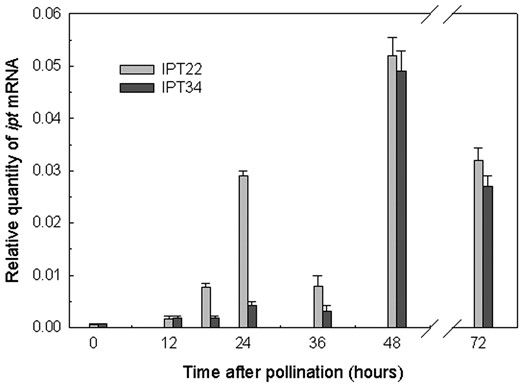
Real-time PCR quantification of relative ipt mRNA levels in IPT22 and IPT34 corollas at 0, 12, 18, 24, 36, 48, and 72 hap. Ipt mRNA was quantified relative to an external RNA standard curve and normalized using actin as an endogenous control. All samples were amplified in triplicate. Data presented are the average of the three replications ± se.
Enhanced cytokinin levels in transgenic corollas confirmed that the ipt gene detected in IPT22 and IPT34 corollas was producing a functional isopentenyltransferase. At anthesis (0 hap), corollas from both transgenic lines had higher cytokinin content than WT flowers (Table II). Although the predominant cytokinins that accumulated in IPT corollas after pollination were zeatin (Z) and Z riboside (ZR), the difference between WT and transgenic flowers at 0 hap was due to quantities of iPA and isopentenyladenine (iP). The quantities of iPA-type cytokinins in transgenic corollas at 0 hap were greater than twice that measured in WT corollas. Z and ZR increased in IPT22 and IPT34 corollas at 18 hap. The change in ZR content from 12 to 18 hap represented a 10-fold increase in IPT22 corollas compared with a 2-fold increase in IPT34 corollas. Total cytokinins were highest in both transgenic lines at 48 hap. Very low levels of ZR were detected in WT corollas after pollination but Z was undetectable. At 48 hap, total cytokinin content of IPT corollas was 25-fold greater than that measured in WT plants. Total cytokinins in both transgenic lines decreased at 72 hap. The cytokinin content of WT corollas was lowest at 72 hap when flowers were completely wilted.
Cytokinin content of petunia corollas following pollination (hap) and ethylene treatment (het)
Six corollas were collected from IPT22, IPT34, and WT flowers. Total cytokinins included Z, zeatin; ZR, zeatin riboside; iP, isopentenyl adenine; iPA, isopentenyl adenosine; Z-9-G, zeatin-9-glucoside; diHZ, dihydrozeatin; diHZ-9G, dihydrozeatin-9-glucoside; diHZR, dihydrozeatin riboside; and iP-9G, isopentenyl-9-glucoside.
Treatment | Plant Line | Total Cytokinins | Z | ZR | iP | iPA |
|---|---|---|---|---|---|---|
| ng g-1 dry wt | ||||||
| 12 het | WT | 50.24±3.3a | ndb | 8.12±0.28 | 12.6±1.93 | 9.72±1.14 |
| IPT22 | 2,830.45±626.1 | 758.74±225.6 | 2,014.85±711.65 | 12.65±1.49 | 15.11±0.25 | |
| IPT34 | 2,442.39±366.5 | 789.34±95.73 | 1,597.76±331.4 | 14.64±0.38 | 20.76±0.30 | |
| 0 hap | WT | 24.55±1.1 | nd | 6.83±0.30 | 6.66±0.28 | 6.68±0.42 |
| IPT22 | 38.36±2.5 | nd | 7.25±0.40 | 10.48±0.62 | 14.71±1.46 | |
| IPT34 | 43.63±2.5 | nd | 5.41±0.32 | 11.35±0.88 | 17.32±1.12 | |
| 12 hap | WT | 31.07±0.7 | nd | 4.03±0.37 | 12.85±0.57 | 4.03±0.34 |
| IPT22 | 49.93±0.3 | nd | 12.32±0.72 | 9.98±0.03 | 6.82±0.43 | |
| IPT34 | 41.54±4.0 | nd | 3.66±0.78 | 13.13±1.08 | 10.56±1.06 | |
| 18 hap | WT | 20.55±0.9 | nd | 3.7±0.72 | 9.34±0.15 | 5.1±0.44 |
| IPT22 | 176.62±12.6 | 31.12±4.46 | 118.02±6.19 | 11.17±0.82 | 11.15±0.86 | |
| IPT34 | 33.65±1.4 | 2.63±0.64 | 8.35±0.39 | 10.15±0.21 | 9.11±0.24 | |
| 24 hap | WT | 29.83±0.9 | nd | nd | 11.0±0.18 | 2.95±0.13 |
| IPT22 | 323.58±33.8 | 162.22±29.51 | 126.85±15.71 | 9.84±0.74 | 8.58±0.79 | |
| IPT34 | 80.24±3.5 | 24.2±0.51 | 35.33±2.7 | 10.65±1.72 | 7.11±0.81 | |
| 36 hap | WT | 19.35±1.9 | nd | nd | 10.76±0.99 | 5.35±0.57 |
| IPT22 | 61.7±2.8 | 4.43±0.26 | 20.17±1.27 | 15.83±1.04 | 14.94±1.49 | |
| IPT34 | 74.53±1.5 | 6.59±0.67 | 31.81±1.5 | 14.29±0.81 | 17.51±0.35 | |
| 48 hap | WT | 25.58±2.1 | nd | 1.18±0.13 | 11.11±0.82 | 1.59±0.17 |
| IPT22 | 721.68±54.4 | 180.65±28.86 | 502.64±77.01 | 6.6±0.29 | 5.0±0.08 | |
| IPT34 | 689.85±25.2 | 260.8±39.89 | 390.4±52.0 | 7.32±1.23 | 7.04±0.87 | |
| 72 hap | WT | 7.055±0.9 | nd | nd | 4.75±0.89 | 4.41±0.37 |
| IPT22 | 475.73±23.2 | 211.63±17.35 | 228.98±14.64 | 13.99±2.31 | 12.52±1.3 | |
| IPT34 | 254.78±20.9 | 112.46±6.75 | 127.05±17.87 | 5.26±0.74 | 5.54±2.06 |
Values represent the average of three replicates ± se
nd, Not detectable
Effects of Elevated Cytokinin Levels on Ethylene Production and Sensitivity
In addition to accelerating corolla wilting, pollination induced ethylene production from the corolla (Fig. 2A). WT corollas had a peak of ethylene production at 24 hap followed by a larger peak (29 nL g-1 h-1), coinciding with corolla wilting, at 48 hap. This first ethylene peak was not detected in IPT22 corollas, and ethylene production was delayed until 48 hap. IPT34 corollas had a slight increase in ethylene production at 24 hap followed by a larger peak at 48 hap that was similar to that detected from IPT22 corollas. Flowers from IPT22 and IPT34 did not show visual symptoms of flower senescence until 288 and 264 hap, respectively (Fig. 2B). Expression of the ethylene biosynthetic gene 1-aminocyclopropane-1-carboxylic acid (ACC) oxidase (phaco1) confirmed that the induction of elevated ethylene biosynthesis by pollination was delayed in transgenic IPT flowers (Fig. 2C). Phaco1 transcript was undetectable in corollas at anthesis, but a large increase was detected at 24 hap in WT. This up-regulation was delayed until 48 hap in IPT22 corollas. Phaco1 mRNAs increased in IPT34 corollas at 24 hap, but levels were only 25% of those detected in WT corollas at the same time. Transcript abundance was greatest at 48 hap in WT, IPT22, and IPT34 corollas.
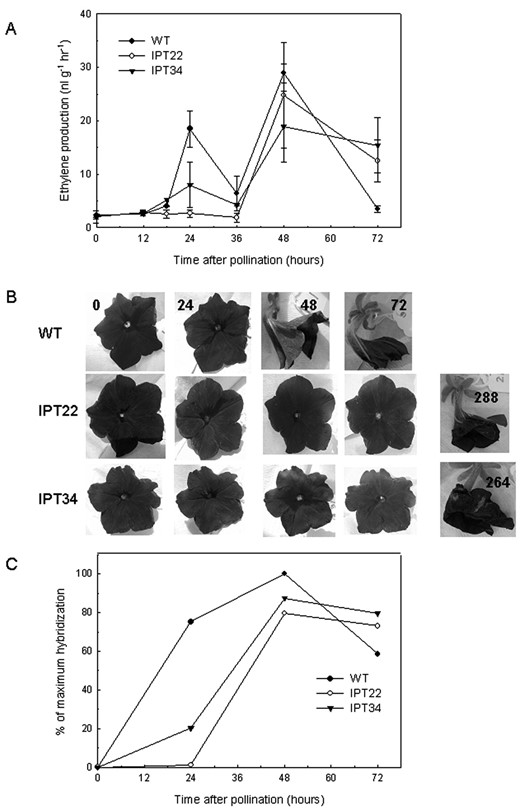
Pollination-induced ethylene production and senescence in WT versus IPT22 and IPT34 flowers. A, Ethylene production from corollas at various times after pollination. Values presented are the average of three independent experiments ± se (n = 12). B, Visual appearance of WT, IPT22, and IPT34 flowers after pollination. C, Changes in the mRNA levels of the ethylene biosynthetic gene ACC oxidase (phaco1). Signal intensity was quantified, and all values were normalized for RNA loading differences using ribosomal RNA. The sample with the highest hybridization signal was set at 100%, and all other values are presented relative to that sample.
WT corollas produced elevated ethylene levels following 9 and 12 h of exposure to 2 μL L-1 ethylene treatment, whereas flowers from transgenic plants required extended exposure to ethylene to increase ethylene production (Fig. 3A). Ethylene production by IPT22 corollas increased slightly after 24 h of treatment. Elevated levels of ethylene production greater than 50 nL g-1 h-1 were detected from IPT34 corollas after 36 h of treatment. After 48 h of ethylene treatment, WT corollas were beginning to show symptoms of corolla wilting, whereas IPT22 and IPT34 corollas were not (data not shown).
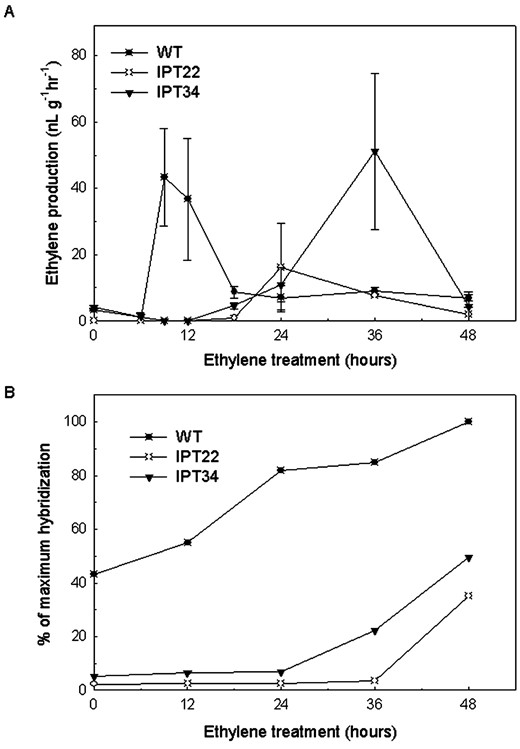
Detached flowers were treated with 2 μL L-1 ethylene for 0, 6, 9, 12, 18, 24, 36, and 48 h to compare the sensitivity of WT and IPT corollas to ethylene. Control flowers were treated with air (data not shown). A, Ethylene production from WT, IPT22 and IPT34 corollas after ethylene treatment. Experiments were conducted three times with similar results. Data presented are for one experiment and represent an average of four ethylene measurements ± se. B, Changes in the mRNA levels of the senescence-related Cys protease, phcp1,in corollas after treatment of flowers with ethylene. Signal intensity was quantified, and all values were normalized for RNA loading differences using ribosomal RNA. The sample with the highest hybridization signal was set at 100%, and all other values are presented relative to that sample.
The expression of the ethylene up-regulated Cys protease, phcp1, was used as a molecular indicator of responsiveness to ethylene (Fig. 3B). Phcp1 transcripts were detected at basal levels in untreated (0 h) corollas. The abundance of phcp1 transcripts at 0 h was greatest in WT corollas, whereas transcripts were just barely detectable in IPT22 and IPT34 corollas. Increases in phcp1 accumulation were detected in WT corollas following 12 h of treatment with 2 μL L-1 ethylene. In IPT22 flowers, 48 h of ethylene treatment was needed before increases in phcp1 transcripts were detected, whereas increases in phcp1 abundance were detected after 36 h in IPT34 corollas. WT and IPT flowers treated with air for 48 h (controls) were not producing detectable levels of ethylene, and the abundance of phcp1 mRNAs was similar to that detected in 0 h corollas (data not shown).
Treating flowers with 2 μL L-1 ethylene for 12 h did not result in noticeable wilting in any of the lines (Fig. 4, 0 panel). These flowers were then left on the laboratory bench in air to observe the effects of the ethylene treatment on senescence. WT flowers wilted 48 h after removal from ethylene, whereas IPT flowers did not wilt until 96 h. WT flowers (air controls) that were never treated with ethylene wilted at 72 h. IPT controls started to show signs of senescence at 96 h but were not as severely wilted as the IPT flowers treated with ethylene.
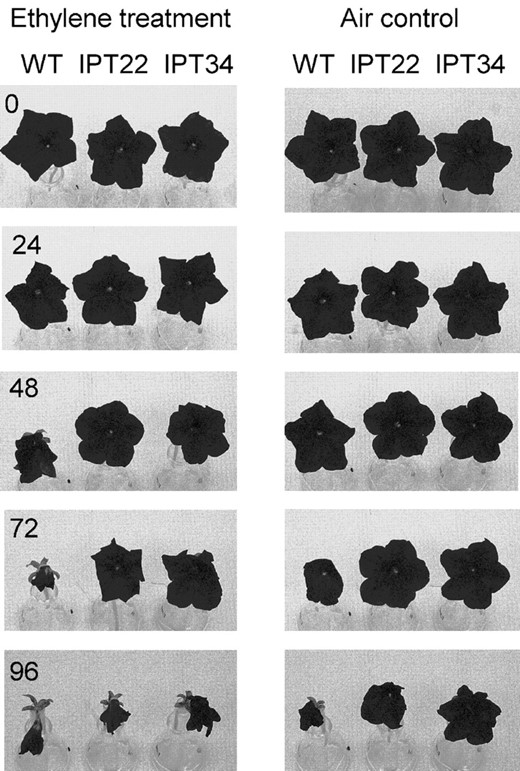
Detached WT, IPT22, and IPT34 flowers were treated with 2 μL L-1 ethylene or air (control) for 12 h. After treatment, flowers were left on the laboratory bench and visual symptoms of senescence (i.e. corolla wilting) were assessed every 24 h. Zero represents the flowers immediately following the 12 h treatment.
The 12-h ethylene treatment did not affect total cytokinin content of WT corollas, but resulted in a 50-fold increase in cytokinin levels in IPT corollas (Fig. 5A). This increase was largely due to increases in ZR and Z (Table II). Ethylene application resulted in a large increase in the accumulation of ipt transcripts in both IPT22 and IPT34 corollas (Fig. 5B).
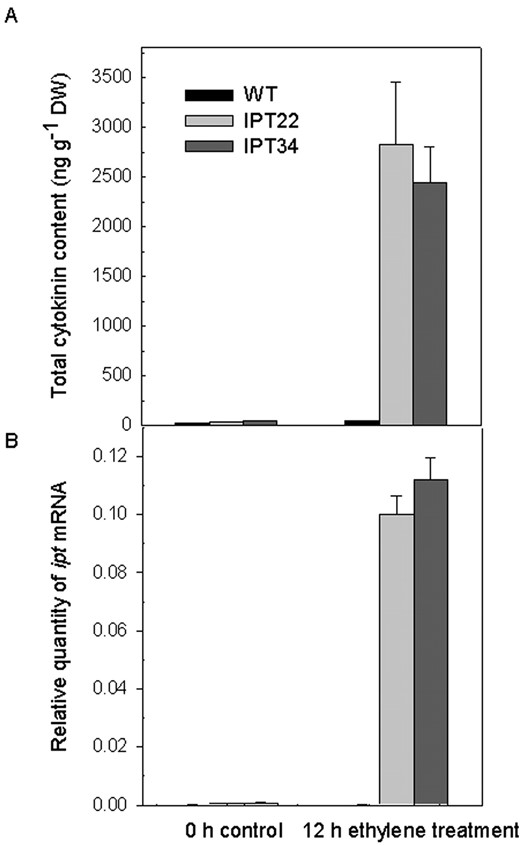
Changes in total cytokinin content (A) and the relative quantity of ipt mRNAs in corollas (B) after treatment of WT, IPT22, and IPT34 flowers with 2 μL L-1 ethylene for 0 or 12 h. Values represent the average of three replicates ± se.
Effects of Elevated Cytokinin Levels on Endogenous ABA
To determine whether there were differences in endogenous ABA concentration in WT and IPT lines, ABA was quantified in corollas following pollination (Fig. 6). ABA levels increased in WT corollas beginning at 24 hap and increased to greater than 1,000 ng g-1 dry weight at 72 hap. Similar increases were not detected in the transgenic lines, and maximum levels only reached 221 and 111 ng g-1 dry weight at 72 hap in IPT22 and IPT34, respectively.
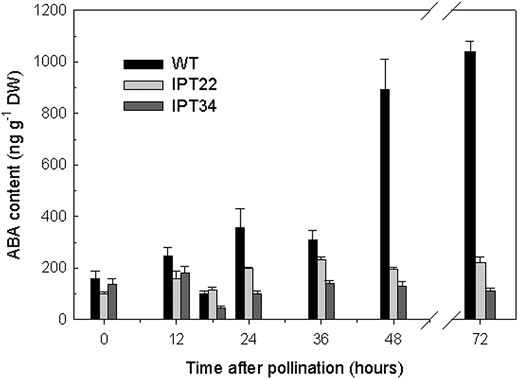
Quantification of endogenous ABA levels in WT, IPT22, and IPT34 corollas at 0, 12, 18, 24, 36, 48, and 72 hap. Values represent the average of three replicates ± se.
DISCUSSION
The exogenous application of cytokinins has been shown to delay flower senescence, but the effects have been variable and depend on concentration, cytokinin form, pulse versus continuous application, or the stage of development at which the flower is treated (Eisinger, 1977; Mor et al., 1983; Kelly et al., 1985; Bosse and Van Staden, 1989; Upfold and Van Staden, 1990; Taverner et al., 1999). These studies are complicated by the fact that applied cytokinins are metabolized in the stem, leaves, and flowers, and the majority of the cytokinins that are applied via a vase solution remain in the stem and never reach the flower (Kelly et al., 1985). Transgenic plants with altered cytokinin synthesis have been used to overcome the problems associated with uptake, translocation, and metabolism of exogenously applied cytokinins. Experiments using plants that express the bacterial gene encoding IPT, the enzyme that catalyzes the first step in cytokinin biosynthesis, have confirmed the role of cytokinins in senescence. The autoregulatory senescence-specific expression system, PSAG12-IPT, has allowed researchers to investigate the role of cytokinins in senescence unencumbered by the developmental and morphological abnormalities normally associated with constitutive overproduction of cytokinins (Gan and Amasino, 1996). The SAG12 promoter is activated at the onset of senescence, increasing the synthesis of cytokinins and effectively inhibiting senescence. These cytokinins attenuate the promoter, thereby preventing the overproduction of cytokinins. Although the sag12 gene from Arabidopsis was identified during a screen for genes that were up-regulated during leaf senescence, it is also up-regulated in petals (Quirino et al., 1999; Grbic, 2002). SAG12 therefore confines the expression of the ipt gene to vegetative and floral tissues where senescence has been initiated.
We used petunia plants transformed with PSAG12-IPT to quantify the impact of ipt expression on cytokinin accumulation in petunia corollas and to investigate the interactions of cytokinins with ethylene biosynthesis, ethylene sensitivity, and endogenous ABA levels during the progression of flower senescence. These plants exhibited significant delays in flower senescence associated with increases in ipt transcript abundance and corolla cytokinin content.
Despite senescence-specific regulation of the SAG12 promoter in Arabidopsis, the promoter was not as tightly regulated in petunia. Both IPT22 and IPT34 petunias had detectable ipt transcripts and elevated cytokinin levels in non-senescing corollas (0 hap). Transgenic plants from the line IPT34 had a normal phenotype with the exception of delayed leaf and flower senescence, whereas IPT22 plants had other cytokinin phenotypes including decreased adventitious rooting and increased branching (Dervinis, 1999). Decreased apical dominance, decreased adventitious rooting, and delayed flowering have been reported in other plants transformed with PSAG12-IPT (Jordi et al., 2000; McCabe et al., 2001; Schroeder et al., 2001).
The sag12 gene is expressed late in the senescence process, after Arabidopsis leaves are visibly yellowing (Weaver et al., 1998). The increase in ipt transcripts detected at 48 hap, a time when WT flowers are in the advanced stages of senescence, supports this pattern of up-regulation. The earlier than expected accumulation of ipt mRNAs in IPT22 corollas could be the result of positional effects on the SAG12 promoter. Similar variations among independent transgenics have been previously reported (Schroeder et al., 2001). In addition to driving senescence-specific expression of ipt, the autoregulatory function of the PSAG12-IPT construct prevents the overproduction of cytokinins. Subsequently, the decrease in ipt mRNAs and cytokinins at 72 hap may have been the result of high cytokinin levels at 48 hap down-regulating transcription of ipt. The decreased ipt abundance detected in IPT22 corollas at 36 hap could also have resulted from the down-regulation of ipt transcription.
The cytokinins that accumulated after pollination in IPT petunias were predominantly Z and ZR. Other plants that have been transformed with the A. tumefaciens ipt gene have also preferentially accumulated Z and ZR with little or no accumulation of iPA type cytokinins (Faiss et al., 1997; Schmulling et al., 1999; Jordi et al., 2000). These experiments suggest that Z and ZR have antisenescence properties in vegetative and floral tissues and that the immediate product of isopentenyl transferase activity, iPA 5′-phosphate, is rapidly metabolized in the plant to ZR-type cytokinins (Schmulling et al., 1999). Recently, plant isopentenyl transferase genes have been identified that may direct the biosynthesis of cytokinins in planta via an iPA-5′-monophosphate-dependent pathway (Sun et al., 2003). Plants that overexpress these plant ipt genes preferentially accumulate iP/iPA-type rather than Z/ZR-type cytokinins (Zubko et al., 2002; Sun et al., 2003). The effects of iP accumulation on senescence have not yet been determined.
Cytokinin-ethylene interactions during flower senescence have been postulated (Mayak and Kofranek, 1976) because the external application of cytokinins to carnation flowers decreased both ethylene synthesis and sensitivity (Eisinger, 1977; Mor et al., 1983; Cook et al., 1985). Our studies indicated that endogenous changes in cytokinin accumulation had a similar impact. Following pollination, two peaks of ethylene were detected in WT corollas at 24 and 48 hap. Enhanced cytokinin levels in the two IPT lines resulted in altered patterns of ethylene production. Whereas IPT34 corollas produced a small amount of ethylene at 24 hap, ethylene production from IPT22 corollas was delayed until 48 hap. This suggests that ethylene biosynthesis by the corolla was decreased or delayed by the higher cytokinin levels in the IPT corollas.
The impact of cytokinins on ethylene production is dose dependent. Although our study and previous ones demonstrate that application or accumulation of enhanced cytokinin content decreases ethylene production, other research shows that submicromolar concentrations of cytokinins induce ethylene biosynthesis (Cary et al., 1995). The posttranscriptional regulation of ACS5, a member of the Arabidopsis gene family encoding the rate-limiting ethylene biosynthetic enzyme 1-aminocyclopropane-1-carboxylate synthase, is believed to be responsible for the sustained peak of ethylene production detected in response to low levels of cytokinins (Vogel et al., 1998). Some of the morphological changes observed in ipt-transformed Arabidopsis plants were attributed to cytokinin enhanced ethylene production because they were not observed when these plants were crossed with ethylene-insensitive plants (Van der Graaff et al., 2001). The reduced levels of ZR and iPA-type cytokinins measured at 12 to 18 hap in IPT34 may have stimulated the small peak of ethylene production measured at 24 hap. Although the major increase in ethylene production at 48 hap in IPT22 and IPT34 corollas followed a period of reduced cytokinin levels measured at 36 hap, peak ethylene production coincided with peak Z and ZR accumulation at 48 hap. Whether different forms of cytokinins impact ethylene biosynthesis differently is unknown.
Large increases in cytokinin accumulation and ipt mRNA abundance were detected in IPT22 and IPT34 corollas following 12 h of ethylene treatment. Sag12 transcript accumulation was also reported in Arabidopsis leaves after ethylene treatment, but this was believed to be an indirect response to ethylene-induced senescence rather than a primary response to ethylene itself (Weaver et al., 1998). Although enhanced cytokinin levels in IPT plants delayed flower senescence and altered patterns of ethylene biosynthesis, it is not clear whether the large increases in cytokinins observed at 48 hap preceded the peak of ethylene production detected at 48 hap or whether ethylene production by these flowers was regulating expression of ipt. A more detailed temporal analysis of ipt expression coupled with the expression of the ethylene biosynthetic genes ACC synthase and ACC oxidase would be needed to address this question.
Despite the increase in endogenous ethylene induced by pollination, the IPT flowers did not senesce at the same time as WT flowers, suggesting that floral ethylene concentration alone was not sufficient to induce senescence. As flowers age, they become more responsive to ethylene-mediated acceleration of senescence (Nichols, 1968; Barden and Hanan, 1972; Mayak et al., 1977; Halevy and Mayak, 1981; Woodson and Lawton, 1988). This change in ethylene sensitivity may coincide with decreased cytokinin content. Observations that ethylene sensitivity decreased following treatment of flowers with cytokinins support this view (Eisinger, 1977; Mor et al., 1983; Cook et al., 1985). Our SAG12-IPT petunias with enhanced cytokinin levels also had reduced ethylene sensitivity. Transgenic flowers required longer ethylene exposures to induce endogenous ethylene production from the corollas, and senescence was delayed compared with comparable treatment of WT flowers. Transgenic flowers were not completely insensitive to ethylene because ethylene treatments still induced up-regulation of the senescence-related gene phcp1, although this increase was delayed compared with WT. The basal levels of phcp1 transcripts detected in non-senscing (0 h) corollas were much lower in IPT flowers, confirming that phcp1 is down-regulated by cytokinins (Tournaire et al., 1996).
In addition to ethylene, ABA levels increase during the senescence of some flowers (LePage-Degivry et al., 1991). The ABA content of both rose and carnation petals was found to increase only late in the senescence process and was associated with large decreases in water potential (Mayak and Halevy, 1972; Eze et al., 1986). The ABA content of WT petunias increased following pollination and was highest at the advanced stages of senescence when the corolla was completely wilted. These increases were not seen in IPT22 or IPT34 flowers from 0 to 72 hap, but these flowers were not senescing during these times. The changes in ABA following pollination are likely a primary response to senescence rather than an initiator of the process and confirm that the senescence program was delayed in IPT petunias.
There is increasing genetic evidence that the activities of cytokinin, ABA, and ethylene are linked. Phenotypic analysis is now revealing that several of the hormone-response mutants have altered sensitivity to more than one hormone (Schmulling et al., 1999). A cytokinin-resistant Arabidopsis mutant, ckr1, which is allelic to the ethylene-insensitive mutant ein2, provides evidence that cytokinin action involves some overlap with ethylene-signaling pathways (Su and Howell, 1992; Cary et al., 1995). Characterization of a class of mutants with enhanced response to ABA (era3) revealed that this mutated gene was also an allele of ein2 and reinforced the conclusion that ein2 affects sensitivity to multiple hormones (Ghassemian et al., 2000). In addition to using our SAG12-IPT petunias to investigate the role of cytokinins in flower senescence, these plants have also provided evidence that the regulation of flower senescence involves the interaction of cytokinins, ethylene, and ABA. Extending these studies to include ethylene-insensitive petunias will improve our understanding of these interactions.
MATERIALS AND METHODS
Plant Material
Petunia (Petunia x hybrida cv V26) was transformed with the Psag12-IPT-Nos chimeric gene construct provided by Dr. Richard Amasino (University of Wisconsin, Madison) according to the methods of Jorgensen et al. (1996). All primary transformants (T0 plants) that contained the transgene construct as determined by PCR (data not shown) were moved to soil less mix (Promix BX, Premier Horticulture, Quebec, Canada) and acclimated to greenhouse conditions. T0 plants were grown until WT plants displayed senescence of the lower leaves, and subsequently transgenic plants with delayed leaf senescence were identified. These studies identified two independent transformants, I-1-7 and I-3-18, which had a delayed leaf senescence phenotype (data not shown). Progeny from these lines that also exhibited delayed flower senescence were selected by comparing the time to corolla wilting in both pollinated and unpollinated (naturally senescing) WT and IPT flowers. ELISAs using the PathoScreen NPT II system (Agdia, Elkhart, IN) were performed on all T2, T3, and T4 plants to confirm that they contained the transgene construct. Only plants that contained the nptII gene were propagated to the next generation. All data presented are from homozygous T5 plants of lines IPT22 and IPT34.
Seed from WT, IPT22, and IPT34 plants was sown on top of soil less mix (Promix BX, Premier Horticulture) in 6-cell packs. All plants were established in the greenhouse after seed germination in a growth chamber with intermittent hand misting. Plants were moved to 10-cm pots after 4 weeks and fertilized once a week with N at 300 mg L-1 from 15N-5P-15K CalMag (The Scotts Co., Marysville, OH).
Flower Senescence Evaluations
Flower senescence was visually rated during natural senescence and following pollination. One day before anthesis, flower corollas were slit with a sharp razor blade, and anthers were removed to prevent self-pollination. On the day of flower opening (anthesis) five flowers from different plants were either self-pollinated or left unpollinated. At the same time each day, flowers were evaluated for corolla wilting, the first visual symptom of senescence. This evaluation was repeated twice, and the data reported represent the mean time until flower wilting ± se for all three experiments (n = 15).
Ethylene Measurements and Treatments
To determine corolla ethylene production, flowers were harvested at 0, 12, 18, 24, 36, 48, and 72 hap. Twelve flowers were collected for each time point. Three corollas were weighed together and sealed in a 15-mL vial. After 20 min, 1 mL of gas was removed from each vial and analyzed for ethylene using a gas chromatograph equipped with an Haysep R packed column and flame ionization detector (Varian, Walnut Creek, CA). Ethylene production experiments were conducted three times, and graphed values represent the mean ethylene production ± se. Following ethylene measurements, corollas were frozen in liquid N2, and stored at -80°C for RNA extraction or cytokinin characterization.
The effects of ethylene treatment were determined using flowers harvested at anthesis, placed in test tubes of deionized water, and transferred to 24-L chambers where ethylene was injected to a final concentration of 2 μL L-1. Control flowers were sealed in chambers with ethylene-free air. At 6, 9, 12, 18, 24, 36, and 48 h after treatment, flowers were removed from the chamber and placed in room air for 20 min to allow applied ethylene to diffuse away before corolla ethylene production was measured. Following ethylene measurements, corollas were frozen in liquid N2, and stored at -80°C for RNA extraction or cytokinin determination. Data presented are the mean ethylene production ± se for the first experiment. In a separate experiment, flowers were treated with 2 μL L-1 ethylene or air for 12 h and then rated for visual symptoms of senescence (corolla wilting) at 24-h intervals after removal. All ethylene treatments were repeated a minimum of two times with similar results.
Cytokinin Analyses
Corollas from six flowers were collected at 0, 12, 18, 24, 36, 48, and 72 hap and after 12 h of ethylene treatment and lyophilized. Tissue (approximately 100 mg per sample) was ground in liquid N2, and cytokinins were extracted in 100% (v/v) ethanol for 30 min. After 9 volumes of 40 mm ammonium acetate (pH 6.5) was added to the extract, cytokinins were isolated on C18 SepPaks (Waters, Bedford, MA), purified, and quantified in triplicate samples using a previously described combined HPLC-immunoassay method (Banowetz, 1992). The immunoassay used monoclonal antibodies tZR3 (Trione et al., 1985) and iPA3 (Trione et al., 1987), prepared against the ribosides of Z and isopentenyl adenosine, respectively. These antibodies are reactive with free bases, 9-glucoside and 9-ribosides of Z, dihydrozeatin (tZR3), and isopentenyl adenine (iPA3). All cytokinin quantities are expressed as ZR or iPA equivalents because ZR and iPA were used to generate standard curves from which the cytokinin content of samples was extrapolated.
ABA Measurements
An ELISA using a monoclonal anti-ABA antibody (Banowetz et al., 1994) was used to quantify ABA in HPLC-purified fractions of the same extracts used for cytokinin characterization.
RNA Extraction, RNA Gel-Blot Analysis, and Real-Time RT-PCR
Total RNA from WT, IPT22, and IPT34 corollas was extracted using TRIZOL reagent (Invitrogen, Carlsbad, CA). RNA samples were treated with RQ1 RNase-free DNase (Promega, Madison, WI) to remove any contaminating genomic DNA and were quantified by determining A 260 using a Beckman DU 640 Spectrophotometer (Beckman Coulter, Fullerton, CA). Relative abundance of the ipt transgene was determined using real-time RT-PCR. Five hundred nanograms of RNA was reverse transcribed and amplified using the QuantiTect SYBR Green RT-PCR kit (Qiagen USA, Valencia, CA). Using the DNA Engine Opticon Continuous Fluorescence Detector (MJ Research Incorporated, Boston) RNA was reverse transcribed for 30 min at 50°C. Following activation of the HotStar TaqDNA polymerase at 95°C for 15 min, PCR was conducted for 35 cycles of denaturation at 94°C for 15 s, annealing at 55°C for 30 s, and elongation at 72°C for 30 s. Relative amounts of transcript were determined by comparing the products with an external standard RNA curve (Lightcycler Control RNA kit, Roche Diagnostics, Mannheim, Germany). Actin was amplified as an endogenous control to standardize the amount of sample RNA added to each reaction. Primers were constructed to amplify 152- and 176-bp amplicons of ipt and actin, respectively. The primers included ipt forward 5′-GCC TCT GGT GAA GGG TAT CA-3′, ipt reverse 5′-CCG CAC TCC AAT AAC TGC TT-3′, actin forward 5′-TTG TCC GTG ACA TGA AGG AA-3′, and actin reverse 5′-TCGATGGCTGGAAGAGAACT-3′. Samples were run in triplicate, and data presented are the mean of the three replications ± se. The presence of a single amplicon of the predicted size was confirmed by performing melting curve analyses of the data as well as by visualizing products on an agarose gel.
For RNA gel-blot analyses, 10 μg of total RNA from corollas at various times after pollination and following ethylene treatment was separated by electrophoresis through a 1.2% (w/v) agarose gel containing 2.2 m formaldehyde. Separated RNAs were transferred to Hybond-N membranes (Amersham Biosciences, Piscataway, NJ) and cross-linked with a Stratalinker controlled UV light source (Stratagene, La Jolla, CA). Membranes were hybridized and washed as previously described (Jones et al., 1995). Probes included the [32P]cDNAs, ACC oxidase phaco1 (Tang et al., 1993), Cys protease phcp1 (PeTh3; Tournaire et al., 1996), and ribosomal RNA (Goldsbrough and Cullis, 1981). Blots were visualized using a Storm PhosphorImager, and the intensity of the signal was quantified using ImageQuant software (Molecular Dynamics, Piscataway, NJ). These values were corrected for any differences in RNA loading by normalizing each sample using the signal intensity of ribosomal RNA. The highest mRNA level was set at 100%, and the other values were expressed relative to that value.
Data Analysis
ANOVA, means, and ses were generated using SAS (v6.0, SAS Institute, Cary, NC). All reported significances were at P = 0.01 or greater.
ACKNOWLEDGMENTS
We acknowledge Don Chen for technical assistance with the cytokinin and ABA analysis and Sarah Ball, Sarah Negley, and John Ray for their assistance with plant growth and maintenance in the greenhouse. We also thank Dr. Dean Fraga at the College of Wooster for the use of the DNA Engine Opticon.
LITERATURE CITED
Akiyoshi DE, Klee H, Amasino RM, Nester EW, Gordon MP (
Baker JE (
Banowetz GM (
Banowetz GM, Hess JR, Carman JG (
Barden LE, Hanan JJ (
Barry GF, Rogers SG, Fraley RT, Brand L (
Borochov A, Woodson WR (
Bosse CA, Van Staden J (
Bovy AG, Angenent GC, Dons HJM, van Altvorst AC (
Cary AJ, Lui W, Howell SH (
Cook D, Rasche M, Eisinger W (
Dervinis C (
Eze JMO, Mayak S, Thompson JE, Dumbroff EB (
Faiss M, Zalubilova J, Strnad M, Schmulling T (
Fujino DW, Reid MS, Yang SF (
Gan S, Amasino RM (
Gan S, Amasino RM (
Ghassemian M, Nambara E, Cutler S, Kawaide H, Kamiya Y, McCourt P (
Goldsbrough PB, Cullis CA (
Grbic V (
Halevy AH, Mayak S (
Heide OM, Oydvin J (
Jones ML, Larsen PB, Woodson WR (
Jordi W, Schapendonk A, Davelaar E, Stoopen GM, Pot CS, De Visser R, Van Rhijn JA, Gan S, Amasino RM (
Jorgensen RA, Cluster PD, English J, Que QD, Napoli CA (
Kakimoto T (
Kelly JW, Staby GL, Chism GW (
LePage-Degivry MT, Orlandini M, Garello G, Barthe P, Gudin S (
MacLean DC, Dedolph RR (
Mayak S, Dilley DR (
Mayak S, Halevy AH (
Mayak S, Halevy AH (
Mayak S, Halevy AH (
Mayak S, Halevy AH, Katz M (
Mayak S, Kofranek A (
Mayak S, Vaadia Y, Dilley DR (
McCabe MS, Garratt LC, Schepers F, Jordi WJRM, Stoopen GM, Davelaar E, Van Rhijn JHA, Power JB, Davey MR (
Medford JI, Horgan R, El-Sawi Z, Klee HJ (
Mor Y, Spiegelstein H, Halevy AH (
Morris RO (
Nichols R (
Panavas T, Walker EL, Rubinstein B (
Quirino BF, Normanly J, Amasino RM (
Ronen M, Mayak S (
Saha S, Nagar PK, Sircar PK (
Savin KW, Baudinette SC, Graham MW, Michael MZ, Nugent GD, Lu C-Y, Chandler SF, Cornish EC (
Schmulling T, Rupp H-M, Frank M, Schafer S (
Schroeder KR, Stimart DP, Nordheim EV (
Stead A, Van Doorn WG (
Su W, Howell SH (
Sun J, Niu Q-W, Tarkowski P, Zheng B, Tarkowska D, Sandberg G, Chua N-H, Zuo J (
Takei K, Sakakibara H, Sugiyama T (
Tang X, Wang H, Brandt AS, Woodson WR (
Taverner E, Letham DS, Wang J, Cornish E, Willcocks DA (
Tournaire C, Kushnir S, Bauw G, Inzé D, dela Serve BT, Renaudin JP (
Trione EJ, Krygier BB, Banowetz GM, Kathrein JM (
Trione EJ, Krygier BB, Kathrein JM, Banowetz GM, Sayavedra-Soto LA (
Upfold SJ, Van Staden J (
Van der Graaff EE, Auer CA, Hooykaas PJJ (
Van Meeteren U (
Van Staden J, Cook E, Nooden LD (
Van Staden J, Dimalla GG (
Veen H (
Vogel JP, Woeste KE, Theologis A, Kieber JJ (
Weaver LM, Gan S, Quirino B, Amasino RM (
Wilkinson JQ, Lanahan MB, Clark DG, Bleecker AB, Chang C, Meyerowitz EM, Klee HJ (
Wingler A, Von Schaewen A, Leegood RC, Lea PJ, Quick WP (
Woodson WR, Lawton KA (
Zhang J, Van Toai T, Huynh L, Preiszner J (
Author notes
This research was supported by the American Floral Endowment (grant to M.L.J. and D.G.C.). Salaries and research support were provided in part by State and Federal funds appropriated to the Ohio Agricultural Research and Development Center, The Ohio State University. This is journal article number HCS 02–05.
Corresponding author; e-mail jones.1968@osu.edu; fax 330–263–3887.
