


Abstract
The use of usnic acid and usnic acid-containing products is associated with acute liver failure; however, mechanistic studies of hepatotoxicity caused by usnic acid are limited. In this study, we investigated and characterized the possible mechanisms, especially the role of autophagy in usnic acid's toxicity in human HepG2 cells. Usnic acid caused apoptosis as demonstrated by an increased caspase-3/7 activity and an increased subdiploid nucleus formation. Usnic acid-induced autophagy as demonstrated by the conversion of LC3B-I to LC3B-II, degradation of P62, and an increased number of puncta. Inhibition of autophagy by treating cells with autophagy inhibitors (3-methyladenine or chloroquine) or by small interfering RNA against Atg7 aggravated usnic acid-induced apoptosis and decreased cell viability, indicating that autophagy plays a protective role against usnic acid-induced toxicity. Moreover, usnic acid activated the MAPK signaling pathway. Usnic acid-elicited apoptosis was enhanced and autophagy was decreased when JNK was suppressed by a specific inhibitor. Additionally, inhibition of autophagy decreased the activity of JNK. Taken together, our results suggest that usnic acid perturbs various interrelated signaling pathways and that autophagy induction is a defensive mechanism against usnic acid-induced cytotoxicity.
Disclaimer: This article is not an official guidance or policy statement of the U.S. Food and Drug Administration (FDA). No official support or endorsement by the U.S. FDA is intended or should be inferred.
Usnic acid is a prominent metabolite of Usnea lichen species. Extracts of Usnea species and purified usnic acid are constituents in a variety of products worldwide that are used for antimicrobial, antiviral, antiparasitic, antimycotic, and antiproliferative purposes (Guo et al., 2008); however, the mechanisms of action of these purported effects have not been well-characterized. Despite the limited pharmacological characterization, usnic acid extracts and pure usnic acid have been marketed in the United State as dietary supplements, aiding in weight loss due to the ability of usnic acid to increase fat metabolism and raise the basal metabolic rate. Unfortunately, acute liver failure has occurred in humans ingesting pure usnic acid or usnic acid-containing products (Durazo et al., 2004; Favreau et al., 2002; Neff et al., 2004; Yellapu et al., 2011). The U.S. Food and Drug Administration (FDA) issued a warning on using usnic acid as dietary supplements, citing one specific product, LipoKinetix (CFSAN, 2001a,b). Despite the reported adverse health effects, usnic acid is still available in the market in various formulations. So far, studies on the mechanisms underlying usnic acid toxicity are limited to a number of reports, mainly focused on mitochondrial impairment and oxidative stress (Han et al., 2004; Pramyothin et al., 2004; Sahu et al., 2012; Sonko et al., 2011).
Autophagy is a lysosomal pathway for degradation of un-needed or dysfunctional cytoplasmic components using endogenous lysosomes (Lum et al., 2005). A variety of stressors, such as nutrient starvation, reactive oxygen species (ROS), DNA damage, hypoxia, endoplasmic reticulum stress (ER stress), mitochondrial damage, and exogenous chemicals can stimulate autophagy (Baehrecke, 2005; Debnath et al., 2005). The induction of autophagy involves various cellular signaling pathways that crosstalk with each other to respond and control cellular stress (Kroemer et al., 2010). The cellular function of autophagy is complex being involved in both cell survival and cell death. Autophagy can serve as a protective mechanism, promoting cellular survival by degrading impaired organelles and long-lived or aggregated proteins in order to maintain proper cellular homeostasis (cell-survival pathway) (Kroemer et al., 2010; Levine and Kroemer, 2008). Autophagy can also promote cell death under certain circumstances and is classified as an alternative cell death pathway termed “autophagic death,” in addition to apoptosis and necrosis, although the precise mechanism of “autophagic death” is not fully understood (Baehrecke, 2005; Debnath et al., 2005). Both autophagy and apoptosis are important determinants of cell fate (death/survival), and they are intimately connected to coordinately regulate cell survival and cell death. It has been reported that autophagy negatively regulates apoptosis to promote cell survival (Gordy and He, 2012; Thorburn, 2008).
Accumulated evidence suggests that autophagy is important in a wide range of diseases, such as neurodegenerative, cardiac, inflammatory diseases, and cancer (Levine and Kroemer, 2008). Autophagy is also implicated in liver diseases including fatty liver, viral hepatitis, ischemia/reperfusion-induced liver injury, and hepatocellular carcinoma (Czaja et al., 2013). Recently, it has been suggested that autophagy may play an important role in toxin/toxicant-induced toxicity (Apostolova et al., 2011; Ding et al., 2010; Igusa et al., 2012; Nepal and Park, 2013; Ni et al., 2012).
The present study was aimed at assessing the autophagy induced by usnic acid in vitro. We applied a series of morphological and biochemical assays to measure indications of autophagy, including LC3B-I to LC3B-II conversion, P62 degradation, and puncta formation. We demonstrated that autophagy was induced in HepG2 cells following usnic acid treatment, and chemical or genetic inhibition of autophagy enhanced usnic acid-elicited apoptosis and cytotoxicity, suggesting that autophagy is a cytoprotective mechanism and can partially protect usnic acid-induced toxicity. We also explored the roles and interrelationships of various signaling pathways in usnic acid-induced toxicity.
MATERIALS AND METHODS
Chemicals and reagents
Usnic acid (329967), William's E medium (W4125), Dulbecco's Modified Eagle's Medium (DMEM, D5648) propidium iodide (P4170), JNK inhibitor SP600125 (S5567), 3-methyladenine (3-MA) (M9281), chloroquine (C6628), thiazolyl blue tetrazolium bromide (MTT) (M2128), and dimethylsulfoxide (DMSO) were from Sigma-Aldrich (St Louis, MO). Fetal bovine serum (FBS) (S11550) was obtained from Atlanta Biologicals (Lawrenceville, GA). Antibiotic-antimycotic (15240062) and puromycin (A11138-03) were obtained from Life Technologies (Grand Island, NY). RNase A (19101) was obtained from Qiagen (Valencia, CA). The general caspase inhibitor (Z-VAD-FMK) was obtained from R&D systems (Minneapolis, MN).
Cell culture
Human hepatoma cell line HepG2 was purchased from the American Type Culture Collection (ATCC; Manassas, VA). HepG2 cells were grown in Williams's E medium supplemented with 10% FBS and 100 U penicillin/ml, 100 μg streptomycin/ml, and 0.25 μg fungizone/ml at 37°C in a humidified atmosphere with 5% CO2. Cells were seeded at a density of 2–5 × 10⁵ cells/ml in volumes of 100 μl per well in 96-well plates or in volumes of 5 ml in 60 mm tissue culture plates or in volumes of 10 ml in 100 mm tissue culture plates. Cells were cultured for 24 h prior to treatment with of usnic acid or the DMSO vehicle control.
The 293T cell line used for lentivirus packaging was obtained from Biosettia (San Diego, CA) and maintained in DMEM supplemented with 10% FBS, 1mM sodium pyruvate and nonessential amino acids.
Establishment of stable cell lines
The lentiviral expression vector pLV-EF1a-GFP-hLC3b-IRES-Puro (Cat. no. pLV-GFP-hLC3b-IP) was purchased from Biosettia. The lentiviral vector and viral packaging plasmids (pMDL-G, pRSV-REV, and pVSV-G) were cotransfected into 293T cells to produce lentiviral stocks. The titrations of lentivirus stocks were measured with a titering kit provided by Biosettia. HepG2 cells were infected with lentivirus carrying GFP-LC3B at a multiplicity of infection (MOI) of 10. Infected cells were selected with 2 μg/ml puromycin to generate a polyclone of cells with stable expression of GFP-LC3B, namely, HepG2-GFP-LC3B.
siRNA transfection
HepG2 cells were transiently transfected with Atg7 siRNA (no. 6604, Cell Signaling Technology, Danvers, MA) at a concentration of 100nM using Lipofectamine RNAiMAX Transfection Reagent (Life Technology, Grand Island, NY), according to the manufacturer's instruction (RNAiMAX Reverse Transfections Lipofectamine). A scrambled siRNA (no. 6568, Cell Signaling Technology) was used as a negative control. Seventy-two hours after transfection, cells were treated with the indicated concentrations of usnic acid for 24 h. The silencing efficiency of Atg7 was determined by Western blot.
Determination of GFP expression level
Spectrofluorometry was used to monitor the treatment-induced reduction of total GFP-LC3B expression. HepG2-GFP-LC3B cells were seeded into 96-well plates and treated with the indicated concentrations of usnic acid for 24 or 48 h. The fluorescence intensity was measured with a Synergy 2 Microplate Reader (BioTek, Winooski, Vermont) using 488 nm excitation and 520 nm emission filters. The data were normalized against total protein content as measured by a bicinchoninic acid (BCA) protein assay (Bio-Rad, Hercules, CA).
Lactate dehydrogenase assay
The cytotoxicity of usnic acid was assessed using the lactate dehydrogenase (LDH) assay as described previously (Li et al., 2012).
MTT cell viability assay
HepG2 cells were seeded into 96-well plates and treated with usnic acid at various concentrations or DMSO for 2, 6, 24, or 48 h. After treatment, 20 μl of MTT solution (5 mg/ml) was added to each well. After incubation for additional 2 h, the supernatants were aspirated and the formazan precipitates were dissolved in 50 μl of DMSO. Formazan absorbance was measured at 540 nm on a Synergy 2 Microplate Reader.
Cell cycle analysis
The subdiploid DNA peaks and cell cycle distribution of the HepG2 cells were measured using flow cytometry-based cell cycle analysis as described previously (Chen et al., 2014a).
Caspase-3/7 activity measurement
The enzymatic activity of caspase-3/7 (Promega Corporation, Madison, WI) was measured using luminescent assay kits as described previously (Chen et al., 2014a).
Western blot analysis
Cells were grown and treated with usnic acid in 60 or 100 mm tissue culture plates. Standard Western blots were performed. Depending on the proteins of interest in different blots, antibodies were selected from among those against, phospho-PDK1 (Ser241), AKT, phospho-AKT (Thr308), phospho-AKT (Ser473), mTOR, phospho-mTOR (Ser2448), phospho-p70 S6 kinase (Ser371), phospho-4E-BP1 (Thr37/46), p62, Bcl-2, Bcl-xL, Mcl-1, JNK, phosphor-JNK (Thr183/Tyr185), ERK1/2, phospho-ERK1/2 (Thr202/Tyr204), p38, and phospho-p38 (Thr180/Tyr182) (all from Cell Signaling Technology), LC3B, GFP (Sigma-Aldrich), and ATG7 (Santa Cruz Biotechnology, Santa Cruz, CA) using GAPDH (Santa Cruz Biotechnology) as internal control followed by a secondary antibody conjugated with horseradish peroxidase (HRP) (Santa Cruz Biotechnology).
Confocal microscopic analysis
Stably infected HepG2-GFP-LC3B cells (1 × 10⁵) were seeded on coverslips in 24-well plates. Cells were then treated with usnic acid at concentrations of 6.25 or 12.5μM or DMSO for 24 or 48 h. After treatment, the coverslips were washed with PBS twice and fixed with 4% paraformaldehyde in PBS for 15 min followed by another wash in PBS. The appearance of GFP-LC3B puncta was determined using an Olympus FV1000 confocal microscope (Olympus, Center Valley, PA) by observing GFP fluorescence after mounting the coverslips onto glass slides using Vectashield mounting medium containing 4,6-diamidino-2-phenylindole (DAPI) (Vector Laboratories, Burlingame, CA).
Statistical analyses
Data are presented as the mean ± standard deviation (SD) of at least three independent experiments. Analyses were performed using GraphPad Prism 5 (GraphPad Software, San Diego, CA). Statistical significance was determined by one-way analysis of variance (ANOVA) followed by the Dunnett's post hoc tests for pairwise-comparisons or two-way ANOVA followed by a Bonferroni's post hoc test. The difference was considered statistically significant when p-value was <0.05.
RESULTS
Usnic Acid Causes Cytotoxicity in HepG2 Cells
To evaluate usnic acid-induced cytotoxicity in HepG2 cells, cells were treated with increasing concentrations of usnic acid for 2, 6, 24, and 48 h, and toxicity was assessed using the MTT assay (to measure cell viability by the activation of mitochondrial succinate dehydrogenase in live cells) and the LDH assay (to measure LDH release from compromised cell membranes) in parallel (Fig. 1). Usnic acid exhibited a time- and concentration-dependent growth inhibiting effect as measured by the MTT assay (Fig. 1A). Significant LDH release (Fig. 1B) occurred only after 24 h exposure to 12.5μM or after 48 h exposure to 3.13μM usnic acid; no significant LDH release was observed after 2 or 6 h exposure to the tested concentrations of usnic acid.
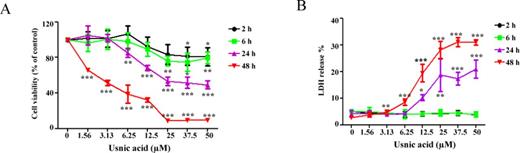
Usnic acid causes cellular damage in HepG2 cells. HepG2 cells were exposed to increasing concentrations (1.56, 3.13, 6.25, 12.5, 25, 37.5, and 50μM) of usnic acid, with DMSO as the vehicle control for 2, 6, 24, and 48 h. (A) Cell viability was assessed using the MTT assay. (B) LDH release was determined as described under the Materials and Methods section; the results shown are mean ± SD of at least three individual experiments. *p < 0.05, **p < 0.01, and ***p < 0.001 compared with the control for each time point.
Usnic Acid Disturbs Cell Cycle and Induces Apoptosis
Cell cycle profiling and DNA content measurements were used to determine the possible mechanisms of growth inhibition caused by usnic acid after 24 h treatment. Accumulation of cells in S phase and a concurrent reduction of cells in the G1 and G2/M phases were observed with increasing concentrations of usnic acid, and the fraction of sub-G1 apoptotic cells increased in a concentration-dependent manner (Fig. 2).
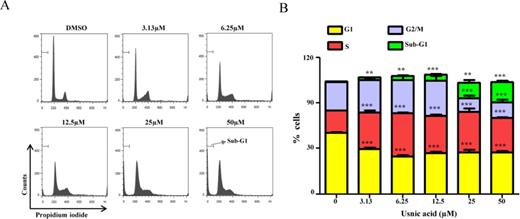
Effect of usnic acid on cell cycle. (A) Flow cytometric analysis of cell cycle distribution. Histograms shown are DNA content analyses for HepG2 cells treated with the indicated concentrations of usnic acid for 24 h. Cells were stained with propidium iodide and processed for cell cycle analysis. (B) The bar graph depicts the percentage of each cell cycle phase ± SD from four independent experiments. **p < 0.005, and ***p < 0.001 versus the respective sub-G1, G1, S, or G2/M phase of DMSO-treated cells.
Measurement of sub-G1 apoptotic cells is a common and sensitive method for apoptosis detection because the early apoptosis can be quantified. In addition, apoptosis can be assessed using annexin V/propidium iodide. We have tried to use flow cytometry with annexin V and propidium iodide, but a high background, even with untreated healthy cells, made quantitation difficult.
Caspase-3/7 is a key player in the execution of cell apoptosis. The increase in the sub-G1 content in treated cultures (Fig. 2), characteristic of apoptosis, was accompanied by an increase in caspase-3/7 enzymatic activity (Fig. 3A). The increased caspase-3/7 activity depended on the concentration of usnic acid, with a sharp increase in activity occurring at 12.5μM after 24 h and 6.25μM after 48 h, respectively (Fig. 3A).
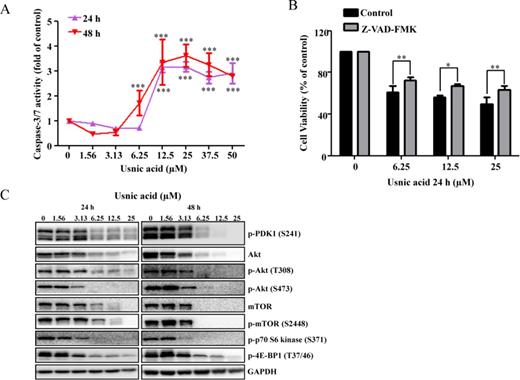
Effect of usnic acid on apoptosis and AKT/mTOR. (A) Cellular caspase-3/7 activity was expressed as fold change compared with DMSO control cells (***p < 0.001). (B) HepG2 cells were pretreated with 10μM Z-VAD-FMK, general caspase inhibitor, for 1 h prior to treatment of usnic acid for 24 h, and then the cell viability was determined. (C) Total cell lysates were isolated at 24 and 48 h after usnic acid treatment. The expression levels of proteins of AKT signaling pathway including p-PDK1 (S241), Akt, p-Akt (T308), p-Akt (S473), mTOR, p-mTOR (S2448), p-p70 S6 kinase (S371), and p-4E-BP1 (T37/46) were determined by Western blotting. GAPDH was used as internal control.
The protective effect of caspase inhibitor on usnic acid-induced cytotoxicity was assessed. As shown in Figure 3B, pretreatment (1 h) with 10μM Z-VAD-FMK, a caspase inhibitor, significantly attenuated usnic acid's cytotoxicity, indicating apoptosis in one of the toxic mechanisms of usnic acid-associated toxicity. It should be mentioning that although caspase inhibitor attenuated usnic acid-induced toxicity, the reserving effect was partially (Fig. 3B), indicating other mechanisms may exist besides caspase-dependent pathway such as ER stress (unpublished data). The decreased expression of antiapoptotic proteins Bcl-2 and Mcl-1 (Fig. 5A) is an indication of apoptosis and will be discussed later.
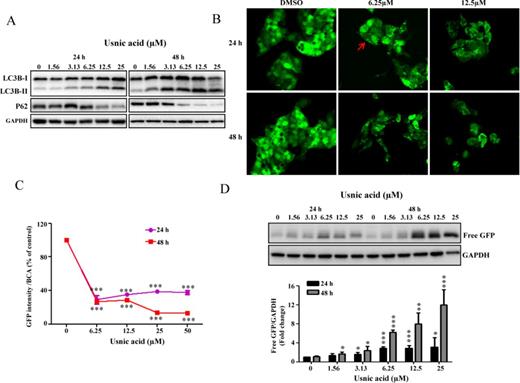
Usnic acid induces autophagy in HepG2 cells. (A) HepG2 cells were treated with usnic acid at the indicated concentrations for the indicated times and Western blotting analysis was performed using antibodies against LC3B and P62 in whole cell lysates. (B) HepG2-GFP-LC3B cells were incubated with the indicated concentration of usnic acid for 24 and 48 h. The GFP-LC3B punctuation/aggregation (arrow) was observed by confocal laser microscope. Representative images were from three independent experiments. (C) HepG2-GFP-LC3B cells were seeded in 96-well plates and treated with usnic acid at indicated concentrations for 24 and 48 h. The fluorescence intensity was measured as described under the Materials and Methods section; the results shown are mean ± SD of four separate experiments. ***p < 0.001 compared with the control for each time point. (D) Western blotting analysis was performed with an antibody against GFP using lysates from HepG2-GFP-LC3B cells exposed to usnic acid at indicated concentrations for 24 and 48 h (top panel). The bars represent the densitometric analysis of free GFP expression (bottom panel). Intensities of bands of free GFP were normalized to the amount of GAPDH. Data are mean ± SD of three individual experiments. *p < 0.05, **p < 0.01, and ***p < 0.001 compared with the control for each time point.
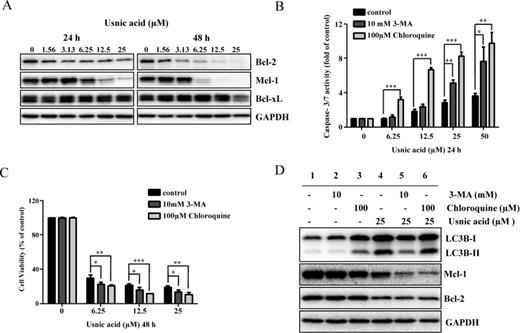
Inhibition of autophagy enhances usnic acid-induced apoptosis and decreases cell viability in HepG2 cells. (A) Total cellular protein were extracted at 24 and 48 h after usnic acid treatment, and levels of Bcl-2 family antiapoptosis proteins including Bcl-xl, Bcl-2, and Mcl-1 were detected by Western blotting. GAPDH was used as a loading control. Similar results were obtained from three independent experiments. (B and C) HepG2 cells were pretreated with 10mM 3-MA or 100μM chloroquine for 2 h prior to 24 or 48 h treatment with indicated concentrations of usnic acid. Apoptosis was determined by caspase-3/7 assay (B) and cell viability was assessed by MTT assay (C). The bar graphs show the mean ± SD of three experiments. *p < 0.05, **p < 0.01, and ***p < 0.001 versus treatment with usnic acid alone. (D) Western blotting was performed using antibodies for LC3B, Mcl-1, Bcl-2, and GAPDH.
The Akt/mTOR (mammalian target of rapamycin) signaling pathway is involved in regulating various biological processes, such as cell cycling, cell proliferation, apoptosis, and autophagy (Song et al., 2005). A number of key proteins have been identified in the Akt/mTOR pathway: PDK1 phosphorylates threonine 308 and activates Akt. Akt activates mTOR, which is a key molecule in growth regulatory and autophagy pathways. Activation of mTOR results in phosphorylation of several downstream targets, such as 4EBP1 and the ribosomal protein p70S6K. To determine whether or not the Akt/mTOR pathway is involved in usnic acid-induced cell cycle alteration and apoptosis, we selected well-characterized markers in the Akt/mTOR pathway and determined their expression by Western blot analysis. As shown in Figure 3C, p-PDK1, Akt, p-Akt (Thr308), p-Akt (Ser473), mTOR, p-mTOR, p-p70S6 kinase, and p-4E-BP1were markedly decreased in a time- and concentration-dependent fashion, suggesting that usnic acid suppresses the Akt/mTOR signaling pathway and the suppression may occur at gene expression level because both total and phosphorylated Akt and mTOR were reduced.
Usnic Acid Induces Autophagy
mTOR is important in regulating autophagy, and suppression of mTOR promotes autophagy (Alers et al., 2012). Because the Akt/mTOR pathway was suppressed in usnic acid treated cells (Fig. 3C), we examined whether or not usnic acid induces autophagy using a set of specific tests, including the monitoring of (1) autophagosome formation and (2) autophagic flux, which is dynamic process of autophagosome synthesis. Autophagosome is an intermediate structure in a dynamic pathway (Mizushima et al., 2010). Besides examining the formation of autophagosomes (LC3B conversion and puncta formation), monitoring autophagic flux (degradation of autophagy-specific proteins) is also a commonly used approach in autophagy studies. As shown in Figure 4A, usnic acid treatment increased the formation of autophagosomes as confirmed by the conversion of cytosolic LC3B-I to autophagosomal membrane-bound LC3B-II, a widely used marker of autophagosomes (Komatsu et al., 2007). In addition, usnic acid induced the reduction of an autophagy-specific substrate P62, an important indicator of autophagic flux (Fig. 4A) (Komatsu et al., 2007). Both LC3B conversion and P62 reduction were time- and concentration-dependent. In order to quantify autophagy induction and also to monitor the changes morphologically, we generated a HepG2 cell derived stable cell line expressing fusion protein of GFP-LC3B (HepG2-GFP-LC3B, details see the Establishment of stable cell lines section under the Materials and Methods section). Using this cell line, both autophagosomes formation and autophagic flux can be measured quantitatively. Autophagosomes can be analyzed by calculating the number of punctae per cell. Autophagic flux can be analyzed by measuring free GFP (free GFP fragment is generated by the degradation of GFP-LC3B inside autolysosomes) using Western blot with an antibody against GFP and by measuring decreased GFP-LC3B fluorescence by spectrofluorometry (the reduction of total GFP-LC3B expression is paradoxically a typical indicator of autophagic flux because of LC3B degradation) (Mizushima et al., 2010). Using this newly established cell line, we demonstrated that usnic acid treatment caused an increase in the number of GFP-LC3B puncta (Fig. 4B) and a decrease in GFP signal (Fig. 4C). As expected, a decrease in total GFP-LC3B fluorescent signal was observed microscopically (Fig. 4B), and free GFP generation was detected by Western blot (Fig. 4D). Collectively, these data clearly demonstrate that autophagy was induced by usnic acid.
Autophagy Prevents Usnic Acid-Induced Apoptosis and Cytotoxicity
Both autophagy and apoptosis are important in regulating cell survival/death and the two processes are closely associated (Thorburn, 2008). The key antiapoptotic proteins Bcl-2, Bcl-xL, and Mcl-1 have been shown to interact with autophagy components (Tai et al., 2013; Thorburn, 2008), so it was of great interest to investigate whether or not autophagy plays a role in apoptosis and which antiapoptotic proteins are involved. Treatment with usnic acid decreased the expression of Bcl-2 and Mcl-1 in a time- and concentration-dependent manner; for Bcl-xL, although there was a decrease at 48 h for the highest concentration, no obvious changes were detected at 24 or 48 h for lower concentrations (Fig. 5A).
To investigate the role of autophagy in usnic acid-induced apoptosis, we used two autophagy inhibitors with distinct functions, 3-methyladenine (3-MA) and chloroquine. 3-MA is a class III PI3K inhibitor which blocks autophagosome formation (prevents conversion of LC3B-I to LC3B-II) (Seglen and Gordon, 1982); chloroquine is a lysosomotropic reagent capable of impairing lysosomal acidification and suppressing the protease activity (promotes LC3B-II accumulation by inhibiting LC3B-II degradation inside the autolysosome) (Suzuki et al., 2002). HepG2 cells were pretreated with 3-MA or chloroquine for 2 h and then incubated with usnic acid for another 24 h. As shown in Figure 5B, 3-MA or chloroquine significantly increased usnic acid-induced apoptosis as determined by caspase-3/7 activation. Inhibition of autophagy in 3-MA pretreated cells was confirmed by reduced LC3B-II compared with nonpretreated cells (Fig. 5D, lane 2 vs. lane 1). 3-MA decreased 25μM usnic acid-caused autophagy induction (lane 5 vs. lane 4, Fig. 5D) as the conversion of LC3B-I to LC3B-II was reduced. Inhibition of autophagy by chloroquine was confirmed by the accumulated LC3B-II (lane 3 vs. lane 1, Fig. 5D). It was expected that usnic acid would worsen the accumulation of LC3B-II by chloroquine, i.e., more LC3B-II would be presented in the presence of both compounds; but we did not observe increased level of LC3B-II (Fig. 5D, lane 6 vs. lane 4). The reason is not clear; we suspect that because 25μM usnic acid caused maximum autophagy induction (Fig. 4C), no further enhancement of LC3B-II could be detected under our experimental conditions.
Furthermore, although treatment with usnic acid decreased the expression of both Bcl-2 and Mcl-1 (lane 4 vs. lane 2, Fig. 5D), Mcl-1 but not Bcl-2 was further decreased in 3-MA or chloroquine pretreated cells compared with the usnic acid only treated group (lanes 5, 6 vs. lane 4, Fig. 5D), implying that Mcl-1 is involved in the crosstalk between autophagy and apoptosis. Moreover, addition of 3-MA or chloroquine decreased the cell viability compared to the cells treated with usnic acid alone (Fig. 5C).
The use of modulators is a widely accepted approach in autophagy studies; however, the lack of high specificity of these inhibitors is a concern (Mizushima et al., 2010). We took more specific approach by knocking down autophagy-related gene Atg7 (Komatsu et al., 2005) using small interfering RNA (siRNA) to confirm further the role of autophagy in usnic acid-induced toxicity. As shown in Figure 6A, inhibition of autophagy by knocking down Atg7 nearly abolished usnic acid-induced autophagy as the conversion of LC3B-I to LC3B-II was dramatically reduced. Knocking down of Atg7 resulted in an increased capaspase-3/7 activity and a decreased cell viability in usnic acid treated cells, comparing to the scramble control (Figs. 6C and 6D). Similar to effects of 3-MA or chloroquine addition, Atg7 knocking down further decreased the expression of Mcl-1 compared with scramble control (Figs. 6A and 6B).
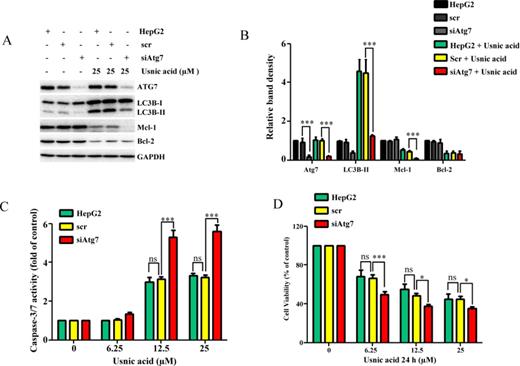
Inhibition of autophagy by knocking down Atg7 enhances usnic acid-induced apoptosis and decreases cell viability in HepG2 cells. HepG2 cells were transiently transfected with Atg7 siRNA (siAtg7) at a concentration of 100nM and scrambled siRNA (scr) was used as a negative control. Seventy-two hours after transfection, cells were treated with the indicated concentrations of usnic acid for 24 h. (A) Total cellular proteins were extracted at 24 h after usnic acid treatment, and levels of ATG7, LC3B-I, LC3B-II, Mcl-1, and Bcl-2 were detected by Western blotting; GAPDH was used as a loading control. (B) densitometic analysis of (A) from three experiments. (C) Apoptosis was determined by caspase-3/7 assay. (D) Cell viability was assessed by MTT assay. The bar graphs show the mean ± SD of three experiments. *p < 0.05, and ***p < 0.001 Atg7 siRNA versus scrambled siRNA. ns: no significant difference.
Collectively, both chemical and genetic inhibition studies clearly demonstrate that inhibition of autophagy sensitizes HepG2 cells to usnic acid-induced apoptosis and cytotoxicity, indicating that autophagy plays a protective role.
Usnic Acid Activates JNK and Activation of JNK Prevents the Occurrence of Apoptosis
It has been reported that the MAPK signaling pathway is involved in liver toxicity (Chen et al., 2014a,b; Hwang et al., 2013; Mobasher et al., 2013; Wu and Cederbaum, 2013), and participates in the regulation of autophagy and apoptosis in response to genotoxic or pharmacological stresses (Chen et al., 2014a; Hu et al., 2014; Kim et al., 2013a,b; Sui et al., 2014). To explore whether or not MAPK signaling pathway is also involved in usnic acid-induced apoptosis and autophagy; and to study the relationship among different signaling pathways, we first investigated the activation of three branches (JNK, ERK1/2, and p38) of the MAPK signaling pathway. Figure 7A shows that as early as 6 h, usnic acid treatment profoundly increased the level of p-JNK, p-ERK1/2, and p-P38 in a concentration- and time-dependent manner, indicating that the MAPK signaling pathway is activated. To study which branch of the MAPK pathway is involved in apoptosis, we preincubated cells with MAPK inhibitors specifically targeting JNK (SP600125), p38 (SB239063), or ERK1/2 (PD184352) for 2 h, followed by usnic acid treatment for 24 h. Pretreatment with SP600125 further increased caspase-3/7 activity (Fig. 7B) and decreased cell viability (Fig. 7C) caused by usnic acid, whereas there was no significant change of caspase-3/7 activity with SB239063 and PD184352 compared with usnic acid only treated group (data not shown). The inhibition of JNK activation by SP600125 was confirmed by suppression of p-JNK (Fig. 8A). In addition, compared with usnic acid only treated cells, inhibition of JNK activation also notably diminished the expression of Mcl-1, but not Bcl-2 (Figs. 8A and 8B) and partially reversed cytotoxicity caused by usnic acid (Fig. 7C). Taken together, these results indicate that JNK activation negatively modulates usnic acid-induced apoptosis, and prevents the occurrence of apoptosis and cytotoxicity.
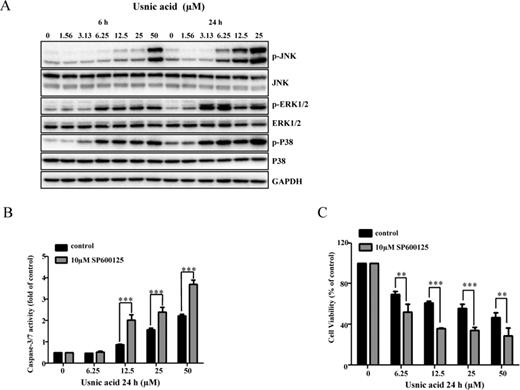
Usnic acid activates JNK and JNK activation is involved in apoptosis. (A) Total cellular proteins were extracted at 6 and 24 h after exposure to usnic acid. The expression levels of activated JNK (phospho-JNK), p38 (phospho-p38), and ERK1/2 (phospho-ERK1/2) were detected by Western blot analyses. The same blot was stripped and used to determine the amount of each kinase. GAPDH was loaded as internal control. Data are typical of three experiments. (B and C) HepG2 cells were pretreated with 10μM SP600125 (JNK inhibitor) for 2 h prior to 24 h treatment with indicated concentrations of usnic acid. Apoptosis was assessed by caspase-3/7 activity (B). Cell viability was determined by MTT assay (C). The bar graphs show the mean ± SD of three experiments. **p < 0.005, and ***p < 0.001 versus treatment with usnic acid alone.
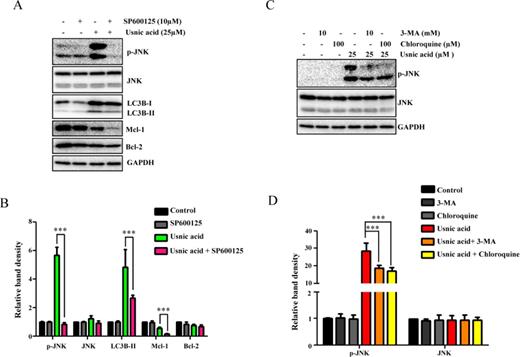
JNK activation and autophagy regulate each other. (A) HepG2 cells were pretreated with 10μM SP600125 (JNK inhibitor) for 2 h prior to 24 h treatment with 25μM usnic acid. The inhibitory effects of SP600125 on expression levels of p-JNK and levels of LC3B, Mcl-1, and Bcl-2 were determined by Western blotting. (B) Densitometic analysis of (A) from three experiments. (C) Pretreatment with 10mM 3-MA or 100μM chloroquine for 2 h prior to 24 h treatment with 25μM usnic acid. The expression of p-JNK and JNK was analyzed by Western blotting. GAPDH was used as a loading control. (D) Densitometic analysis of (C) from three experiments.
JNK and Autophagy Positively Regulate Each Other
We next investigated the interrelationship of JNK and autophagy in response to the usnic acid exposure by using an autophagy inhibitor or JNK inhibitor. As shown in Figures 8A and 8B, inhibition of JNK by the JNK-specific inhibitor SP600125 markedly reduced the conversion of LC3B-I to LC3B-II, compared to that in usnic acid only treated cells, indicating a decrease in autophagy. Likewise, inhibition of autophagy by 3-MA or chloroquine greatly reduced JNK activation (Figs. 8C and 8D). These data suggest that JNK and autophagy positively regulate each other, and that JNK suppression of apoptosis may be via the interplay with autophagy.
DISCUSSION
The most likely mechanism for usnic acid in weight loss is uncoupling of mitochondrial oxidative phosphorylation (i.e., inefficient dissipation of energy as heat so that metabolic rate increases (burning fat to maintain ATP pools)) (Guo et al., 2008; Terada, 1990). Therefore, it is not surprising that toxicological studies of usnic acid have been mainly focused on mitochondrial dysfunction (Abo-Khatwa et al., 1996; Han et al., 2004; Sahu et al., 2012).
In vivo studies have reported that usnic acid causes mitochondrial swelling and morphological changes in endoplasmic reticulum in livers of rats (Pramyothin et al., 2004). In vitro studies using primary rodent hepatocytes and HepG2 cells have demonstrated that treatment with usnic acid results in cytotoxicity, oxidative phosphorylation uncoupling and inhibition (Abo-Khatwa et al., 1996; Han et al., 2004), oxidative stress (Han et al., 2004; Sahu et al., 2012), lipid peroxidation, and depletion of glutathione (Han et al., 2004). In this study, we first assessed usnic acid-induced liver toxicity using various endpoints. In good agreement with previous reports (Abo-Khatwa et al., 1996; Han et al., 2004; Sahu et al., 2012), we found that usnic acid caused time- and concentration-dependent cytotoxicity as demonstrated by decreased cell viability (Fig. 1A), increased LDH release (Fig. 1B), increased oxygen consumption (unpublished data) in HepG2 cells, and uncoupled oxidative respiration in isolated rat mitochondria (unpublished data). Most importantly, we found that autophagy was induced by usnic acid (Fig. 4).
It is worth mentioning that the human plasma concentration after intake of usnic acid is currently unknown. We calculated plasma concentration based on the recommended daily usnic acid dose of 100–500 mg (Durazo et al., 2004; Favreau et al., 2002). It can be postulated that a 75 kg body weight adult could have plasma concentration of 7.4–37μM when taking 100–500 mg usnic acid, assuming complete oral absorption and distribution into total body water (45 l, 0.6 l/kg). The concentrations (1.56–50μM) used in the present study are within range of assumed plasma concentrations, and thus are clinically relevant. In this study, we initially used different in vitro systems for toxicity evaluation, including HepG2 cells, rat primary hepatocytes (Supplementary Data), and human primary hepatocytes (Supplementary Data), and we obtained generally similar toxicities, although the sensitivity of the different cells was different. We carried out the remaining experiments in HepG2 cells because (1) the use of a stable cell line (HepG2-GFP-LC3B) to quantitatively measure autophagy was one of major aspects of this study and (2) the HepG2 cell line has the capacity for genetic modifications as discussed previously (Chen et al., 2013, 2014a). We are aware that HepG2 cells lack some drug metabolizing genes compared with primary hepatocytes and it may not be the best suited for studying metabolism-associated toxicity (Guo et al., 2011; Ning et al., 2008); however, metabolic capacity was not a major concern for this particular study because study has shown that the parental form of usnic acid produces more toxicity than its metabolites (Shi et al., 2013).
It should be noted that apoptosis was not observed in mouse primary hepatocytes in the study of Han et al. (2004) as we detected in our current study. We suspect that this discrepancy could due to the sensitivity of the methods used: apoptosis was detected morphologically using a fluorescent probe Hoechst 33258 in Han's study (Han et al., 2004); however, more sensitive and quantitative methods including luminescent-based caspase-3/7 activity measurement (Fig. 3A) and flow cytometry-based analysis to measure subdiploid nuclei (Fig. 2) were used for apoptosis detection in our study. The discrepancy could also due to different cells (HepG2 vs. mouse hepatocytes) used in two studies.
Recent studies have reported that autophagy plays an important role in liver toxicity induced by drugs and chemicals (Apostolova et al., 2011; Ding et al., 2010; Igusa et al., 2012; Nepal and Park, 2013; Ni et al., 2012). For instance, efavirenz, a nonnucleoside reverse transcriptase inhibitor for the treatment of human immunodeficiency virus (HIV), has been reported to trigger autophagy in the human cell line HepB3 at clinically relevant concentrations. Inhibiting autophagy with inhibitors increases the cell damaging effect of efavirenz, indicating that rather than causing cell death, autophagy is an adaptive, cell survival-promoting mechanism in efavirenz-induced liver toxicity (Apostolova et al., 2011). A recent study reported that autophagy was induced in mouse livers and primary hepatocytes by acetaminophen (Ni et al., 2012). Induction of autophagy by rapamycin diminished acetaminophen-induced liver toxicity; in contrast, inhibition of autophagy by 3-MA or chloroquine exacerbated acetaminophen-induced necrosis, suggesting that autophagy is cytoprotective against cell death (Ni et al., 2012). Interestingly, pharmacological induction with rapamycin after acetaminophen metabolism and after glutathione depletion still reduces liver toxicity caused by acetaminophen, indicating that targeting an early stage of acetaminophen toxicity by correcting glutathione depletion, pharmacological induction of autophagy can be considered as a potential therapeutic approach for the treatment of acetaminophen overdosed patients particularly those who are past the metabolic phase and have not received the appropriate treatment (Ni et al., 2012).
In this work, we also studied a number of cellular pathways including apoptosis, autophagy, Akt/mTOR, and MAPK, and found that they were interrelated and functioned in concert in response to usnic acid exposure. The involvement of multiple signaling pathways is summarized as follows.
The expression of numerous key proteins in the Akt/mTOR pathway, notably Akt and mTOR, was decreased (Fig. 3C). It is well-recognized that the Akt/mTOR pathway is critical in negatively regulating autophagy and the inhibition of Akt/mTOR increases the expression of autophagy-related genes and induces autophagy (Song et al., 2005), so that the autophagy induction observed in this study is most likely via inhibition of the Akt/mTOR dependent pathway, based on our data and previous well-described Akt/mTOR-autophagy regulation (Alers et al., 2012; Levine and Kroemer, 2008).
The mitogen-activated protein kinase (MAPK) pathway is involved in various cellular processes including apoptosis and autophagy (Chang and Karin, 2001; Sui et al., 2014). Three major MAPKs have been identified: extracellular signal-regulated kinases (ERK1/2), c-Jun N-terminal kinases (JNK), and p38. JNK and p38 are stimulated by cellular damage signaling related to apoptosis and cell death, whereas ERK is activated by growth factors related to cell proliferation (Chang and Karin, 2001; Xia et al., 1995). We previously showed that MAPK is critical in drug-induced liver toxicity; in particular, activation of JNK promotes cell death (Chen et al., 2014b). In this study, the MAPK signaling pathway is also activated (Fig. 7A); however, in the case of usnic acid, activation of JNK prevents cell death because addition of a JNK-specific inhibitor increased caspase-3/7 activity (Fig. 7B), indicating that JNK is a negative regulator for usnic acid's toxicity. JNK activation can promotes cell death (Chen et al., 2014a) and also prevents cell death (this study), indicates that a complex mechanism is involved in JNK activation. Although ERK1/2 and p38 in MAPK were also activated as the expression of p-ERK1/2 and p-p38 was increased (Fig. 7A), they do not seem to be involved in usnic acid-induced apoptosis because specific inhibitors of ERK1/2 and p38 failed to either promote or diminish apoptosis (data not shown).
Results from numerous studies have indicated that JNK contributes to autophagy induction in response to cellular stress and the JNK signaling pathway may be a key requirement for upregulating LC3B (Sui et al., 2014; Sun et al., 2011; Zhao et al., 2011). In agreement with those reports, we also showed a crosstalk between the two pathways using JNK and autophagy inhibitors. Our inhibition study (inhibiting one pathway suppressed the activation of another) (Fig. 8) implies that the two pathways positively regulate each other, counteracting apoptotic events, and thus preventing against usnic acid-induced toxicity coordinately.
In summary, as depicted in Figure 9, we have demonstrated that in HepG2 cells, usnic acid induces apoptosis, inactivates mTOR, activates JNK, and induces autophagy. Suppression of mTOR promotes autophagy; autophagy induction and JNK activation prevents apoptosis and cell death; JNK and autophagy positively regulate each other. Although how the cells precisely maintain the balance between cell survival and cell death remains to be determined, it is clear that a complex mechanism, with the involvement of multiple molecule events and multiple signaling pathways, is involved in usnic acid-induced toxicity.
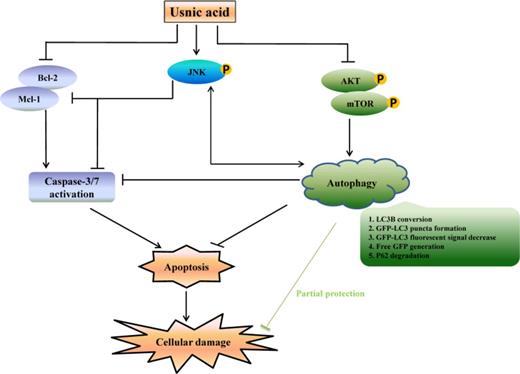
Schematic diagrams showing the mechanism underlying liver toxicity of usnic acid. Usnic acid induces apoptosis, inactivates mTOR, activates JNK, and induces autophagy. Suppression of mTOR promotes autophagy; autophagy induction and JNK activation prevent apoptosis and cell death; JNK and autophagy positively regulate each other.
S.C., Y.W., and Z.H.Z. were supported by appointments to the Postgraduate Research Program at the National Center for Toxicological Research administered by the Oak Ridge Institute for Science Education through an interagency agreement between the U.S. Department of Energy and the U.S. Food and Drug Administration. We thank Dr William Melchior for his critical review of this manuscript.
REFERENCES

Comments