


Abstract
Typically, genetically engineered crops contain traits encoded by one or a few newly expressed proteins. The allergenicity assessment of newly expressed proteins is an important component in the safety evaluation of genetically engineered plants. One aspect of this assessment involves sequence searches that compare the amino acid sequence of the protein to all known allergens. Analyses are performed to determine the potential for immunologically based cross-reactivity where IgE directed against a known allergen could bind to the protein and elicit a clinical reaction in sensitized individuals. Bioinformatic searches are designed to detect global sequence similarity and short contiguous amino acid sequence identity. It has been suggested that potential allergen cross-reactivity may be predicted by identifying matches as short as six to eight contiguous amino acids between the protein of interest and a known allergen. A series of analyses were performed, and match probabilities were calculated for different size peptides to determine if there was a scientifically justified search window size that identified allergen sequence characteristics. Four probability modeling methods were tested: (1) a mock protein and a mock allergen database, (2) a mock protein and genuine allergen database, (3) a genuine allergen and genuine protein database, and (4) a genuine allergen and genuine protein database combined with a correction for repeating peptides. These analyses indicated that searches for short amino acid sequence matches of eight amino acids or fewer to identify proteins as potential cross-reactive allergens is a product of chance and adds little value to allergy assessments for newly expressed proteins.
Proteins introduced through genetic engineering into plants intended for human consumption are assessed for their potential as allergens. This assessment includes determination of: the source of the introduced protein; any significant similarity between the amino acid sequence of the protein and known allergens; its susceptibility to enzymatic degradation, stability to heat or acid treatment; and serum screens using documented sera from allergic individuals if the protein is similar to known allergens or comes from an allergenic source (Astwood et al., 2003; Metcalfe et al., 1996). The purpose of performing bioinformatic evaluations is to determine if the introduced protein shares any sequence similarities with known allergens or gliadins that might indicate the protein could elicit a clinical reaction in a sensitized individual. The extent of sequence similarities between the introduced protein and database sequences of allergens, gliadins, and other proteins can be efficiently assessed using local sequence alignment tools such as FASTA (Pearson and Lipman, 1988). Since the FASTA program directly compares amino acid sequences (i.e., primary protein structure), and protein structure is dependent on amino acid sequence, the alignment data may be used to infer higher-order structure (i.e., secondary and tertiary protein structures). Proteins that share a high degree of similarity throughout their entire length often share homologous native conformations (Pearson, 1996). Homologous proteins are more likely to share conformational and linear epitopes than are unrelated proteins; however, the degree of similarity between homologues varies widely. Aalberse (2000) has noted that proteins sharing less than 50% identity with an allergen across the full length of the protein sequence are unlikely to be cross-reactive, and immunological cross-reactivity may not occur unless the proteins share at least 70% identity.
There are some concerns that the FASTA search might miss short segments within a protein that are identical or highly similar to an existing allergen and have the potential to bind IgE antibodies (Metcalfe et al., 1996). Since not all of the IgE-binding epitopes in known allergens have been identified, it is not possible to construct a comprehensive, validated, and robust IgE-binding epitope database for a more accurate search. Furthermore, most of the IgE-binding epitopes that have been identified are known through in vitro mapping studies using sera from only a few allergic individuals, without regard to antibody affinity. Thus, the relevance of each epitope in eliciting clinical reactions is unknown. While some IgE epitopes have been reported to be as short as five amino acids (Banerjee et al., 1999; Beezhold et al., 1999), the majority of characterized IgE-linear epitopes are eight amino acids or longer (Chatchatee et al., 2001; Reese et al., 1999; Shin et al., 1998). Although many of these reports have demonstrated IgE binding, few have tested the affinity (avidity) of the binding, or the allergic significance of the in vitro binding, and it is clear from some reports that high-affinity binding requires eight or more amino acids (Banerjee et al., 1999; Rabjohn et al., 1999).
In the absence of a complete description of IgE epitopes for all known allergens, all possible peptides of a given length can be considered as potential epitopes, and short peptide matches between a target protein and known allergens can be generated using computer software or manual scanning. Such sliding window searches can be viewed as a highly conservative and all-inclusive approach, as most of the peptides do not represent epitopes. When this approach was first suggested (Metcalfe et al., 1996), a window size of eight amino acids was recommended. In the ensuing years, the appropriate window size for this type of assessment has been debated in the literature (Hileman et al., 2002; Kleter and Peijnenburg, 2002; Stadler and Stadler, 2003) and by scientific panels with a window size of six amino acids being suggested by FAO/WHO (2001). Recognizing that a consensus in the scientific community had not been reached, the Codex Alimentatrius Commission (2003), an intergovernmental task force whose mission is to harmonize standards for testing of foods derived from biotechnology, recommended that “The size of the contiguous amino acid search should be based on a scientifically justified rationale in order to minimize the potential for false negative or false positive results.” With this in mind, we performed a series of analyses with the intent of determining match probabilities between a peptide sequence derived from a query protein and a peptide sequence from a protein allergen. Four probability modeling methods, each representing an incremental improvement in accuracy and complexity were tested. The modeling methods employed were: (1) a mock protein and a mock allergen database, (2) a mock protein and genuine allergen database, (3) a genuine allergen and genuine protein database, and (4) a genuine allergen and genuine protein database combined with a correction for repeating peptides. The genuine allergen database representing all known allergens (FARRP5) and the query protein database representing all known proteins (NRAA) were used to determine if there was a scientifically justified search window size that identified allergen sequence characteristics.
MATERIALS AND METHODS
Allergen Databases
Mock allergens.
The randomly-generated protein sequences in four mock-allergen databases were created using a Perl script, assuming each of the 20 amino acids had an equal chance to appear in any given position. The four databases contained 500, 1000, 2000, or 3000 random proteins, ranging from 90 to 400 amino acids with an average size of 245 per protein. The proteins were converted into four searchable databases using the DATASET program in GCG Wisconsin package (Version 10.3, Accelrys, Inc, San Diego, CA) run on a Sun Microsystems computer under the SunOS 5.6 operation system (Sun Microsystem, Inc.).
Genuine allergens.
The allergen databases established and maintained by the Food Allergen Research and Resource Program (FARRP) at University of Nebraska were used in this study. FARRP4, the progenitor of the FARRP5 database contained 752 protein sequences and was available at http://www.allergenonline.com through September 2004. The current version of the FARRP database, FARRP5, contains 1191 sequences and is accessible at the website, http://www.allergenonline.com/.
Protein Databases
Mock proteins.
A total of three sets of random query proteins were created. Each set of query proteins consisted of 100 proteins with sizes ranging from 90 to 400 amino acids, with an average of about 256 amino acids per protein. The proteins were created using a Perl script, assuming each of the 20 amino acids had an equal chance to appear in any given position.
Genuine proteins.
The NRAA (nonredundant amino acids) and NRAA1 databases were assembled using all nonredundant GenBank CDS translations + RefSeq proteins + PDB + SwissProt + PIR + PRF. NRAA was downloaded September 2004 and was composed of 1,947,503 protein sequences. The NRAA1 was downloaded September 2003 and was composed of 1,408,970 protein sequences.
Assembly of Peptide Libraries
Mock proteins and allergen databases.
Each sequence in the three sets of randomly generated query proteins, containing 100 proteins per set, was parsed into all possible overlapping fragments of five, six, seven, and eight amino acids with a Perl script. Each peptide was used to search four random mock-allergen databases or FARRP5 for exact matches using FINDPATTERN program in the GCG Wisconsin package. The number of mock proteins generating matches was extracted from the output of the search, and the percentage of proteins containing matches was calculated.
Genuine proteins and allergens.
The FARRP5 and NRAA protein sequence databases were parsed into libraries of short peptides containing four, five, six, seven, eight, and nine amino acids long using UNIX shell scripts. The peptide libraries were assembled from two FASTA format files, one containing the FARRP5 allergen database, and the second containing the NRAA database. Once parsed, the peptides were filtered to remove ambiguous amino acids (i.e., X) and counted to determine the total number of peptides of a given size. The peptides were then sorted, and replicated peptides were counted and removed to determine the number of unique peptides. To determine the total number of peptides defined by the FARRP5 database that are found in the NRAA database, the file containing the counted replicated peptides from the NRAA database was merged with the file containing unique peptides of the same size from the FARRP5 database. This merged file was then sorted and peptide sequences not common to both databases were removed. Then for the remaining peptide sequences, the peptides derived from FARRP5 were removed. The resultant file contained a tally for the number of occurrences of each peptide derived from NRAA that was identical to a peptide found in FARRP5.
Probability Calculations
Mock protein and allergen databases.
The probability of obtaining a match between one or more peptides of length SP amino acids from a query protein of length L random amino acids and a database of DP random peptides of length SP was calculated as follows.
PN = 20SP, the number of possible unique short peptides of length SP.
QS = L − SP + 1, the number of short peptides in a query protein.
QP = 1 − (1 − IP)QS, the probability of a given short peptide occurring in a query protein.
EP = QP × PN, the expected number of unique peptides in the query protein.
PB = 1 − (1 − DP/PN)EP, the probability that there is at least one short peptide in the query protein that is also present in the database.
We calculated the probabilities of a match using peptides of six or eight amino acids (SP) from query proteins consisting of 100, 200, 300, or 400 amino acids (L) and database sizes of 50,000, 100,000, 200,000, or 400,000 peptides (DP).
Genuine protein and allergen databases.
Single match probability estimates were performed using two related but distinct methods. PBU, the proportion of unique peptides of a given length derived from proteins in the NRAA database that are also found among the peptides of that length derived from the FARPP5 database, was calculated as UAD/UNRAA. PBU = UAD/UNRAA, where UAD is the number of unique peptides from FARRP5, and UNRAA is the number of unique peptides derived from NRAA. The PBU probability estimate assumes that proteins are composed of equimolar ratios of all amino acids. The PBR probability estimate takes into consideration the actual amino acid stoichiometry of proteins. PBR = MAD/TNRAA, where MAD is the number of peptides of the given length derived from NRAA that are not from an allergen but that do match a peptide derived from FARRP5, and TNRAA is the total number of peptides of the given length derived from NRAA.
Probability calculations for proteins.
The probability that at least one peptide from a given protein matches a peptide found among proteins in FAARP5 depends on the length of the query protein according to the following formula: PRpro = 1 − (1 − PBU)QS or PRpro = 1 − (1 − PBR)QS. PBU is the probability of a single peptide match based on unique peptides; PBR is the probability of a single peptide match if repeated peptides are considered. QS is the number of short unique peptides in a query protein.
RESULTS
Mock Protein and Mock Allergen Databases
In order to estimate the random error that might be expected when searching for short-peptide matches, hypothetical protein sequences and mock allergen databases were constructed that contained any of the 20 possible amino acids at any position with equal probability. Three sets of query proteins derived from random amino acid sequences were searched for peptide matches of five, six, seven, and eight amino acids against four random mock-allergen databases ranging from 500 to 3000 proteins. When searching for matches of five amino acids, 97% to 100% of the randomly generated proteins contained matches, increasing as the size of the mock databases increased from 500 to 3000 proteins. When a search was conducted for matches of six amino acids against a database with 500 proteins, 23.67% of the proteins generated matches. However, this number dramatically increased to 80.33% when the database was increased to 3000 proteins. Although significantly reduced, a similar trend could be seen when a search for matches of seven amino acids was conducted (1.67–6.33%). The search for matches of eight amino acids resulted in an even lower incidence of matches with all four mock-allergen databases (0–0.5%) (Fig. 1).
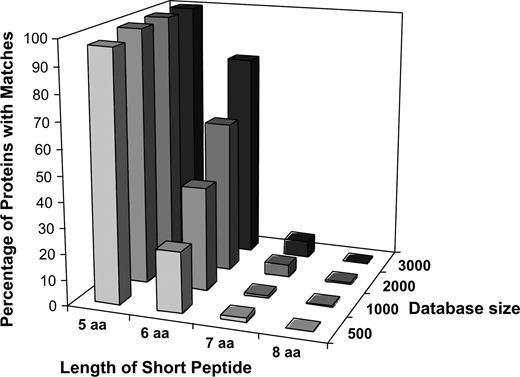
Effect of database size and peptide length on match frequency with mock query proteins and mock-allergen databases. Three sets of mock query proteins (each containing 100) were searched for peptide matches of five, six, seven, and eight amino acids against four mock-allergen databases ranging from 500 to 3000 proteins. The percentage of mock query protein with matches was calculated.
The previous analysis was based on the probability of a single peptide match. However, it should be noted that a query protein consists of multiple overlapping peptides defined by the size of the search window and the length of the protein. Randomly generated proteins of 100, 200, 300, or 400 amino acids were analyzed using a six- or eight-amino acid search window and compared to similar-sized peptides in increasing sizes of databases (Fig. 2). A large increase in the number of peptide matches was observed as the size of the protein increased from 100 to 400 amino acids and as the size of the database increased. Increases in match probabilities dependent on the query protein size ranged from 2.0- to 4.4-fold for any given database size. Furthermore, match probabilities increased 149- to 398-fold for a six- versus an eight-amino acid search window (within a given query protein size and database size). As illustrated before, the number of peptide matches decreased dramatically as the search window size was increased from six amino acids to eight amino acids. Greater numbers of random hits are expected for genuine proteins, where certain amino acids are more prevalent than others, and certain functional amino acid patterns are present more frequently than would occur by chance alone.
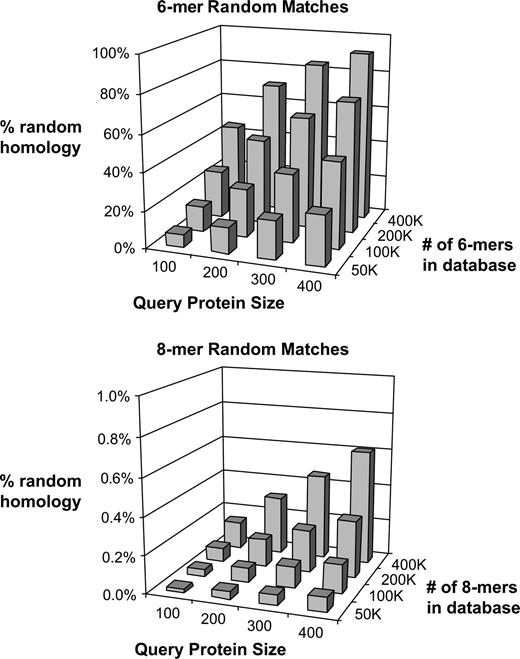
Probability of obtaining a random match of six or eight contiguous amino acids between a randomly generated protein of 100, 200, 300, or 400 amino acids and a randomly generated protein database containing 50,000, 100,000, 200,000, or 400,000 six- or eight-amino acid short peptides. The probability was calculated using the following formula: PB = 1 − (1 − DP/PN)QP×PN, where PB is the probability of a short peptide in both the query protein and a database; SP is the number of amino acids in short peptides; QS is the number of short peptides in a query protein (amino acid number—SP +1); IP is the probability of obtaining a single unique short peptide (0.05SP); QP is the probability of a given short peptide occurring in a query protein (1 − (1 − IP)QS); PN is the total possible unique short peptides (1/IP); DP is the total number of unique short peptides in the mock-allergen database.
Mock Protein and Genuine Allergen Databases
To determine if similar match frequencies were observed when using a genuine allergen database, the three sets of random query proteins were searched for short peptide matches of five, six, seven, and eight amino acids against the FARRP5 allergen database. As seen for the mock-allergen databases, the frequency of random query proteins generating matches to the genuine allergen database was high when searching for matches of five (97.67%) or six amino acids (26.67%). This value was significantly reduced when searching for matches of seven (1%) or eight (0) amino acids (Fig. 3). These results suggest that searching for matches of short peptides such as five or six amino acids against a genuine allergen database would generate a high rate of random false positive hits.
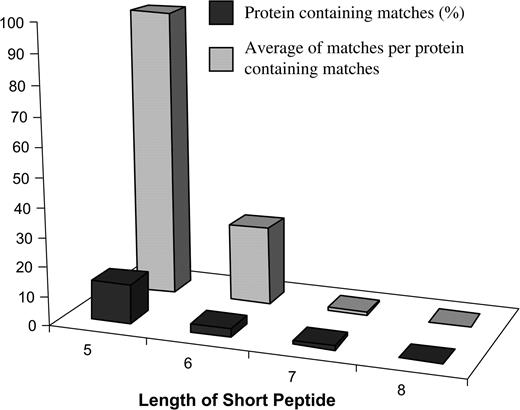
Frequency of short peptide matches between mock query proteins and FARRP allergen database. Three sets of mock query proteins (each containing 100) were searched for peptide matches of five, six, seven, and eight amino acids against the FARRP5 allergen database (1191). The percentage of mock query protein with matches and number of matches per mock query protein with matches were calculated.
Genuine Protein and Genuine Allergen Databases—Unique Peptides
To further evaluate small peptide searches for their ability to identify allergens, authentic protein (NRAA) and allergen (FARRP5) databases were used to determine the probability of obtaining matches. To perform this analysis, the theoretical number of short peptides that could possibly exist in nature must be determined for each peptide size. When the length of short peptides is set as four amino acids, there are 160,000 potential peptide sequences. However, there are 235,875 and 649,490,684 four-amino acid peptides generated from the FARRP5 and NRAA databases, respectively (Table 1). This result indicates that certain peptides in each database are repeated. After removal of repeated peptides, the number of unique peptides with four amino acids in the FARRP5 database was 65,558. The number of unique peptides in the NRAA database was the theoretical limit of 160,000. Similar procedures were performed for short peptides ranging in size from five to nine amino acids in length (Table 1). For short peptides of five amino acids or greater, the number of unique peptides in each database is less than the theoretical number of unique peptides determined for each length. This is likely because, in nature, proteins are not composed of equimolar quantities of the 20 amino acids; alternatively, the database analyzed does not contain a sufficient number of proteins to yield all possible peptides of a given length.
Summary of Peptide Numbers and Match Probabilities for Peptides Derived from the FARRP5 and NRAA Databases
FARRP5 database | NRAA database | ||||||||
|---|---|---|---|---|---|---|---|---|---|
| Peptide length aa | Totala | Unique (UAD) | Total (TNRAA) | Unique (UNRAA) | MADb | PBR | PBU | ||
| 4 | 235,875 | 65,558 | 648,492,662 | 160,000 | 412,429,612 | 63.7% | 40.8% | ||
| 5 | 234,623 | 112,938 | 646,434,405 | 3,192,911 | 57,977,059 | 9.01% | 3.52% | ||
| 6 | 233,378 | 124,066 | 644,283,763 | 50,107,800 | 5,806,296 | 0.906% | 0.246% | ||
| 7 | 232,138 | 129,396 | 642,215,545 | 230,152,753 | 1,301,311 | 0.207% | 0.056% | ||
| 8 | 230,905 | 133,415 | 640,153,833 | 334,886,473 | 771,310 | 0.120% | 0.040% | ||
| 9 | 229,677 | 136,804 | 638,097,856 | 357,462,789 | 593,127 | 0.095% | 0.038% | ||
Note. Match probabilities for unique peptides were calculated using the following formula: PBU = UAD/UNRAA × 100%, where PBU is the probability of a single peptide match based on unique peptides; UAD is the number of unique peptides of a given size derived from FARRP5; UNRAA is the number of unique short peptides of a given size derived from NRAA. Match probabilities for repeated peptides were calculated using the following formula: PBR = MAD/TNRAA × 100%, where PBR is the probability of a single peptide match if repeated peptides are considered; MAD is the number of peptides of a given size derived from NRAA that match a peptide in FARRP5; TNRAA is the total number of peptides of a given size derived from NRAA.
These values represent peptides that contain only the 20 unambiguous IUPAC amino acids; peptides that contain ambiguous amino acid designations were excluded.
These values have been corrected to exclude peptides derived from known allergens.
With this information it was possible to calculate the overall frequency of matches that occur between genuine proteins and allergens, depending on the peptide size chosen to perform the analysis. The probability of one or more unique peptides derived from an allergen having a four to nine contiguous amino acid match with a unique peptide derived from the NRAA database was calculated using the formula in Table 1. The match frequencies ranged from a high of 40.8% when using a sliding window of four amino acids to a low of 0.038% when using a nine-amino acid peptide (Table 1).
To understand what effect increasing database size may have on the proportion of all peptides that are in an allergen database when using genuine allergen and protein databases, an analysis identical to that already described for the FARRP5 and NRAA databases was performed using FARRP4 and NRAA1, older (and smaller) versions of each database. The older versions of the databases contain 38 and 59% fewer proteins than the most current forms of the NRAA and FARRP5 databases, respectively. This increase in the total number of proteins from older to newer databases resulted in a concomitant increase in the number of unique and repeated peptides in each database. For example, the older FARRP4 database contained 93,604 unique six-amino acid peptides; while the FARRP5 database contains 124,066 a 33% increase (see Table 2). In contrast, the NRAA1 database contained 45,756,362 unique six-amino acid peptides, while the NRAA database contains 50,107,800 a 9.5% increase (see Table 2). Thus, small databases will accumulate additional unique small peptides more rapidly than larger databases because a smaller percentage of the possible combinations are represented. This resulted in an increase in match frequency for most peptide search windows when using a larger database than when using a smaller database. For example, when using a four-amino acid search window, match frequencies increased from 55.8 to 63.7% as the number of proteins present in the database increased. However, as the search window size increased from seven to nine amino acids in length, there was either no increase or a small decrease in peptide matching frequency (Table 2). These results demonstrated that the chance of matching a short peptide in a query protein to a short peptide in a given protein database increases with the size of the database and the attenuation of the match size.
Summary of the Effect of Increasing Database Sizes on the Peptide Match Probabilities PBR and PBU
Peptide length aa | Percent increase in unique peptides derived from FARRP4 to FARRP5 | Percent increase in unique peptides derived from NRAA1 to NRAA | Percent change in PBR FARRP4 to FARRP5 | Percent change in PBU FARRP4 to FARRP5 |
|---|---|---|---|---|
| 4 | 19.3 | 0.0 | 14.2 | 18.9 |
| 5 | 30.7 | 0.2 | 28.7 | 30.3 |
| 6 | 32.5 | 9.5 | 25.5 | 21.0 |
| 7 | 33.2 | 33.0 | 11.3 | 0.00 |
| 8 | 33.5 | 44.2 | 3.44 | −6.98 |
| 9 | 33.8 | 46.8 | 0 | −9.52 |
To understand what effect, if any, query protein size had on match frequency, the probability that a peptide derived from an NRAA protein will match a peptide derived from the FARRP5 database (PRpro) was calculated using a search window size of six, seven, or eight amino acids. The PRpro was then plotted against protein length expressed as the number of peptides contained in that protein (Fig. 4). The graph clearly shows that, for all search window sizes tested, the number of matches increases as the size of the proteins increases. This is especially evident for the six-amino acid search window, where the probability of a match with a peptide derived from the FARRP5 database approaches 100% as the length of the protein approaches 300 amino acids. Even the seven- and eight-amino acid search windows resulted in high probabilities of a match, giving 90 and 35%, respectively when proteins reached the maximum size tested of 1000 amino acids.
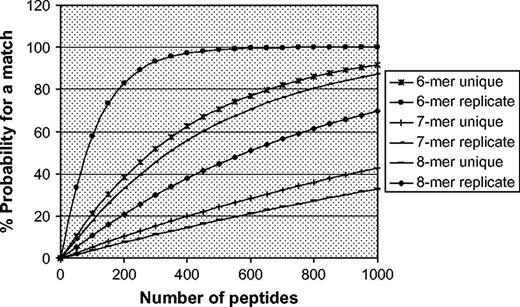
The effect of protein length on match probability. Percent probability of a match was calculated using the following formula: PRpro = 1 − (1 − PBU)QS or PRpro = 1 − (1 − PBR)QS, where PBU is the probability of a single peptide match based on unique peptides; PBR is the probability of a single peptide match if repeated peptides are considered; QS is the number of short unique peptides in a query protein. Number of peptides indicates the length of the protein; % probability for a match indicates the frequency with which a peptide derived from a protein will match a peptide in the FARRP5 database.
Genuine Protein and Genuine Allergen Databases—All Peptides
The probability calculations based on unique peptides provided a more realistic view of match frequencies than those based on mock databases, because the analysis only used those peptides that exist in known proteins. However, since many of the peptides are repeated in each database, a further refinement on this calculation could be achieved if redundancy among known peptides was factored into the probability calculations. As shown in Table 1, match probabilities increased dramatically from 40.3 to 63.7% for a four-amino acid peptide and from 0.038 to 0.095% for a nine-amino acid peptide (Table 1) when redundancy of known peptides was taken into account.
DISCUSSION
A number of studies have analyzed the effect of search size window on the frequency of matches between proteins and peptides derived from a database containing protein allergens (Goodman et al., 2002; Hileman et al., 2002; Kleter and Peijnenburg, 2002; Stadler and Stadler, 2003). In each of these studies it was noted that searching for six contiguous amino acid identities yielded extremely high match frequencies. Based on a six-amino acid window search size alone, these studies showed that 60–80% of all protein sequences, regardless of their source, might be viewed as potential cross-reactive allergens. Given that these searches overestimated potential protein allergen frequencies (approaching two of every three proteins found in a database), Stadler and Stadler (2003) proposed that a motif-based allergen prediction scheme be used in place of this type of search. Likewise, observing matches in two of every three proteins, Kleter and Peijnenburg (2002) further analyzed those proteins identified using the six-amino acid window size search by using Hopp and Woods (1983) antigenicity predictions. Although all of these studies clearly demonstrated high frequencies of six-amino acid peptide matches, none of the studies looked at sliding window searches in depth from the perspective of the match probability, distribution of unique short peptides, or database size. By doing so, we are able to demonstrate that the match frequencies observed in these earlier studies were simply a product of chance.
We examined the match frequencies on the basis of simple probability calculations, considering the size of the database and the length of the match window. These probability calculations were derived from both a hypothetical approach and by using four genuine protein databases. These analyses predict both match probabilities and the impact of increasing database size on these probabilities. Single match probabilities were estimated using two methods. First, the probabilities were calculated using unique peptides (PBU), which represent the lower limit of single match probabilities for a sliding window search. However, the intent of a sliding window search is to identify peptides common to a query protein and an allergen, and as expected, short peptide sequences are often repeated within protein databases. To account for short peptide redundancy and to arrive at a probability estimate that reflects this redundancy in nature, peptides derived from the NRAA database that match peptides from the FARRP5 database were identified, and the total number of peptides was determined. After removing the peptides derived from known allergens, this total was then divided by the total number of peptides of the same size derived from the NRAA database to yield the probability estimate (PBR). When accounting for peptide redundancy, the single match probability for peptides with six or more amino acids increased 2.5- to 3.5-fold when compared to a probability calculated using unique peptides.
Another factor that could have impact on single match probabilities is the size of a database to which a query protein is compared. Using a completely probabilistic random model, single match frequencies of short peptides increased with increasing database size. Analysis of single match frequencies established using two pairs of genuine databases also indicated that, as database size increases, the match probability (PBu) increases for short peptides with four to six amino acids. Inspection of the numbers of unique peptides derived from the database pairs revealed the origin of this trend. As is shown in Tables 2 and 3, either the NRAA or NRAA1 databases, contain all 160,000 possible four-amino acid peptides. In contrast, moving from FARRP4 to FARRP5, the number of unique four-amino acid peptides increased 19.3% from 54,971 to 65,558. With the addition of every new protein sequence to an allergen database, the probability of a random four-amino acid peptide match to a query protein increases. This same trend holds true for five- and six-amino acid peptide search probabilities. In the instance of seven-amino acid peptides, the rate of addition of unique peptides to both the allergen and NRAA databases are nearly identical, and as a result, the match probabilities using either database pair remain constant. Finally, if peptides of eight or nine amino acids are considered, the match probabilities decrease as database size increases, because the rate of addition of unique peptides to the NRAA database exceeds the rate of addition of unique peptides to the allergen database.
Inspection of the PBR values from the database pairs follows the same trend that was observed for PBU values, except that match probabilities increased as database size increased for peptides four to eight amino acids in length. Only when peptide size was nine amino acids did the database pairs yield identical PBR values.
The single match probabilities calculated in this report reveal that, for a protein that contains 400 six-amino acid peptides, the likelihood of obtaining a single match with the FARRP5 database ranges from 62 to 97%. The average of the high and low estimate, 79%, correlates very closely with the match frequencies observed by Stadler and Stadler (2003) when they performed sliding six-amino acid window peptide searches using ∼101,000 sequences from Release 40 of the SwissProt database. As a result of the Stadler and Stadler findings and the findings presented herein, it is clear that the vast majority of matches identified using a sliding window size of six amino acids is simply a product of random chance and does not facilitate the identification of biologically meaningful allergenic characteristics of a protein.
The sliding window search strategy was originally devised to be a conservative method for identifying potential IgE-binding motifs. At the time of its inception in 1996, the database of allergenic proteins contained ∼200 protein sequences. Since then, the rapid identification of new protein allergens has resulted in larger allergen databases. For example, the FARRP5 protein allergen database contains 1191 protein sequences. Along with the growth of the allergen database, discussions within the scientific community concerning the appropriate window size have uncovered flaws in the sliding window search. Unlike other sequence alignment algorithms such as FASTA or BLAST that perform statistical analyses that rank the similarity of a query protein to its corresponding matches and provide a measure of the reliability of alignment, sliding window searches are not designed to include a statistical analysis and do not assign any ranking to a match. Bioinformatic analyses based on FASTA or BLAST algorithms provide a measure of reliability by providing cut-offs (35% identity over at least 80 amino acids), above which significant IgE cross reactivity may be expected to occur (Codex Alimentarius Commission, 2003). In the absence of a ranking, matches with bona fide IgE-binding motifs are indistinguishable from false-positive matches in a sliding window search. We have shown that the results of sliding window searches are dictated by peptide size, database size, and protein length, none of which should be allowed to influence a protein's allergenic potential assessment. Since a validated, consensus IgE binding epitope database is currently not available, simply searching matches of short peptide with known allergens adds little value to assess proteins for allergenic potential. The length of the match window should be sufficiently long as to avoid excessive identification of false-positive matches due to random chance. Thus, for large proteins and an expanding allergen database, a FASTA or BLAST bioinformatics search appears to be the optimum method for identifying potential similarities between newly expressed proteins and known allergens.
References
Astwood, J. D., Bannon, G. A., Dobert, R. L., and Fuchs, R. L. (
Banerjee, B., Greenberger, P. A., Fink, J. N., and Kurup, V. P. (
Beezhold, D. H., Hickey, V. L., Slater, J. E., and Sussman, G. L. (
Chatchatee, P., Jarvinen, K. M., Bardina, L., Beyer, K., and Sampson, H. A. (
Codex Alimentarius Commission. (
FAO/WHO. (
Goodman, R. E., Silvanovich, A., Hileman, R. E., Bannon G. A., Rice E. A., and Astwood, J. D. (
Hileman, R.E., Silvanovich, A., Goodman, R. E., Rice, E. A., Holleschak, G., Astwood, J. D., and Hefle, S. L. (
Hopp, T. P., and Woods, K. R. (
Kleter, G. A., and Peijnenburg, A. A. (
Metcalfe, D. D., Astwood, J. D., Townsend, R., Sampson, H. A., Taylor, S. L., and Fuchs, R. L. (
Pearson, W. R., and Lipman, D. J. (
Rabjohn, P., Helm, E. M., Stanley, J. S., West, C. M., Sampson, H. A., Burks, A. W., and Bannon, G. A. (
Reese, G., Ayuso, R., and Lehrer, S. B. (
Shin, D. S., Compadre, C. M., Maleki, S. J., Kopper, R. A., Sampson, H. A., Huang, S. K., Burks, A. W., and Bannon, G. A. (
Author notes
*Monsanto Company, Product Characterization Center, Global Regulatory Affairs, St. Louis, Missouri 63167; and †Dow AgroSciences, Biotechnology Regulatory Science, Indianapolis, Indiana 46268

Comments