


Abstract
Gene expression profiling is an important tool in the development of medical countermeasures against chemical warfare agents (CWAs). Non-human primates (NHPs), specifically the rhesus macaque (Macaca mulatta), the cynomologus macaque (Macaca fascicularis), and the African green monkey (Chlorocebus aethiops), are vital models in the development of CWA prophylactics, therapeutics, and diagnostics. However, gene expression profiling of these NHPs is complicated by the fact their genomes are not completely sequenced, and that no commercially available oligonucleotide microarrays (genechips) exist. We, therefore, sought to determine whether gene expression profiling of NHPs could be performed using human genechips. Whole blood RNA was isolated from each species and used to generate genechip probes. Hybridization of the NHP samples to human genechips (Affymetrix Human U133 Plus 2.0) resulted in comparable numbers of transcripts detected compared with human samples. Statistical analysis revealed intraspecies reproducibility of genechip quality control metrics; interspecies comparison between NHPs and humans showed little significant difference in the quality and reproducibility of data generated using human genechips. Expression profiles of each species were compared using principal component analysis (PCA) and hierarchical clustering to determine the similarity of the expression profiles within and across the species. The cynomologus group showed the least intraspecies variability, and the human group showed the greatest intraspecies variability. Intraspecies comparison of the expression profiles identified probe sets that were reproducibly detected within each species. Each NHP species was found to be dissimilar to humans; the cynomologus group was the most dissimilar. Interspecies comparison of the expression profiles revealed probe sets that were reproducibly detected in all species examined. These results show that human genechips can be used for expression profiling of NHP samples and provide a foundation for the development of tools for comparing human and NHP gene expression profiles.
INTRODUCTION
Gene expression profiling using microarrays is an important tool in efforts to develop medical countermeasures against chemical warfare agents (CWAs) (Draghici et al., 2004). Gene expression profiling has been used to uncover mechanisms of toxicity of the vesicant sulfur mustard (Dillman et al., 2005; Sabourin et al., 2004) and to characterize the effects of low-level exposure to the organophosphonate nerve agent VX (Blanton et al., 2004). Gene expression profiling is also an important tool in CWA drug development (Dillman et al., 2004).
A variety of models have been used in these gene expression profiling studies, including rats, mice, and cultured human cells. These studies have been facilitated by commercially available oligonucleotide microarrays that are based on the sequenced genomes of rats, mice, and humans. Non-human primates (NHPs), particularly the rhesus macaque (Macaca mulatta), the cynomologus macaque (Macaca fascicularis), and the African green monkey (Chlorocebus aethiops, AGM), are also important animal models used in efforts to develop CWA medical countermeasures. However, gene expression profiling of these species is problematic given that the genomes of these species have not been completely sequenced and no commercially available oligonucleotide microarrays (genechips) exist. Given the high similarity between NHP and human genomes (e.g., 98.77% similarity between chimpanzee and human genomes, Fujiyama et al., 2002), it is reasonable to hypothesize that human genechips could be used for gene expression profiling of NHPs. Indeed, several studies that have successfully employed Affymetrix human genechips for gene expression profiling of NHPs have been published (Cáceres et al., 2003; Chismar et al., 2002; Enard et al., 2002; Kayo et al., 2001; Uddin et al., 2004; Vahey et al., 2003; Wang et al., 2004;). These studies have used rhesus, chimpanzee, gorilla, or orangutan RNA, but to date no gene expression profiling studies are available that use AGM or cynomologus RNA. To develop methods for gene expression profiling of NHPs in support of efforts to develop CWA medical countermeasures, we compared the results of rhesus, cynomologus, AGM, and human samples analyzed using human genechips. We measured the quality control metrics (e.g., fluorescent intensity, gene detection, background, noise) of human genechips probed with RNA from each of these species. Intraspecies (i.e., within a species) comparisons were made to verify data reproducibility and data quality. Interspecies (i.e., cross-species) comparisons were made to determine the performance of NHP samples relative to human samples on a human genechip. We used these data to assess the practicality of using human genechips for gene expression profiling of these NHP species. Furthermore, we evaluated the feasibility of using gene expression profiling for interspecies comparison.
MATERIALS AND METHODS
Non-human primate and human test subjects.
In conducting the research described in this report, the investigators adhered to the Guide for the Care and Use of Laboratory Animals by the Institute of Laboratory Animal Resources, National Research Council, in accordance with the stipulations mandated for an Associaton for Assessment and Accreditation of Laboratory Animal Care (AAALAC), International accredited facility. To conserve animals, we acquired blood samples from NHPs already in use with other research protocols. Female rhesus macaques (n = 4) were of Indian origin and weighed 4–5.5 kg at the time of blood sampling. In a separate experiment, these animals were previously exposed to human butyrylcholinesterase (July 2003), physostigmine (October 2003), and huprezine A (December 2003). The animals were certified to be in good health at the time of the blood collection (June 17, 2004). Male cynomologus macaques (Covance, Denver, PA) were wild caught and of Vietnamese origin. In a separate experiment, these animals had been exposed to human butyrylcholinesterase and had survived a 5.5× LD50 challenge of soman in December 2003. The animals were certified to be in good health and weighed 3–4 kg at the time of the blood collection (May 13, 2004). Both the rhesus and cynomologus macaques were housed at the Walter Reed Army Institute of Research (WRAIR, Silver Spring, MD) at the time of the blood collection. Blood from these test subjects was collected by WRAIR personnel and shipped at ambient temperature to the U.S. Army Medical Research Institute of Chemical Defense (USAMRICD) on the day of the blood collection. Male African green monkeys (n = 4) were wild caught from the Caribbean island of St. Kitts. These animals were naïve and certified in good health at the time of the blood collection. These animals were housed at USAMRICD and weighed 5.5–6.8 kg at the time of the blood collection.
Human blood samples (n = 5) were collected in accordance with approved human use protocols at USAMRICD. The test subjects were all Caucasian males ranging in age from 23–39 years of age at the time of the blood collection. All human test subjects were in apparent good health at the time of the blood collection.
Collection of blood tissue.
Whole blood tissue from each donor was collected using a 5-cc syringe and was immediately injected into a PAXgene Blood RNA Collection Tube (PreAnalytiX, Franklin Lakes, NJ). For NHP donors, whole blood tissue was withdrawn from the right or left saphenous vein. For human donors, whole blood tissue was withdrawn from the median cubital vein. Approximately 1.0 ml of whole blood tissue was obtained from the rhesus macaques, and 2.5 ml of whole blood tissue was obtained from all other donors. All samples were incubated in the PAXgene Blood RNA tube for 24 h at room temperature prior to extraction.
Isolation of RNA from whole blood tissue.
RNA was extracted from whole blood tissue according to the PAXgene Blood RNA Kit Handbook (April 2001), with minor modifications. Initial centrifugation time in step 1 of the handbook was increased from 10 min at 3000 × g to 15 min at 3000 × g to obtain a large enough pellet. After proteinase K treatment, the centrifugation time was increased from 3 min to 7 min to obtain a well-defined interface. The quality and amount of RNA was analyzed by UV spectrophotometry with a Nanodrop ND-1000 UV-Vis Spectrophotometer (Nanodrop Technologies, Wilmington, DE). All RNA was precipitated with 3 M sodium acetate, glycogen, and 100% ethanol and stored at −80°C.
Gene expression profiling.
Gene expression profiling was performed using Affymetrix Human Genome U133 2.0 Plus oligonucleotide microarrays, as described at http://www.affymetrix.com/support/technical/datasheets/human_datasheet.pdf (Affymetrix, Santa Clara, CA). Precipitated RNA was removed from the −80°C freezer, thawed on ice, and centrifuged for 15 min at 16,000 × g at 4°C. The supernatants were removed via pipette, and the pelleted RNA was washed with 75% ethanol and centrifuged for 10 min at 16,000 × g at 4°C. The supernatant was removed, and the pelleted RNA was washed a second time with 95% ethanol and centrifuged for 10 min at 16,000 × g at 4°C. The supernatant was removed and the RNA pellets were allowed to air dry at room temperature for approximately 15 min. Samples were reconstituted in 60 μl of RNase-free water and analyzed by UV spectrophotometry and by microcapillary electrophoresis using an Agilent Bioanalyzer (Agilent, Palo Alto, CA).
Because there was a limited supply of total RNA from the rhesus macaques and cynomologus macaques, two rounds of linear amplification were performed on all samples using the Bioarray RNA Amplification and Labeling System (Enzo Life Sciences, Farmingdale, NY). Briefly, 75–500 ng of total RNA was used to generate first-strand cDNA. A T7-dt primer was used to prime reverse transcription and incorporate a T7 promoter sequence into the cDNA. RNA was eliminated by base hydrolysis followed by neutralization. A proprietary homopolymeric tail was added to the 3′ end of the first-strand cDNA followed by chain termination. A site-specific primer complimentary to the homopolymeric tail was used to initiate second strand cDNA synthesis. After second strand synthesis, the purified double-stranded cDNA was used to perform in vitro transcription, resulting in approximately a 100-fold increase of copy RNA (cRNA). The cRNA was purified with RNeasy columns (Qiagen, Valencia, CA) and the concentration was determined via UV spectrophotometry. A maximum of 2000 ng of purified cRNA was used as the template in a second round of cDNA synthesis as described above. Purified double-stranded cDNA was used in an in vitro transcription labeling reaction using biotinylated UTP and CTP, resulting in a 100-fold increase of labeled target cRNA. The target cRNA generated from each sample was processed according to the manufacturer's recommendation using an Affymetrix GeneChip Instrument System (http://www.affymetrix.com/support/technical/manual/expression_manual.affx). Briefly, spiked controls were added to 15 μg of fragmented cRNA before hybridization at 45°C at 40 revolutions per minute (rpm) for 40–45 h with 10 μg of cRNA (Sartor et al., 2004). Arrays were then washed and stained with streptavidin-phycoerythrin before they were scanned on the Affymetrix GeneChip Scanner. After scanning, array images were visually inspected to confirm scanner alignment and the absence of significant bubbles or scratches on the chip surface.
Data analysis.
Scanned output files from each array were obtained using Affymetrix GeneChip Operating Software (GCOS v 1.2). Raw signal intensities were normalized using either the GCOS algorithm (Affymetrix) followed by addition of a constant (c = 1) and log transformation (log2) or the robust multi-array averaging (RMA) algorithm (Irizarry et al., 2003). The normalized data were imported as a comma separated values (.csv) file into Partek Pro 6.0 (Partek, St. Louis, MO). The imported data were analyzed by principal component analysis (PCA) to determine the significant sources of variability in the data. For hierarchical clustering, Euclidian parameters were specified to calculate interpoint distances, single linkage was specified to calculate the intercluster distances, and a cophenetic correlation was calculated. Boolean analysis (Boole, 1848) of the data was performed using Excel 2003 (Microsoft, Redmond, WA). Probe sets that exhibited an intensity with an associated p value < 0.05 for any given sample were called present. To generate the most stringent list of probe sets for intra- and interspecies comparison, we included only probe sets that were called present for each biological replicate within a given species (100% reproducibility). Once all comparisons were made, the probe set list was tabulated for each respective group comparison. The probe sets were imported into Onto-Express (Khatri et al., 2002) as a text file to classify the molecular function and biological processes represented by the probe sets. For analysis of variance (ANOVA), animal type (human or NHP) was used as the factor. A resulting list of genes differentially expressed between human and NHP whole blood tissue was compiled (Bonferonni-corrected p < 0.05).
RESULTS
Intra- and Interspecies Comparison of Quality Control Metrics for Human Genechips Hybridized with NHP or Human RNA Probes
RNA probes were synthesized from NHP or human RNA isolated from whole blood tissue as described and were then hybridized to human genechips. A number of quality control metrics are reported when a genechip is scanned to determine a gene expression profile. These metrics include chip background, chip noise (also termed Raw Q), total fluorescent intensity, the number of genes detected (called “present”) and the 3′/5′ ratio of the housekeeping gene GAPDH (a measure of probe quality). These metrics are assessed to determine the validity of the data obtained from the scanned genechip. We compared these quality control metrics for each chip probed with a particular species to determine intraspecies reproducibility and signal intensity (Table 1). We found that results were consistent within each species based on a 95% confidence interval (Table 1). We also performed an interspecies comparison of quality control metrics between each NHP and humans. We found that the only significant difference was the percent marginal call (transcripts near the threshold of detection are called marginal) for the cynomologus group. No other significant differences were observed.
Intra- and Interspecies Comparison of Quality Control Metrics for Human Genechips Hybridized with NHP or Human Probes
95% Confidence interval for mean | ||||||||||
|---|---|---|---|---|---|---|---|---|---|---|
| Metric | Species | N | Mean | Standard deviation | Standard error | Lower bound | Upper bound | Minimum | Maximum | |
| Background | African green | 4 | 46.36 | 6.51 | 3.26 | 35.99 | 56.72 | 38.89 | 54.74 | |
| Cynomologous | 4 | 49.81 | 4.84 | 2.42 | 42.10 | 57.52 | 43.62 | 55.30 | ||
| Rhesus | 4 | 48.19 | 10.80 | 5.40 | 31.01 | 65.37 | 38.17 | 61.44 | ||
| Human | 5 | 45.81 | 5.93 | 2.65 | 38.45 | 53.17 | 35.89 | 50.27 | ||
| Noise (Raw Q) | African green | 4 | 2.54 | 0.59 | 0.30 | 1.60 | 3.49 | 1.81 | 3.14 | |
| Cynomologus | 4 | 3.17 | 0.51 | 0.25 | 2.36 | 3.98 | 2.50 | 3.71 | ||
| Rhesus | 4 | 2.92 | 0.95 | 0.48 | 1.40 | 4.43 | 1.99 | 3.85 | ||
| Human | 5 | 2.60 | 0.53 | 0.24 | 1.94 | 3.26 | 1.70 | 2.98 | ||
| Total fluorescent intensitya | African green | 4 | 1.32E + 07 | 7.33E + 06 | 3.67E + 06 | 1.56E + 06 | 2.49E + 07 | 2.3E + 06 | 1.8E + 07 | |
| Cynomologus | 4 | 1.82E + 07 | 1.61E + 06 | 8.050E + 05 | 1.57E + 07 | 2.08E + 07 | 1.6E + 07 | 2.0E + 07 | ||
| Rhesus | 4 | 9.76E + 06 | 9.64E + 06 | 4.82E + 06 | 5.57E + 06 | 2.51E + 07 | 8.9E + 05 | 1.8E + 07 | ||
| Human | 5 | 1.51E + 07 | 1.02E + 06 | 4.58E + 05 | 1.38E + 07 | 1.63E + 07 | 1.4E + 07 | 1.7E + 07 | ||
| % Present | African green | 4 | 0.1365 | 0.0334 | 0.0167 | 0.0833 | 0.1897 | 0.0920 | 0.1660 | |
| Cynomologus | 4 | 0.2005 | 0.0226 | 0.0113 | 0.1645 | 0.2365 | 0.1810 | 0.2330 | ||
| Rhesus | 4 | 0.1405 | 0.0402 | 0.0201 | 0.0765 | 0.2045 | 0.0890 | 0.1870 | ||
| Human | 5 | 0.1402 | 0.0550 | 0.0246 | 0.0719 | 0.2085 | 0.0990 | 0.2300 | ||
| % Absent | African green | 4 | 0.8490 | 0.0347 | 0.0173 | 0.7938 | 0.9042 | 0.8180 | 0.8950 | |
| Cynomologus | 4 | 0.7820 | 0.0236 | 0.0118 | 0.7444 | 0.8196 | 0.7480 | 0.8020 | ||
| Rhesus | 4 | 0.8450 | 0.0423 | 0.0212 | 0.7777 | 0.9123 | 0.7960 | 0.8990 | ||
| Human | 5 | 0.8460 | 0.0566 | 0.0253 | 0.7758 | 0.9162 | 0.7540 | 0.8890 | ||
| % Marginal | African green | 4 | 0.0148 | 0.0013 | 0.0006 | 0.0127 | 0.0168 | 0.0130 | 0.0160 | |
| Cynomologus | 4 | 0.0175b | 0.0010 | 0.0005 | 0.0159 | 0.0191 | 0.0170 | 0.0190 | ||
| Rhesus | 4 | 0.0145 | 0.0021 | 0.0010 | 0.0112 | 0.0178 | 0.0120 | 0.0170 | ||
| Human | 5 | 0.0140 | 0.0016 | 0.0007 | 0.0120 | 0.0160 | 0.0120 | 0.0160 | ||
| 3′/5′ Ratio GAPDHa | African green | 4 | 7.73 | 3.92 | 1.96 | 1.50 | 13.96 | 4.43 | 13.30 | |
| Cynomologus | 4 | 2.74 | 0.44 | 0.22 | 2.04 | 3.43 | 2.15 | 3.14 | ||
| Rhesus | 4 | 3.49 | 1.85 | 0.92 | 0.55 | 6.42 | 2.45 | 6.25 | ||
| Human | 5 | 4.62 | 2.59 | 1.16 | 1.40 | 7.84 | 1.41 | 7.22 | ||
Note. Genechip quality control metrics were compared both intraspecies and interspecies. All data were tested for normality. All parameters had normal distributions except for total fluorescence intensity and the 3′/5′ ratio of glyceraldehyde-3-phosphate dehydrogenase (GAPDH). Comparison of the three NHPs to humans for each parameter was made using a one-factor analysis of variance (ANOVA) for the normally distributed parameters and a Kruskal-Wallis test (non-parametric ANOVA) for total fluorescence intensity and the 3′/5′ ratio of GAPDH. Species group was statistically significant, p < 0.05 for the marginal (%) parameter. A Dunnett's test was used to compare the three NHPs to humans. Only the cynomologus group was found to be significantly different from the humans, p < 0.05. No other significant differences were observed.
Non-normal distributions.
Significantly different from human, p < 0.05.
Analysis of Gene Expression Profiles: Principal Component Analysis
The gene expression profiles for NHP and human whole blood tissue were analyzed by PCA (Fig. 1). Each of our samples is defined by 54,000 probe sets, which represent 38,500 well-characterized genes from the completely sequenced human genome (Affymetrix Data Sheet, 2004). These 54,000 probe sets represent 54,000 response variables, giving us a 54,000-dimensional data set. Principal component analysis reduces the complexity of high-dimensional data and simplifies the task of identifying patterns and sources of variability in a large data set (Hotelling, 1933; Jolliffe, 1986). The samples (four or five biological replicates, each hybridized to a separate genechip) are represented by the spheres in the three-dimensional plot (Fig. 1). The distance between any pair of points is related to the similarity between the two samples in high-dimensional space (in this case, 54,000 variables and 54,000-dimensional space). Samples that are near each other in the plot are similar in a large number of variables (i.e., expression level of individual probe pairs). Conversely, samples that are far apart in the plot are different in a large number of variables.
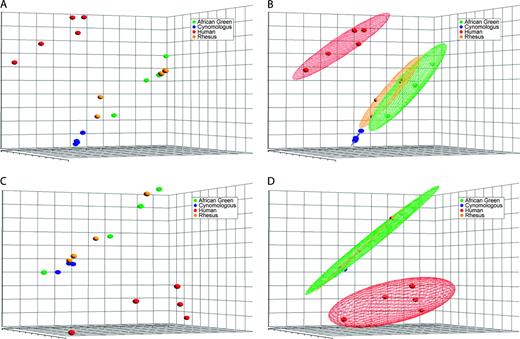
Principal component analysis of primate whole blood tissue gene expression profiles. Gene expression levels for 54,000 probe pairs (representing 38,500 genes) were uploaded to Partek Pro 6.0 and analyzed by principal component analysis (PCA). The GeneChip Operating System (GCOS) normalization algorithm (A, B) and the robust multi-array averaging (RMA) normalization algorithm (C, D) are shown for comparison. The ellipsoids (B, D) represent a two-standard deviation space from the mean of each sample set. The axes correspond to principal component 1 (PC1, x-axis), PC2 (y-axis), and PC3 (z-axis).
Analysis of the whole blood tissue gene expression profiles by PCA revealed a distinct partition between the human samples and the NHP samples (Fig. 1A–1D). This is the case using two different data normalization algorithms (GCOS, Fig. 1A, 1B; RMA Fig. 1C, 1D), indicating that the partition in the data set is independent of data transformation methods. Based on the whole blood tissue gene expression profile, no single NHP species partitions closer to humans than do the others. Ellipsoids that represent a space two standard deviations from the mean of the sample set are all closely aligned for each NHP species (Fig. 1B, 1D). Thus, our data suggest that each of the three NHP species tested is equally different from humans in an interspecies comparison of whole blood tissue gene expression profiles. Within each NHP species, the cynomologus group appears to have the least intraspecies variability. The rhesus, AGM, and human groups appear to have comparable intraspecies variability.
Analysis of Gene Expression Profiles: Hierarchical Clustering
The gene expression profiles for NHP and human whole blood tissue were analyzed by hierarchical clustering (Fig. 2). Hierarchical clustering is used to group similar objects together. At the start of the analysis each sample is considered a cluster. The two most similar clusters are combined and continue to combine until all objects are in the same cluster (termed the root). Hierarchical clustering produces a tree (dendogram) that shows the hierarchy of the clusters. The distance between the two members of the cluster determines its height. Groups of samples that are similar will be combined with short clusters, and tall clusters will separate dissimilar groups. The width of the clusters has no mathematical value.
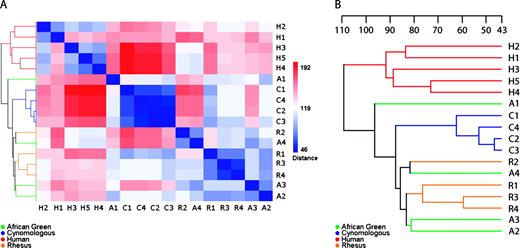
Hierarchical cluster analysis of primate whole blood tissue gene expression profiles. The data set was clustered based on sample gene expression profile as described. (A) Pairwise comparisons of sample interpoint distances are displayed as an intensity map. The color intensity is related to the interpoint distance between samples and is indicated by the intensity scale to the right of the map. Similar samples are colored blue, and dissimilar samples are colored red in the intensity map. Each sample is indicated along the bottom and to the right of the map (H: human; C: cynomologus; R: rhesus; A: African green). A dendogram of the clusters is indicated on the left of the intensity map. (B) The cluster dendogram in greater detail. The samples are indicated by color and by alphanumeric designation as described for the intensity plot. The scale bar represents the cluster distances. The cophenetic correlation was calculated to be r = 0.714.
Analysis of the whole blood tissue gene expression profiles by hierarchical clustering confirmed many of the observations made by PCA. An intensity map of pairwise comparisons of interpoint distances revealed that the cynomologus group showed the least intraspecies variability (Fig. 2A, center of intensity map). In contrast, the rhesus and AGM groups show more intraspecies variability than the cynomologus group (Fig. 2A, bottom right corner of intensity map). Variability in the human group appears comparable to that of the rhesus and AGM groups. Interestingly, sample H1 shows the least similarity to the other human group members (Fig. 2A, note red blocks in the top left corner of the intensity map). In interspecies comparisons, the greatest dissimilarity appears to be between the human group and the cynomologus group (Fig. 2A, left center of the intensity map). A detailed view of the dendogram generated by the hierarchical clustering is shown in Figure 2B. The human samples and the NHP samples separate into two distinct clusters. The human group has the greatest intraspecies variability, and thus this cluster has the greatest height. The cynomologus group has the least intraspecies variability and thus this cluster has the smallest height. Interestingly, the cynomologus samples cluster away from the rhesus and AGM samples, whereas the AGM and rhesus samples are not discretely clustered into separate distinct AGM and rhesus clusters. One AGM sample is observed clustering away from the rest of the AGM and rhesus samples nearer to the human cluster.
Analysis of Gene Expression Profiles: Analysis of Variance
The gene expression profiles for NHP and human whole blood tissue were examined using an ANOVA. Animal type (human or NHP) was used as the factor in the ANOVA to detect genes differentially expressed in human whole blood tissue compared to NHP whole blood tissue. Genes significant to a Bonferroni-corrected p < 0.05 are reported in Supplementary Data of the Supplementary Data online.
Analysis of Gene Expression Profiles: Boolean Analysis
The gene expression profiles for NHP and human whole blood tissue were examined by means of an intraspecies Boolean analysis (Boole, 1848). Probe sets having a detection p value < 0.05 for all biological replicates within a given species (100% reproducibility) were included in the total number of probe sets detected (called “present”) for that species. These results are summarized in Table 2. The Boolean analysis identified 6820 probe sets detected in the cynomologus group; 2643 probe sets detected in the AGM group; 2757 probe sets detected in the rhesus group; and 2303 probe sets detected in the human group. The results of interspecies comparisons (2-way, 3-way, and 4-way comparisons) of the probe set reproducibly detected in each intraspecies comparison are summarized in Table 2 and in a Venn diagram in Figure 3. In a 4-way interspecies comparison, 1079 probe sets were 100% reproducibly detected. These 1079 probe sets represent 1009 unique genes.
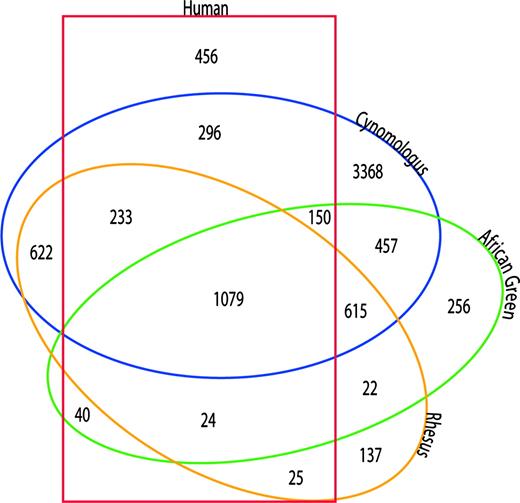
Venn diagram summarizing the Boolean analysis of primate whole blood gene expression profiles. Intra- and interspecies Boolean analyses were performed as described, and probe pair sets representing the intersection of all inter- and intraspecies comparisons were identified.
Boolean Analysis of NHP and Human Whole Blood Tissue Gene Expression Profiles
Comparison | Total # of probe sets | n |
|---|---|---|
| Human (H) | 2303 | 5 |
| Cynomologous (CM) | 6820 | 4 |
| African green monkey (AG) | 2643 | 4 |
| Rhesus macaque (RM) | 2757 | 4 |
| CM and AG | 2301 | 8 |
| CM and RM | 2549 | 8 |
| AG and RM | 1704 | 8 |
| H and CM | 1758 | 9 |
| H and AG | 1293 | 9 |
| H and RM | 1361 | 9 |
| CM, AG, RM | 1694 | 12 |
| H, CM, AG | 1229 | 13 |
| H, CM, RM | 1312 | 13 |
| H, RM, AG | 1103 | 13 |
| H, RM, AG, CM | 1079 | 17 |
Note. An intraspecies Boolean analysis was performed to identify genechip probe sets detected with 100% reproducibility. A series of 2-way, 3-way, and 4-way interspecies Boolean analyses was performed to identify genehip probe sets detected with 100% reproducibility across the various species.
Characterization of Probe Set Reproducibly Detected in Intra- and Interspecies Comparisons
To identify the molecular functions and biological processes represented by the probe sets reproducibly detected in each species and to determine whether they are similar across the species, we mapped this group of probe sets to the Gene Ontology (The Gene Ontology Consortium, 2000). The Gene Ontology (GO) project is a collaborative effort to address the need for consistent descriptions of gene products in different databases. A controlled GO vocabulary is maintained in a curated database. The GO project provides three structured networks of defined terms to describe gene product attributes. These are biological process, molecular function, and cellular compartment. We used the Web-based search engine Onto-Express to map our genes to the GO database (Khatri et al., 2002). Onto-Express translates lists of differentially regulated transcripts identified in high throughput gene expression experiments into functional profiles based on the GO. The statistical significance value is calculated, and results are displayed graphically as GO hierarchical trees. Supplementary Data of the Supplementary Data online summarizes the molecular functions represented by each group of probe sets (p < 0.01), and Supplementary Data of the Supplementary Data summarizes the biological processes represented by each group of probe sets. Although there is overlap among the species with regard to the molecular functions and biological processes represented by each group of probe sets, the cynomologus group appears to be less similar to humans than do either the AGM or rhesus groups.
To identify the molecular functions and biological processes represented by the probe pair reproducibly detected in all species (100% reproducibility in both intra- and interspecies comparisons), we mapped these 1079 probe sets (Supplementary Data of the Supplementary Data online) to the Gene Ontology (The Gene Ontology Consortium, 2000). Supplementary Data of the Supplementary Data summarizes the molecular functions represented by this group of probe sets (p < 0.01), and Supplementary Data of the Supplementary Data summarizes the biological processes represented by this group of probe sets (p < 0.01).
DISCUSSION
Non-human primates are an important animal model in the development of medical countermeasures against CWAs, particularly for determining safety and efficacy in lieu of human clinical trials. Our objective was to evaluate the suitability of using human genechips for gene expression profiling of rhesus macaques, cynomologus macaques, and AGM NHPs. We compared the quality control metrics (e.g., fluorescent intensity, gene detection, background, noise) of human genechips probed with RNA from each NHP species and from humans to assess the quality and intraspecies reproducibility of the fluorescent signal. Furthermore, we assessed the feasibility of employing gene expression profiling for interspecies comparison.
Although previous work has been published using human genechips to study NHPs, particularly rhesus, chimpanzee, gorilla, and orangutan RNA from various tissues (Cáceres et al., 2003; Chismar et al., 2002; Enard et al., 2002; Kayo et al., 2001; Uddin et al., 2004), an evaluation of the response of cynomologus macaque or AGM RNA on a human genechip is not available in the open literature. In this study we found that whole blood tissue RNA from each NHP tested generated reproducible data comparable to the data obtained using human RNA on a human genechip (Table 1). These results suggest that gene expression profiling of rhesus, cynomologus, or AGM can be performed reliably using human genechips. This conclusion is in agreement with previous studies that have examined the performance of rhesus RNA on human genechips (Chismar et al., 2002; Wang et al., 2004) and extends these observations to cynomologus and AGM RNA.
Because NHP RNA performed well on human genechips, we analyzed the actual gene expression profiles of the NHPs and humans. Analysis of the gene expression data by PCA revealed that each NHP whole blood tissue gene expression profile appears to be equally dissimilar to humans (Fig. 1). This could be due to similarities in the NHP gene expression profiles compared to humans, or to similarities in the hybridization characteristics of the NHP RNA on the genechip compared to human RNA. These results are supported by the hierarchical clustering analysis, in which the human group clusters away from the NHPs (Fig. 2). However, the intensity map representing interpoint distances between clusters suggests that the cynomologus group is more dissimilar to humans than is the rhesus or AGM group (Fig. 2A). As observed in the PCA, the intensity map, and the cluster dendogram, the cynomologus group shows the least intraspecies variability, and the human group shows the greatest intraspecies variability.
The low intraspecies variability of the cynomologus group may be a factor in the 2.5- to 3-fold greater number of probe sets observed as reproducibly detected in this group compared with the other groups (Boolean analysis, Table 2). Because a probe set was counted if it was detected (called “present”) in all replicates for a species, lower intraspecies variability would tend to result in a higher number of probe sets counted. The tight clustering of the cynomologus group (observed by PCA and cluster analysis) may be due to any of a number of factors including genetic relatedness or exposure history. These observations would require further research to determine their significance, including gene expression profiling of completely naïve cynomologus macaques. Furthermore, a greater number of subjects in each group representing variations across gender, age, and ethnicity would be needed to assess more accurately the intraspecies biological variability.
In our interspecies comparison of the probe sets reproducibly detected across all replicates within a species, we identified a group of probe sets that is reproducibly detected across all species examined in our study. This group of probe sets maps to 1009 unique genes (Supplementary Data of the Supplementary Data online). Although the significance of this group of probe sets is not clear at present, it is interesting to speculate about potential uses for this group of probe sets. Because genes in this group of probe sets are reproducibly detected within and across the species studied, they may serve as controls useful in normalizing data collected from these different species using human genechips. Thus, these probe sets, or more likely a subset of these probe sets, have the potential to serve the purpose that “housekeeping” genes do in other types of experiments, such as Western blotting or PCR experiments. Although it is becoming clear that there are likely no universal housekeeping genes, housekeeping genes can be useful if they have been validated in a particular system (Bustin, 2002). This would require additional research looking at detection of these probe sets across an expanded population of test subjects and examining how detection of these probe sets may change after a chemical exposure. For now, this group of probe sets provides a source of potentially valuable normalization control genes useful for the future development of tools for interspecies comparisons.
One issue that is critical to consider when interpreting our data is the difference in the genomes and the mechanisms of gene expression between humans and NHPs. Although the genomes of humans and chimpanzees have been shown to be highly similar (98.77% similarity, Fujiyama et al., 2002), and presumably this is true of other NHP species, there are obviously still differences that may affect the interspecies detection of certain genes. In addition, focusing on genome similarity neglects the fact that gene expression profiling is based on mRNA expression and not on DNA sequence. A single gene does not necessarily generate a single transcript. Splicing variants are very common in the human, and humans and NHPs may use different splicing strategies in some genes. Recently, several publications have begun to address these issues of interspecies variation in gene expression and genomic sequence as it relates to the issue of analyzing NHP gene expression profiles with human genechips. Chismar and colleagues (2002) used the U95Av2 human genechip and compared the expression patterns of humans with rhesus. They concluded that the percentage of detected genes (genes called “present”) in the rhesus brain is lower than that of human brain, and that this is especially true for genes with lower signal intensity. Cáceres and colleagues (2003) used the HG-U95Av2 human genechip to identify upregulated genes in the human cortex compared with those of the NHPs. Because sequence divergence could lead to an underestimation of expression levels in NHPs, they excluded 4572 probe sets that exhibited different hybridization behavior between two sets of samples in order to reduce false positives. However, this analysis is based solely on probe set signal intensities and not on actual sequence data. Wang and colleagues (2004) employed a sequence analysis approach to assess the utility of human genechips for the study of NHP gene expression profiles. They identified probe sets conserved between rhesus and human based on sequence analysis and identified these probe sets as providing a more accurate reflection of gene expression profiles. They found that, of the 54,675 probe sets on the HG-U133 Plus 2.0 genechip (representing the entire human genome), 3636 were interspecies conserved between humans and rhesus (6.6%). Pairwise correlation coefficients of 20 samples (12 human and 8 rhesus) were calculated for expressed probe sets (0.65 ± 0.044) and for the ISC probe sets (0.80 ± 0.026). These results suggest that the reproducibility of interspecies comparisons can be increased by using a subset of probe sets that have been previously defined based on sequence analysis. This worked well for rhesus because there is a considerable amount of sequence information available in public databases. However, in the case of cynomologus macaques and African green monkeys, there is little sequence information publically available. A GenBank search on June 20, 2005, revealed 3322 total entries and 181 mRNAs deposited for African green monkeys, and 4481 total entries and 3559 mRNAs deposited for cynomologus macaques. In contrast, there were 58,815 total entries and 48,152 mRNAs deposited for rhesus macaques, and 9,279,889 total entries and 6,406,834 mRNAs deposited for humans. The disparity in sequence information among the NHPs is due to current efforts to sequence the rhesus genome, for which a draft assembly is in progress (www.genome.gov). Recent comparisons looking at specific gene families have shown that there is 5% sequence divergence between rhesus and human sequences (Gilad et al., 2003; Wall et al., 2003). Thus, there is still a considerable amount of work to be done in developing tools to compare the gene expression profiles of humans and NHPs.
In conclusion, we have shown that gene expression profiling of NHP samples using human genechips gives reliable, reproducible data. Comparison of humans with NHPs will become more robust as larger data sets are studied and new tools are advanced to address this challenge. This preliminary data set serves as the foundation for the genomic assessment of NHP responses to CWA exposure and medical countermeasures, and it will enhance efforts to develop CWA medical countermeasures that are safe and effective in humans.
DISCLAIMER
The opinions or assertions contained herein are the private views of the authors and are not to be construed as official or as reflecting the views of the Army or the Department of Defense. In conducting the research described in this report, the investigators adhered to the Guide for the Care and Use of Laboratory Animals of the Institute of Laboratory Animal Resources, National Research Council.
This work was presented in a poster session at the Society of Toxicology Annual Meeting in New Orleans, LA on March 7, 2005.
The authors certify that all research involving human subjects was done under full compliance with all government policies and the Helsinki Declaration.
We thank David Lenz for helping arrange blood collections from cynomologus and rhesus macaques off-site; Raymond Genovese and Todd Myers for providing rhesus blood samples; B. P. Doctor, Ashima Saxena, and Wei Sun for providing cynomologus blood samples; John McDonough and Joe McMonagle for providing AGM blood samples; Rich Sweeney for help with data management and development of data analysis tools; Robyn Lee for statistical consultation; Al Sylvester for data management and critical reading of the manuscript; and Gary Minsavage for critical reading of the manuscript. Conflict of interest: none declared. The data discussed in this publication have been deposited in NCBI's Gene Expression Omnibus (GEO, http://www.ncbi.nlm.nih.gov/geo/) and are accessible through GEO Series accession number GSE2634.
References
Affymetrix Data Sheet. (
Blanton, J. L., D'Ambrozio, J. A., Sistrunk, J. E., and Midboe, E. G. (
Bustin, S. A. (
Cáceres, M., Lachuer, J., Zapala, M. A., Redmond, J. C., Kudo, L., Geschwind, D. H., Lockhart, D. J., Preuss, T. M., and Barlow, C. (
Chismar, J. D., Mondala, T., Fox, H. S., Roberts, E., Langford, D., Masliah, E., Salomon, D. R., and Head, S. R. (
Dillman, J. F. III., Phillips, C. S., Dorsch, L. M., Croxton, M. D., Hege, A. I., Sylvester, A. J., Moran, T. S., and Sciuto, A.M. (
Dillman, J. F. III., Dorsch, L. M., Hege, A. I., Phillips, C. S., Kiser, R. C., Choi, Y. W., and Sabourin, C. L. (
Draghici, S., Chen, D., and Reifman, J. (
Enard, W., Khaitovich, P., Klose, J., Zollner, S., Heissig, F., Giavalisco, P., Nieselt-Struwe, K., Muchmore, E., Varki, A., David, R., et al. (
Fujiyama, A., Watanabe, H., Toyoda, A., Taylor, T. D., Itoh, T., Tsai, S. F., Park, H. S., Yaspom M. L., Lehrach, H., Chen, Z., et al. (
Gilad, Y., Man, O., Paabo, S., and Lancet, D. (
Hotelling, H. (
Irizarry, R. A., Hobbs, B., Collin, F., Beazer-Barclay, Y. D., Antonellis, K. J., Scherf, U., and Speed, T. P. (
Kayo, R., Allison, D. B., Weindruch, R., and Prolla, T. A. (
Khatri, P., Draghici, S., Ostermeier, G. C., and Krawetz, S. A. (
Sabourin, C. L., Rogers, J. V., Choi, Y. W., Kiser, R. C., Casillas, R. P., Babin, M. C., and Schlager, J. J. (
Sartor, M., Schwanekamp, J., Halbleib, D., Mohamed, I., Karyala, S., Medvedovic, M., Tomlinson, C. R. (
The Gene Ontology Consortium. (
Uddin, M., Wildman, D. E., Liu, G., Xu, W., Johnson, R. M., Hof, P. R., Kapatos, G., Grossman, L. I., and Goodman, M. (
Vahey, M., Nau, M., Taubman, M., Yalley-Ogunro, J., Silvera, P., Lewis, M. (
Wall, J. D., Frisse, L. A., Hudson, R. R., and Di Rienzo, A. (
Wang, Z., Lewis, M. G., Nau, M. E., Arnold, A., and Vahey, M. T. (

Comments