


Abstract
Alcohol screening and brief intervention (ASBI) is effective but underprovided in primary care. Financial incentives may help address this. This study assesses the impact of a local pay-for-performance programme on delivery of ASBI in UK primary care.
Longitudinal study using data from 30 general practices in north-west London from 2008 to 2011 with logistic regression to examine disparities in ASBI delivery.
Of 211 834 registered patients, 45 040 were targeted by the incentive (cardiovascular conditions or high risk; mental health conditions), of whom 65.7% were screened (up from a baseline of 4.8%, P < 0.001), compared with 14.7% of non-targeted patients (P < 0.001). Screening rates were lower after adjustment in younger patients, White patients, less deprived areas and in patients with mental health conditions (P < 0.05). Of those screened, 11.5% were positive and 88.6% received BI. Men and White patients were significantly more likely to screen positive. Women and younger patients were less likely to receive BI. 30.1% of patients re-screened were now negative. However, patients with mental health conditions were less likely to re-screen negative than those with cardiovascular conditions.
Financial incentives appear to be effective in increasing delivery of ASBI in primary care and may reduce hazardous and harmful drinking in some patients. The findings support universal rather than targeted screening.
Introduction
Problem alcohol use represents a major public health issue1 with both health and psychological effects2 and high health service costs.3 UK government policy to address this problem includes legislation on sales and marketing, public education and the recent introduction of alcohol screening and brief intervention (ASBI) into NHS health checks for people aged 40–75 years.4
ASBI is effective and cost-effective.5 A recent systematic review of 22 randomized controlled trials found that people who received a brief intervention (BI) reduced their alcohol intake by around four to five UK standard units a week.6 However, primary care practitioners are often reluctant to undertake ASBI,7,8 citing lack of training, poor support by specialist services and concern about damaging the doctor–patient relationship.9–11
The government introduced clinical directed enhanced services (DESs) in 2008, with alcohol as one of five key areas.12 This paid GPs in England £2.38 per patient (2012/13) to deliver ASBI to newly registered patients aged over 16 years using validated screening tools (AUDIT,13 AUDIT-C14,15 or FAST16). However, DES may not produce anticipated changes in clinical behaviour due to the low level of remuneration and poor monitoring of outcomes within these schemes.17 In response, several local commissioning organizations in England have developed their own schemes, which link more substantial financial incentives to the achievement of key outcomes.
There have been few studies examining the effect of financial incentives on improving delivery of ASBI in primary care. This study aimed to evaluate the effectiveness of a local financial incentive scheme on increasing delivery of ASBI in primary care. A secondary aim was to explore inequalities in access to ASBI in primary care.
Methods
Setting and patients
Hammersmith & Fulham is an inner-city borough in north-west London served by 31 general practices. There is a high proportion of people from ethnic minorities (22.2%) and young adults aged 25–39 (35.7%) compared with England averages (9.1 and 20.3%, respectively).18 Rates of alcohol-attributable hospital admissions and mortality in the borough are high, particularly for men. In 2010, the directly standardized rates for alcohol-attributable hospital admissions and alcohol-attributable deaths were 2019 and 48 per 100 000 men, respectively, higher than rates for England (1485 admissions and 35 deaths per 100 000 men).19
This high burden of alcohol-related harm led Hammersmith & Fulham to prioritize ASBI in primary care through a local version of the UK's Quality and Outcomes Framework (QOF), named QOF+,20 supported by specific computer templates and in-practice training by two academic GP registrars.21 The scheme was introduced in July 2008 and ran until 31 March 2011 when funding was withdrawn.
Description of the local financial incentive (QOF+)
At the time of the study national QOF rewarded practices for recording the alcohol consumption of people with serious mental health conditions every 15 months (4 points, £133.51 per point in 2010/11), and as part of lifestyle advice for people with hypertension (5 points). QOF+ further incentivized practices to screen patients with cardiovascular conditions, mental health conditions and patients on the cardiovascular disease risk register. QOF+ was designed so that patients eligible for payment under the alcohol DES would not be eligible for any QOF+ payments in that year for ASBI. For patients who screened positive, it further rewarded practices for providing BI, undertaking full AUDIT, referring to specialist alcohol services for those who scored ≥20 on AUDIT and for rescreening screen-positive patients (see Supplementary data, Appendix).
Design
We carried out a retrospective longitudinal study. Data were extracted from the electronic medical record (EMR)22 of patients aged over 16 years registered at 30 general practices in Hammersmith & Fulham between 1 July 2008 and 31 March 2011. One practice was excluded from the study due to inconsistent coding of dates.
Patients were divided into two groups: ‘eligible’ patients (for whom QOF+ incentivized practices to offer ASBI) and ‘ineligible’ (no incentive provided by QOF+). The eligible patients were subdivided into three groups: To avoid double counting we used a hierarchical categorization method: patients were in the cardiovascular group if they also had mental health conditions; in the mental health group if they were also on the cardiovascular risk register and in the cardiovascular risk group if they did not have the other conditions. We identified eligible patients using Read diagnosis codes acquired by patients before or during the study. We excluded patients who registered in the last 3 months of 2011, or were registered for less than 3 consecutive months, as practices might not have had sufficient time to undertake ASBI.
Cardiovascular disease or long-term condition predisposing to cardiovascular disease (coronary heart disease, hypertension, stroke, transient ischaemic attack or diabetes).
Mental health condition (depression, schizophrenia, other psychoses).
Patients aged 40–74 years on the cardiovascular risk register after screening positive on NHS Health Check.23
For the follow up study, for patients screening positive in the first period of the study (1 July 2008 to 31 November 2009), which we refer to as ‘Year 1’, outcomes were examined from ‘Year 2’ (1 December 2010 and 31 March 2011).
Outcome variables
Binary variables were used to generate the following outcome measures for all patients: Binary variables were used to generate the following outcome measures for eligible patients only: Outcome predictor variables (for eligible patients) were age group, sex, ethnicity and deprivation. Ethnicity was derived from the 2001 Census Ethnic Categories, collapsed to give five categories including ‘not-stated’. Hammersmith & Fulham staff assigned patients an Index of Multiple Deprivation (IMD) score24 based on post-code before the data were anonymized and extracted. Ethics approval was granted by London Queen Square Research Ethics Committee.
proportion screened using AUDIT-C or FAST questionnaires;
proportion screened who had a positive score;
proportion with a positive score who received a BI;
proportion with a positive score who underwent full AUDIT screening;
proportion whose AUDIT scores suggested dependent drinking (20+), and who were referred to specialist alcohol services;
proportion with a positive score in Year 1 who were rescreened in Year 2;
proportion with a positive score in Year 1 who subsequently scored negative on rescreening.
Statistical analysis
We used descriptive statistics to compare the proportions of patients achieving the outcomes of interest before and after the introduction of QOF+. We also compared differences between eligible and ineligible groups after the introduction of QOF+.
We then examined differences in outcomes for eligible patients only. Bivariate analyses for these outcomes by gender, age group, ethnicity, IMD and practice size were all statistically significant (not reported). We therefore included all predictor variables in a multivariate logistic regression model, taking into account clustering at the general practice level using clustered robust standard errors in the regression. We analysed the data with STATA version 11.
RESULTS
Outcomes for all registered patients
Over the study period there were 211 834 patients aged over 16 years registered at participating general practices in Hammersmith & Fulham. Of these, 45 040 patients were eligible for ASBI under QOF+. Outcomes for the patients are summarized in Fig. 1. Only 4.8% of eligible patients and 0.32% of ineligible patients had a record of alcohol screening prior to the introduction of QOF+, with few patients in either group having a recording of receiving a BI. Following the introduction of QOF+, 65.7% (29 596) of eligible patients had a record of receiving alcohol screening and 14.7% (24 512) of ineligible patients. These results show large increases in screening rates for both groups compared with the pre-QOF+ period [adjusted odd ratio (AOR) 72.0, 95% confidence interval (CI) 12.1–427.7, P < 0.001, the wide CI reflecting the small numbers initially screened]. However, patients eligible for ASBI under QOF+ were much more likely to receive alcohol screening than those not eligible (AOR 7.54, CI 5.67–10.01, P < 0.001) .
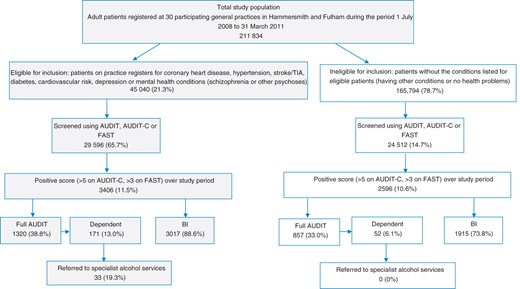
Flow diagram for ASBI over the study period.
Of the eligible screened patients, 11.5% (3406) screened positive for hazardous and harmful drinking, not significantly different from the proportion of ineligible screened patients, of whom 10.6% (2596) were positive. However, 88.6% (3017) of positive eligible patients received a BI compared with 73.8% (1915) of ineligible positive patients (AOR 2.15, CI 1.55–2.98, P < 0.001). Eligible patients with a positive score were also more likely than ineligible patients to receive full AUDIT screening [38.8% (1320) versus 33.0% (857), AOR 1.54, CI 1.15–2.07]. Of the eligible patients receiving a full AUDIT, 171 (13%) scored 20+, suggesting dependent drinking, significantly more than for the ineligible group, of whom only 52 (6.1%) scored 20+ (AOR 2.00, CI 1.47–2.65). Of dependent drinkers in the eligible group, 19.3% (33) were referred to specialist alcohol services, whereas none of the dependent drinkers in the ineligible group had been coded as having been referred to these services.
Eligible patients: variation in outcomes between groups
Screening with AUDIT-C and FAST
We found that younger patients were less likely to be screened than older patients. Only 44.0% of under-30s and 54.0% of patients aged 30–49 years were screened compared with 73.2% of those aged 50–69 years (P < 0.001). Black and South Asian patients were more likely to be screened than White patients (73.5% of Black patients and 80.3% of South Asian patients compared with 67.9% of White patients (P < 0.001). Patients from more deprived areas were somewhat more likely to be screened than those from the most affluent areas (68.9% versus 63.0, P < 0.05). Patients with mental health conditions were much less likely to be screened than those with cardiovascular diseases (48.6.4 versus 75.8%, P < 0.001). These results are shown in Table 1.
Patient and practice characteristics associated with eligible patients receiving an alcohol screening test (AUDIT-C or FAST)
| Eligible | Screened | ||||
|---|---|---|---|---|---|
| n | % | n | % | AOR (CI) | |
| Gender | |||||
| Femalea | 23 878 | 53.02 | 15 339 | 64.24 | 1 |
| Male | 21 162 | 46.98 | 14 257 | 67.37 | 0.98 (0.89–1.07) |
| Age group | |||||
| <30 | 3571 | 7.93 | 1570 | 43.97 | 0.44** (0.36–0.53) |
| 30–49 | 13 214 | 29.34 | 7139 | 54.03 | 0.58** (0.51–0.67) |
| 50–69a | 16 957 | 37.65 | 12 416 | 73.22 | 1 |
| >70 | 11 298 | 25.08 | 8471 | 74.98 | 0.92 (0.81–1.04) |
| Ethnicity | |||||
| Whitea | 28 857 | 64.07 | 19 591 | 67.89 | 1 |
| Black | 4359 | 9.68 | 3207 | 73.57 | 1.20** (1.06–1.37) |
| South Asian | 2361 | 5.24 | 1896 | 80.30 | 1.60** (1.10–2.32) |
| Mixed | 1332 | 2.96 | 974 | 73.12 | 1.22 (0.92–1.61) |
| Other | 3761 | 8.35 | 2515 | 66.87 | 0.97 (0.84–1.11) |
| Not stated | 4370 | 9.70 | 1413 | 32.33 | 0.22** (0.15–0.32) |
| Deprivationb | |||||
| Least depriveda | 12 915 | 28.67 | 8139 | 63.02 | 1 |
| Middle deprived | 15 237 | 33.83 | 9918 | 65.09 | 1.08 (0.92–1.27) |
| Most deprived | 15 892 | 35.28 | 10 942 | 68.85 | 1.25* (1.01–1.56) |
| Disease group | |||||
| CVa | 26 091 | 57.93 | 19 763 | 75.75 | 1 |
| MH | 15 939 | 35.39 | 7745 | 48.59 | 0.42** (0.36–0.51) |
| CV risk | 3010 | 6.68 | 2088 | 69.37 | 0.72 (0.55–0.94) |
| Practice size | |||||
| <6000a | 16 869 | 37.45 | 10 960 | 64.97 | 1 |
| 6000–10 000 | 10 383 | 23.05 | 6600 | 63.57 | 1.17 (0.63–2.16) |
| >10 000 | 17 788 | 39.49 | 12 036 | 67.66 | 1.44 (0.74–2.81) |
| Total | 45 040 | 100 | 29 596 | 65.71 | |
Patients on practice registers for: coronary heart disease, hypertension, stroke/TIA, diabetes [cardiovascular (CV) group]; depression, schizophrenia or other psychoses [mental health (MH) group]; cardiovascular risk (CV risk group); n, number of eligible patients; n, number, %, percentage, of patients with outcome recorded; AOR, adjusted odds ratio; CI, 95% confidence interval.
aReference group.
bMissing (996).
*P < 0.05, **P < 0.001.
Patients screening positive and receiving a BI
As shown in Table 2, older patients were much less likely than all other age groups to screen positive for harmful or hazardous alcohol use (7.0% for over 70s versus 14.4% for the 50–69 years comparison group, P < 0.001). Men were substantially more likely than women to screen positive (17.5 versus 6.0%, P < 0.001) and White patients were also significantly more likely to screen positive than other ethnic groups (14.6% compared with rates ranging from 3.4 to 8.6%, P < 0.001).
Patient and practice characteristics associated with eligible patients screening positive and receiving BI over the whole study period
| Screened | Positive | Receiving BI | |||||
|---|---|---|---|---|---|---|---|
| N | n | % | AOR (CI) | n | % | AOR (CI) | |
| Gender | |||||||
| Femalea | 15 339 | 912 | 5.95 | 1 | 764 | 83.77 | 1 |
| Male | 14 257 | 2494 | 17.49 | 3.45** (3.00–3.85) | 2253 | 90.34 | 1.54** (1.22–1.94) |
| Age group | |||||||
| <30 | 1570 | 194 | 12.36 | 1.10 (0.87–1.34) | 146 | 75.26 | 0.47** (0.29–0.75) |
| 30–49 | 7139 | 837 | 11.72 | 0.92 (0.81–1.03) | 737 | 88.05 | 0.98 (0.78–1.24) |
| 50–69a | 12 416 | 1785 | 14.38 | 1 | 1611 | 90.25 | 1 |
| >70 | 8471 | 590 | 6.96 | 0.45** (0.40–0.52) | 523 | 88.64 | 0.74* (0.57–0.97) |
| Ethnicity | |||||||
| Whitea | 19 591 | 2863 | 14.61 | 1 | 2545 | 88.89 | 1 |
| Black | 3207 | 164 | 5.11 | 0.33** (0.28–0.91) | 136 | 82.93 | 0.60* (0.37–0.98) |
| South Asian | 1896 | 93 | 4.91 | 0.30** (0.20–0.39) | 86 | 92.47 | 1.38 (0.40–4.73) |
| Mixed | 974 | 79 | 8.11 | 0.59** (0.45–0.76) | 70 | 88.61 | 0.92 (0.34–2.46) |
| Other | 2515 | 85 | 3..38 | 0.18** (0.14–0.24) | 72 | 84.71 | 0.64 (0.33–1.25) |
| Not stated | 1413 | 122 | 8.63 | 0.57** (0.36–0.90) | 108 | 88.52 | 1.09 (0.57–2.08) |
| Deprivationb | |||||||
| Least depriveda | 8139 | 944 | 11.60 | 1 | 856 | 90.68 | 1 |
| Middle deprived | 9918 | 1204 | 12.14 | 1.17* (1.01–1.35) | 1038 | 86.21 | 0.63* (0.41–0.97) |
| Most deprived | 10 942 | 1209 | 11.05 | 1.17 (1.01–1.36) | 1100 | 90.98 | 1.12 (0.67–1.87) |
| Disease group | |||||||
| CVa | 19 763 | 2080 | 10.52 | 1 | 1863 | 89.57 | 1 |
| MH | 7745 | 935 | 12.07 | 1.05 (0.89–1.25) | 786 | 84.06 | 0.65 (0.31–1.40) |
| CVD risk | 2088 | 391 | 18.73 | 1.10 (0.98–1.24) | 368 | 94.12 | 1.50 (0.56–4.02) |
| Practice size | |||||||
| <6000a | 10 960 | 1069 | 9.75 | 1 | 924 | 86.44 | 1 |
| 6000–10 000 | 6600 | 1086 | 16.45 | 1.64 (0.97–2.78) | 963 | 88.67 | 1.31 (0.30–5.67) |
| >10 000 | 12 036 | 1251 | 10.39 | 0.95 (0.97–2.78) | 1130 | 90.33 | 1.57 (0.30–5.67) |
| Total | 29 596 | 3406 | 11.51 | 3017 | 88.58 | ||
BI, brief intervention; N, number of screened patients; n, number, %, percentage screened positive and receiving BI; AOR, adjusted odds ratio; CI, 95% confidence interval; CV, cardiovascular group; MH, mental health group; CV risk, cardiovascular risk group.
aReference group.
bMissing (49).
*P < 0.05, **P < 0.001.
The youngest and oldest patients were less likely to receive BI (75.3% of those aged under 30 years and 88.6% of the over 70s versus 90.3% of those aged 50–69, P < 0.001). Men who screened positive were more likely to receive BI than women (90.3 versus 83.8%, P < 0.001), as were Black patients compared with White patients (82.9 versus 88.9%, P < 0.001).
Full AUDIT and dependent drinkers
Thirteen per cent of patients who received the full AUDIT scored 20+, suggesting they were dependent drinkers. Patients with mental health conditions were more likely to be dependent drinkers than those with cardiovascular conditions (10.3 versus 7.8%, P < 0.001). Only 19.3% of dependent drinkers had a record of having been referred to specialist alcohol services, but there was little variation in the chance of being referred (logistic regression results not shown).
Follow-up of Year 1 positive patients
In Year 1, 1915 patients screened positive for hazardous and harmful alcohol use. Overall, 53.5% (1024) of these patients were rescreened in Year 2, and 30.1% (CI 27–33%) (308) had by then reduced their alcohol consumption to safe levels. A large proportion of Year 1 positive patients had received a BI (88.0%, 1685) and of these 57.2% (963) were rescreened, of whom 28.7% appeared to have reduced their drinking as they rescreened negative. Of the 12.0% who did not receive a BI, only 26.5% (61) were rescreened, and of these 52.5% had a negative score. Outcomes for these patients are summarized in Fig. 2.
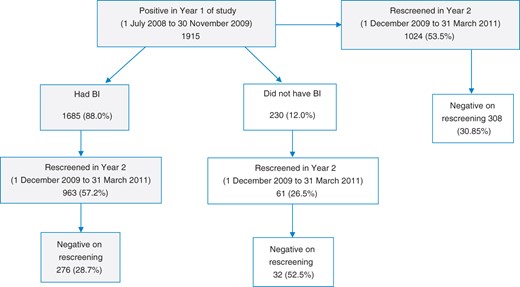
Flow diagram for follow up of Year 1 positive patients in Year 2.
There were few statistically significant differences between groups in the chance of Year 1 positive patients receiving a BI (Table 3), but most notably men were much more likely than women (89.7 versus 82.1%, P < 0.001) and Black patients were much less likely than White British patients (78.2 versus 88.5%, P < 0.001).
Patient and practice characteristics associated with Year 1 positive patients receiving a BI, being rescreened and subsequently screening negative
| Year 1 positives | Received BI | Rescreened in Year 2 | Negative on rescreening | |||||||
|---|---|---|---|---|---|---|---|---|---|---|
| N | n | % | AOR (CI) | n | % | AOR (CI) | n | % | AOR (CI) | |
| Gender | ||||||||||
| Femaleb | 424 | 348 | 82.08 | 1 | 207 | 59.48 | 1 | 69 | 33.33 | 1 |
| Male | 1491 | 1337 | 89.67 | 1.69** (1.22–2.36) | 756 | 56.54 | 0.87 (0.62–1.21) | 207 | 27.38 | 0.62* (0.43–0.88) |
| Age group | ||||||||||
| <30 | 50 | 38 | 76.00 | 1.67 (0.93–2.36) | 17 | 44.74 | 0.73 (0.26–2.10) | 1 | 5.88 | 0.11* (0.01–0.89) |
| 30–49 | 305 | 262 | 85.90 | 1.94 (1.00–3.75) | 132 | 50.38 | 0.77 (0.26–2.30) | 28 | 21.21 | 0.71* (0.51–0.98) |
| 50–69b | 1133 | 1013 | 89.41 | 1 | 574 | 56.66 | 1 | 154 | 26.83 | 1 |
| >70 | 427 | 372 | 87.12 | 1.35 (0.66–2.79) | 240 | 64.52 | 0.94 (0.37–2.39) | 93 | 38.75 | 1.85** (1.18–2.89) |
| Ethnicity | ||||||||||
| Whiteb | 1663 | 1471 | 88.45 | 1 | 837 | 56.90 | 1 | 230 | 27.48 | 1 |
| Black | 87 | 68 | 78.16 | 0.37** (0.27–0.52) | 44 | 64.71 | 1.90 (0.83–4.36) | 15 | 34.09 | 1.23 (0.45–3.33) |
| South Asian | 26 | 22 | 84.62 | 0.39 (0.16–0.92) | 14 | 63.64 | 1.50 (0.50–4.50) | 5 | 35.71 | 1.70 (0.37–7.73) |
| Mixed | 58 | 51 | 87.93 | 0.69 (0.24–1.92) | 34 | 66.67 | 2.10 (0.92–4.79) | 15 | 44.12 | 1.85 (0.83–4.14) |
| Other | 38 | 33 | 86.84 | 0.58 (0.17–1.91) | 16 | 48.48 | 0.97 (0.42–2.22) | 6 | 37.50 | 1.94* (1.03–3.67) |
| Not stated | 43 | 40 | 93.02 | 1.76 (0.50–6.19) | 18 | 45.00 | 0.60 (0.22–1.64) | 5 | 27.78 | 1.52 (0.33–7.10) |
| Deprivationa | ||||||||||
| Least deprivedb | 534 | 484 | 534 | 1 | 262 | 54.13 | 1 | 60 | 22.90 | 1 |
| Middle deprived | 649 | 546 | 84.13 | 0.52* (0.29–0.90) | 302 | 55.31 | 1.43 (0.78–2.63) | 87 | 28.81 | 1.02 (0.54–1.93) |
| Most deprived | 685 | 643 | 93.87 | 1.52 (0.60–3.84) | 392 | 60.96 | 2.33* (1.10–4.95) | 126 | 32.14 | 0.90 (0.44–1.85) |
| Disease group | ||||||||||
| CVb | 1346 | 1187 | 88.19 | 1 | 705 | 59.39 | 1 | 225 | 31.91 | 1 |
| MH | 275 | 220 | 80.00 | 0.54 (0.23–1.30) | 93 | 42.27 | 0.44** (0.29–0.67) | 13 | 13.98 | 0.45* (0.23–0.87) |
| CV risk | 294 | 278 | 94.56 | 1.73 (0.42–7.01) | 165 | 59.35 | 0.91 (0.59–1.40) | 38 | 23.03 | 0.69 (0.37–1.26) |
| Practice size | ||||||||||
| <6000b | 618 | 561 | 90.78 | 1 | 239 | 42.60 | 1 | 110 | 46.03 | 1 |
| 6000–10 000 | 650 | 552 | 84.92 | 0.59 (0.06–5.63) | 463 | 83.88 | 9.56 (1.21–75.35*) | 77 | 16.63 | 0.19* (0.04–0.75) |
| >10 000 | 647 | 572 | 88.41 | 0.84 (0.18–3.92) | 261 | 45.63 | 1.29 (0.26–6.50) | 89 | 31.10 | 0.67 (0.36–1.24) |
| Total | 1915 | 1685 | 87.99 | 963 | 57.15 | 276 | 28.66 | |||
N, number of screen-positive patients in Year 1; n, number, %, percentage, of patients who had BI; AOR, adjusted odds ratio; CI, 95% confidence interval; CV, cardiovascular group; MH, mental health group; CV risk, cardiovascular risk group.
aMissing (47 positives, 12 who received BI).
bReference group.
*P < 0.05,
**P < 0.001.
There was little variation in the chance of Year 1 positive patients being rescreened whether or not they had received a BI and so we have reported the results only for those who did receive a BI. Patients from the most deprived areas were more likely to be rescreened than those from the most affluent (60.0 versus 51.1%, P < 0.05). However, patients with mental health conditions were far less likely to be rescreened than those with cardiovascular diseases (42.3 versus 59.4%, P < 0.01) and less likely to rescreen negative (13.4 versus 32.0%, P < 0.05).
Discussion
Main findings of this study
We found that the introduction of a programme of planned ASBI and financial incentives was associated with a large, statistically significant increase in the proportion of patients with cardiovascular and mental health conditions being screened for problem alcohol use (from 4.8% prior to the introduction of QOF+ to 65.7% afterwards). There was also an increase in the proportion of patients not eligible for the incentive being screened (from 0.32 to 14.7%). Very few patients who had received AUDIT-C or FAST screening prior to the introduction of QOF+ had their score recorded or had a BI for alcohol recorded in their notes. After the introduction of QOF+, 11.5% of screened eligible patients were positive, a similar proportion to the ineligible patients, but 88.6% of eligible patients with a positive result received BI compared with 73.8% of ineligible patients.
Looking at variation in outcomes for the eligible patients, most groups benefited equally from BI, full AUDIT and rescreening. However, those with mental health conditions were less likely to be offered alcohol screening than those with cardiovascular conditions. We also found Black and Asian patients were more likely to receive alcohol screening than White patients, but that White patients were more likely to screen positive for alcohol misuse, and that patients from more deprived areas were more likely to receive ASBI.
Of all eligible patients who were rescreened, 30.1% were subsequently negative for hazardous and harmful drinking. The few patients who did not receive a BI appeared to be more likely to rescreen negative compared with those who did, which may suggest that screening alone has an effect on drinking patterns, but may also be due to incomplete coding of BI despite the financial incentive.
What is already known on this topic
Two previous studies25,26 have shown that financial incentives can increase rates of screening and/or BIs for excessive alcohol use. Lapham et al.25 undertook a retrospective study in the USA examining the prevalence of documented BI among Veterans Affairs outpatients with alcohol misuse before, during and after implementation of national evidence-based guidelines for BI linked with financial incentives to physicians, plus an electronic clinical reminder. The authors found an increase in recorded BI in the notes of patients who had previously screened positive with AUDIT-C from 5.5 to 29.0% (P < 0.001). The second study by Michaud et al.26 used a before–after cross-sectional design to examine the effect of a financial incentive to French general practitioners to provide ASBI. The authors found a statistically significant increase in the mean number of patients screened per practitioner (from 29 to 157, P < 0.001) and in the mean number of positive patients receiving BI (from 6 to 30, P < 0.001) following the introduction of the financial incentive.
Other authors have examined variation in uptake of alcohol services by different ethnic groups. For example, in their review of trends in alcohol treatment uptake across ethnic groups in the USA, Chartier and Caetano27 found that Asian, Black and Hispanic people with higher severity alcohol problems were less likely to use services compared with Whites. A UK-focused literature review found that problem drinkers from Black and other minority ethnic groups were disadvantaged compared with White drinkers in accessing services.28
What this study adds
We found that a specific financial incentive, together with training and a tailored computer template, substantially increased rates of recorded ASBI in primary care patients with cardiovascular or mental health conditions. However, screening rates for patients with mental health conditions were significantly lower than those with cardiovascular conditions, despite the fact that patients with mental health conditions are known to be at risk of alcohol-related harms.29 Even when this group of patients was screened they were less likely to be rescreened if positive, and more likely to remain misusing alcohol at rescreening than patients with other conditions. Improved identification of problem drinking by patients with mental health conditions, with referral to specialist services, may improve their long-term health outcomes. Further qualitative research will be helpful in examining the reasons for lower rates of ASBI in this group.
We also saw an increase in the proportion of patients without the conditions incentivized by QOF+ receiving ASBI following the introduction of the financial incentive, but the increase was smaller than for those conditions specifically targeted. This increase may represent a spill over effect of the incentive, or the effect of the alcohol DES introduced around the same time. As this was an observational study we cannot determine the cause of this increase.
Limitations
Our study's strengths include the use of data with high levels of ethnicity coding from a large sample of patients in an ethnically diverse area of north-west London. Patients who were missing ethnicity data were included in the group with ‘unstated ethnicity’ rather than excluded from the study, which might have introduced bias.30,31
Our findings may be generalizable to other health systems with universal coverage utilizing financial incentives for prevention work. However, due to the study design, we are not able to say that financial incentives alone were responsible for the huge increase in alcohol screening seen. We also found that around a third of Year 1 positive patients followed up in Year 2 had reduced their drinking to safe levels. Some of this effect could be explained by regression to the mean. However, additional analysis using ANCOVA to adjust changes in risk scores for baseline measures32 did not suggest this to be the case. Among this group it appeared that patients who received a BI were less likely to rescreen negative than those who did not. There may have been differences between the patients who did and did not receive a BI that we could not account for, or this may reflect incomplete BI coding in the EMR. We were unable to assess the quality of the brief advice given to screen-positive patients. We also did not examine the effect of the increased rates of ASBI in primary care on alcohol-attributable admissions to hospitals or mortality.
Despite limitations, this study should be of interest to policy-makers. We note that the proportion of patients screening positive for problem alcohol use was similar in the unicentivized group of patients as in those with conditions targeted by QOF+, suggesting that applying ASBI more widely in primary care could identify more people at risk of alcohol-related conditions. Randomized controlled trials of financial incentives for ASBI in primary care, together with economic evaluation, will be useful in determining the effect size and cost-effectiveness of financial incentives in delivering ASBI.
In conclusion, financial incentives may be effective in increasing rates of ASBI. This in turn can help reduce the health burden of alcohol use and costs associated with treating alcohol-related conditions. However, some groups still need to be better targeted, notably patients with mental health conditions.
Authors’ contributions
F.L.H. and C.M. planned the study; all authors contributed to drafting, revising and final approval of the manuscript and F.L.H., C.M. and A.M. are responsible for the overall content as guarantors of the study.
Funding
This article presents independent research commissioned by the National Institute for Health Research (NIHR) under the Collaborations for Leadership in Applied Health Research and Care (CLAHRC) programme for north-west London. The views expressed in this publication are those of the author(s) and not necessarily those of the NHS, the NIHR or the Department of Health.
Acknowledgements
We thank Dr Andrew Dalton for his help with models to assess regression to the mean among patients screened in both years, and Dr Dieke Luijben for her help with reviewing the background literature whilst on placement at the Department of Primary Care and Public Health (DPCPH), Imperial College London.
