


Abstract
East Asian aerosol has been regarded as an increasingly important nutrient source in the Northwest Pacific region due to intensifying human activities in the last decades. However, its effects on bacterial communities, an important component of the marine microbial food web and biogeochemical cycles, have been little studied. In our study, two types of aerosol enrichment microcosm experiments were conducted in the oligotrophic South China Sea by adding the aerosol initially or daily. Our results showed that the potential stimulus of bacteria by aerosol enrichment was likely masked by a more intense grazing pressure in these treatments. Distinct responses of various bacterial phylogenetic groups, including Actinobacteria, Cyanobacteria, Alphaproteobacteria and Gammaproteobacteria, were revealed by denaturing gradient gel electrophoresis analysis. High aerosol addition resulted in a decrease in autotrophic picocyanobacteria abundance, but no significant composition change was observed. Such responses of microbial abundance and composition could be directly triggered by the input of aerosol-derived organic or inorganic components and further shaped by the changes in the phytoplankton community structure or differentiated mortality loss caused by enhanced protist grazing, which may have implications for oceanic carbon dynamics under future scenarios of increasing atmospheric deposition.
INTRODUCTION
The South China Sea (SCS) is the largest semi-enclosed marginal sea in the Northwest Pacific. It is located downwind of the region with the fastest developing pace of industry and agriculture in the world and is surrounded by the most densely populated landmass. Many kinds of pollutants enter the SCS by way of either atmospheric deposition or riverine input. Every year, especially in winter when the Northeast Asian monsoon prevails, a large amount of atmospheric dust, which has been estimated to be as much as ∼67 Tg, is transported and deposited to the SCS, accounting for 14% of the total atmospheric dust deposition to the entire North Pacific (Gao et al., 1997). Besides the large quantity, the East Asian aerosol has a complex composition containing not only significant amounts of natural mineral dust from the Gobi desert, but also a substantial portion of anthropogenic pollutants with high concentrations of nitrogen (N), iron (Fe) and other trace metals, such as combustion-derived ionic, organic and soot particles (Duce et al., 1991; Uematsu et al., 2002; Cohen et al., 2004; Paytan et al., 2009). On the other hand, the deep basin of the SCS is known to be oligotrophic, which makes it very sensitive to external nutrient loadings (Gong et al., 1999; Wu et al., 2003; Chen et al., 2004). Thus, dust-derived inputs of limiting nutrients have been hypothesized to have a strong effect in this ecosystem (Wong et al., 2002; Wu et al., 2003; Lin et al., 2007).
Previous studies have demonstrated that atmospheric depositions have a great impact on autotrophic production by changing the phytoplankton community structure, inducing algal blooms and enhancing primary production (Paerl, 1997; Bonnet et al., 2005; Herut et al., 2005; Marañón et al., 2010; Guo et al., 2012). However, fewer studies have focused on bacterial community structure in response to dust deposition. As a fundamental component in the marine microbial food web, heterotrophic bacteria play important roles in the biogeochemical cycling of key elements and serve as crucial links between dissolved organic carbon, sinking particles and higher trophic levels. In oligotrophic ecosystems such as the SCS, bacterial growth has been demonstrated to be limited by inorganic nutrients (Yuan et al., 2011). Intense atmospheric deposition would relieve nutrient limitation, and thus affect bacterial abundance, composition and activity. Besides the heterotrophic bacteria, autotrophic picocyanobacteria are primary producers that contribute a large percentage of total primary production in the oligotrophic subtropical oceans (Campbell et al., 1994; Li, 1994; Liu et al., 1997), including the SCS (Liu et al., 2007). Both heterotrophic bacteria and autotrophic picocyanobacteria are consumed by protists (especially heterotrophic nanoflagellates, HNFs), which is recognized as a significant factor regulating bacterial mortality, standing stocks and community structure in aquatic ecosystems (Hahn and Höfle, 2001). Therefore, the balance between the bacterial growth and loss processes after the external nutrient input, which is poorly studied, is a key driver of the dynamics of bacterial composition.
A few recent studies have focused on the effect of Saharan dust, which contains high amounts of phosphorus (P) and Fe, on the Mediterranean and Atlantic ecosystems and showed that the dust could affect bacterial abundance, production and metabolism (Herut et al., 2005; Pulido-Villena et al., 2008; Reche et al., 2009; Hill et al., 2010; Lekunberri et al., 2010; Marañón et al., 2010; Laghdass et al., 2011). Molecular techniques, such as denaturing gradient gel electrophoresis (DGGE) and fluorescence in situ hybridization (FISH), were also used to investigate the effect of Saharan dust on bacterial community composition in the Mediterranean Sea and Atlantic Ocean (Reche et al., 2009; Lekunberri et al., 2010; Marañón et al., 2010; Laghdass et al., 2011). For example, Marañón et al. (Marañón et al., 2010) observed that Gammaproteobacteria and Roseobacter exhibited positive relative changes, while SAR11 showed negative relative changes in response to dust in the central Atlantic Ocean; Laghdass et al. (Laghdass et al., 2011) found that the contribution of Alteromonas macleodii to the active bacterial community increased by ∼2-fold in the NW Mediterranean Sea after dust addition; Reche et al. (Reche et al., 2009) showed no significant change in the diversity and composition of indigenous bacterial assemblages after dust addition though a stimulation effect on bacterial growth was observed. However, the dynamics of bacteria in the SCS in response to the East Asian aerosol has never been studied.
In 2010, we conducted on-board aerosol enrichment microcosm experiments to investigate the effect of the East Asian aerosol on plankton community composition in the SCS. Clear shifts in the phytoplankton community structure from picoplankton to diatoms have been observed. At the same time, enhanced grazing of protists as the cause of generally unchanged picoplankton abundance, as well as the shift in the bacterial composition as the result of grazing and phytoplankton composition change, has been suggested (Guo et al., 2012). As part of the efforts to address this speculation, we applied molecular techniques including DGGE fingerprinting and clone library to samples derived from the same microcosm experiments so as to investigate the changes in the phylogenetic composition of bacterial assemblages in response to East Asian aerosol enrichment. In addition, the abundances of bacteria and HNF were enumerated by flow cytometry in an attempt to evaluate the changes in bacterial standing stocks and their grazing pressure during the dust events.
MATERIALS AND METHODS
Aerosol sampling and microcosm set-up
Aerosol particles of PM2.5 were collected using a high-volume sampler setup on the roof top of the Academic Building (100 m above the sea level) at the Hong Kong University of Science and Technology (HKUST) facing Port Shelter, which is adjacent to the SCS. The sampling location is on the east side of Hong Kong with relatively low population and no commercial area within a distance of 5 km, thus it could be a good background station to study the East Asian aerosol. Our sampling was conducted on a sunny day in December 2009 with the northeast monsoon the prevailing wind. Particles were collected on 20.3 × 25.4 cm (8 × 10 in.) quartz filters (#2500 QAT-UP, Pall Life Science, Ann Arbor, MI, USA) at a constant flow rate of 1130 L min−1 for 24 h. Around 70 mg of PM2.5 aerosol was dissolved into 450 mL particle-free seawater for ∼1 h according to previous studies (e.g. Martin et al., 1991; Aguilar-Islas et al., 2010; Hsu et al., 2010), and then filtered through 0.22-µm polycarbonate filters to remove bacteria. Periodical shaking of the dissolving flask was performed to simulate the turbulent environment of the sea. The aerosol leachate was stored in the dark at 4°C. The weight of aerosol was estimated from in situ PM2.5 concentration data obtained from the Environmental Central Facility's Atmospheric & Environmental Database of HKUST (http://envf.ust.hk/dataview/gts/current/).
Two microcosm experiments were carried out in the SCS onboard the R/V Dongfanghong II during January 2010 to investigate the responses of the plankton community structure to atmospheric aerosol deposition. The two experiments were conducted at two stations located at different regions in the northern SCS: station C3a (114.28°E, 20.22°N) is a shelf station with a bottom depth of 137 m, while station S412 (119.11°E, 19.77°N) is located in the oceanic basin with a bottom depth of 3340 m (Fig. 1). Four-liter bottles were used in the experiments filled with the 200-µm pre-screened surface seawater to exclude mesozooplankton. At station C3a, the aerosol leachate was added to seawater on the first day, with control (no aerosol leachate addition), low (0.5 mL: ∼19.0 µg aerosol L−1) and high (5.0 mL: ∼189.7 µg aerosol L−1) aerosol leachate addition treatments to simulate the episodic atmospheric events. This experiment was based on the assumption of a low or high deposition event of ∼1–10 g m−2 into the surface ocean with a 50-m-deep mixing layer. At station S412, the aerosol leachate was added daily with 0.2 mL day−1 (∼7.6 µg aerosol L−1 day−1) and 2 mL day−1 (∼75.9 µg aerosol/L−1day−1) respectively, to oceanic waters as the low and high treatment to mimic continuous atmospheric deposition. The incubations were conducted in an on-deck incubator covered by two layers of neutral density screen to attenuate the sunlight intensity by ∼40% with temperature controlled by running seawater. The bottles were gently mixed twice a day. All experimental treatments were performed in triplicate. The incubation was conducted for 3 days at station C3a and 4 days at station S412. The incubation bottles and laboratory wares were soaked in 10% HCl, thoroughly washed with Milli-Q water and rinsed with experimental seawater prior to use.
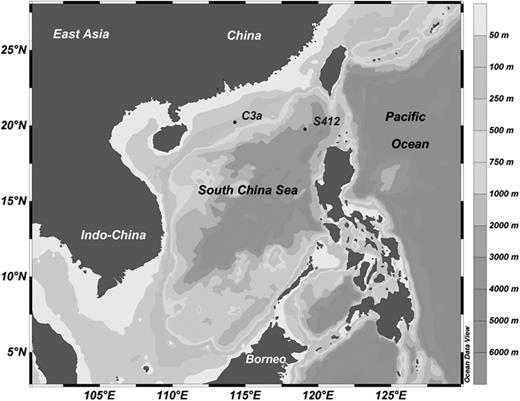
Locations of shelf station C3a and oceanic station S412.
The concentrations of inorganic nutrients in the aerosol leachate were determined colorimetrically using a Skalar autoanalyzer (San Plus) following JGOFS protocols (Knap et al., 1996). The trace metal elements in the aerosol leachate were detected by inductively coupled plasma mass spectrometer (ICPMS) analysis. The details of the measurements for chemical composition of aerosol leachate and hydrographic parameters (listed in Table I) are described in Guo et al. (Guo et al., 2012).
Concentrations of macro-nutrients and trace metal elements in the aerosol leachate, and estimated enrichment in the high and low treatments of Experiment 1
| Macro-nutrient | Trace metal elements | ||||||||||||||
|---|---|---|---|---|---|---|---|---|---|---|---|---|---|---|---|
| SiO3 | NH4 | NO3+ NO2 | PO4 | Cd | Pb | Al | V | Cr | Mn | Fe | Co | Ni | Cu | Zn | |
| Aerosol leachate (μM) | 630.9 | 1639.8 | 237.9 | 7.980 | 0.091 | 1.470 | 7.620 | 0.530 | 0.076 | 1.229 | 2.960 | 0.009 | 0.194 | 3.378 | 16.182 |
| High treatment in Experiment 1 (nM) | 788.6 | 2049.7 | 297.3 | 9.975 | 0.114 | 1.838 | 9.525 | 0.662 | 0.095 | 1.537 | 3.700 | 0.011 | 0.243 | 4.223 | 20.227 |
| Low treatment in Experiment 1 (nM) | 78.9 | 205.0 | 29.7 | 0.998 | 0.011 | 0.184 | 0.952 | 0.066 | 0.009 | 0.154 | 0.370 | 0.001 | 0.024 | 0.422 | 2.023 |
Bacterial and HNF abundance
Samples for bacterioplankton and the HNF abundance measurement were taken every day during the incubation. Seawater (1.8 mL) was fixed with 0.5% seawater buffered paraformaldehyde and stored at −80°C before analysis. The abundance of photosynthetic picocyanobacteria (Prochlorococcus and Synechococcus), heterotrophic bacteria and HNFs was determined using a Becton-Dickinson FACSCalibur Flow Cytometer. The samples for autotrophic cyanobacteria and HNF were run at a high flow rate (∼60 μL min−1) for 3 and 10 min, respectively, and the samples for total prokaryotes were run at a low flow rate (∼12 μL min−1) for 1 min. Yellowish green fluorescence beads (1 µm) were added as an internal standard to calibrate and normalize the fluorescence emissions and light scattering signals. Flow cytometric data were analyzed using WinMDI software 2.9 (Joseph Trotter, Scripps Research Institute, La Jolla, CA, USA). Different populations of photosynthetic cyanobacteria were discriminated according to the side scattering and their auto-fluorescence (Olson et al., 1993). Total prokaryotes were quantified after staining with 0.01% SYBR Green I (Molecular Probes) and incubating in the dark at 37°C for 60 min. The abundances of heterotrophic bacteria were calculated by subtracting the abundances of photosynthetic picocyanobacteria from those of total prokaryotes.
The method for HNF enumeration followed Zubkov et al. (Zubkov et al., 2007). Nanoplankton was zoned first in the dot plot of green fluorescence versus side scatter, and then gated on a separate dot plot of green versus red fluorescence to distinguish HNF from phototrophic nanoplankton by the difference in red fluorescence signals (Supplementary data, Fig. S1a–c). As flow cytometric enumeration is not an established routine method for HNF abundance measurement, we measured the HNF abundance by both this method and the traditional microscopic counting method for 16 samples from a separate study conducted on the same cruise (Ng, W. et al., unpublished data) to make a comparison. For microscopic counting, 20-mL samples fixed by seawater-buffered 1% paraformaldehyde were stained with 4′,6-diamidino-2-phenylindole and gently filtered on 1-μm polycarbonate plain membrane filters. Slides were counted with an epifluorescence microscope at a magnification of 1000 × under UV excitation. Autotrophic and heterotrophic flagellates were distinguished on the basis of the presence and absence of red fluorescence (chloroplast) under blue light excitation.
A good linear relationship was obtained between the HNF counts using flow cytometric enumeration and microscopic counting (Supplementary data, Fig. S1d), which confirms the reliability of the HNF abundance data.
Genomic DNA extraction
Between 1 and 4 L of seawater were filtered on-board for DNA sample collection, first through a 3-μm and then a 0.22-μm filter (47 mm, Millipore) at the initial and final time point of the two experiments. Total genomic DNA was recovered from biomass on the 0.22-µm filters by phenol:chloroform extraction after lysozyme lysis in the sucrose lysis buffer (Kong et al., 2011). Extracted DNA were precipitated with isopropanol and stored at −80°C until further analysis.
DGGE electrophoresis and sequence analysis
Extracted DNA was amplified with primer sets specific to the bacterial 16S rRNA gene: 341F (5′-CCTACGGGAGGCAGCAG-3′) and 926R (5′-CCGTCAATTCMTTTRAGTTT-3′) (Muyzer et al., 1996). To obtain the GC-PCR products for analysis with DGGE, the 5′ end of 341F had a (GC)40 clamp (5′-CGCCCGCCGCGCCCCGCGCCCGTCCCGCCGCCCCCGCCCG-3′). The PCR reaction was carried out with a 50-μL master mix including 5 μL of 10× Buffer, 2 μL of MgCl2 (25 mM), 4 μL of dNTPs (2.5 mM), 1 U of Taq polymerase (Invitrogen, Carlsbad, CA) and 1 μL of each primer (10 μM) with the following program: 94°C for 3 min; 30 cycles of 94°C for 1 min, 56°C for 50 s, 72°C for 1 min; final extension at 72°C for 10 min. PCR products were stained with ethidium bromide and visualized on a 1% agarose gel. GC-PCR products were loaded onto a 7% polyacrylamide DGGE gel, containing a linear denaturant gradient of 30–85%. Electrophoresis was conducted using the Bio-Rad DGGE system (Bio-Rad, USA) in 1× TAE buffer (pH 8) at 60°C and 100 V for 15 h. After completion, the gels were stained with SYBR green (10 000 × dilution) and photographed by Fluor-S MultiImager (Bio-Rad). Selected DGGE bands were excised and soaked overnight in the TE buffer (pH 8) at 4°C before being re-amplified with the same primer set but without GC clamp. The amplicons were purified with the PureLinkTM Quick Gel Extraction Kit (Invitrogen) prior to automatic sequencing with the BigDye Terminator Cycle Sequencing kit v3.1 (Applied Biosystems).
All sequences obtained from excised bands were submitted to the online RDP-II CHECK_CHIMERA program to check the sequence integrity and chimeras. For each non-chimera sequence, the primer sequences were excluded and the NCBI GenBank BLAST program (www.ncbi.nlm.nih.gov) was used to determine their approximate phylogenetic affiliations.
Cloning analysis of Synechococcus and Prochlorococcus community compositions
The 1.5-kb DNA fragments of the internal transcribed spacer (ITS) region between picocyanobacterial 16S and 23S rRNA genes were amplified using the primers of 16S-1247F (Rocap et al., 2003) and 23S-495R and following the PCR conditions described by Jing and Liu (Jing and Liu, 2012). Positive PCR amplification was confirmed by electrophoresis on a 1.5% agarose gel. The amplicons from the triplicate samples of each treatment were combined to reduce experimental bias and then purified using the PureLinkTM Quick Gel Extraction Kit (Invitrogen). The purified amplicons were ligated into the cloning vector PCR4.0, by means of the TOPO TA cloning kit (Invitrogen). From each clone library, around 50 white clones were randomly selected and amplified with the original PCR primer set. Positive amplicons were digested by three restriction enzymes, EcoRI, HaeIII and HindIII, at 37°C for 3 h. The digestion products were separated on a 3% agarose gel. The restriction fragment length polymorphism (RFLP) patterns were recorded under UV radiation using a Universal Hood digital imaging system (Bio-Rad).
Clones showing the same RFLP-banding pattern were grouped into one RFLP group, and representative clones randomly chosen from each RFLP group were sequenced on a 3730 × L DNA Analyzer (Applied Biosystems). Operational taxonomic units (OTUs) were identified at a cut-off value of 98% sequence similarity generated by DOTUR (Schloss and Handelsman, 2005). With the representative sequences of each OTU and the top-hit sequences from the GenBank from a BLASTn search, neighbor-joining trees for Synechococcus and Prochlorococcus were constructed, respectively, using MEGA 4.0 (Tamura et al., 2007) with a bootstrap value of 1000 replicates.
Statistical analysis
DGGE profiles of all samples were analyzed with the GelCompar II software (Applied Maths) after being normalized by the programme and adjusted manually. Gel images were converted to densitometric profiles and species richness (S, numbers of bands) and their relative abundances (band intensity) were determined. The Shannon diversity index of each sample according to the equation of  , where ni is the height of a peak and N is the sum of all the peaks. Clustering analysis of DGGE profiles for all samples were computed based on the presence/absence of banding patterns by the unweighted pair group method with an arithmetic mean (UPGMA). Independent samples t-test and Spearman correlation analysis were conducted using SPSS.
Nucleotide sequence accession numbers
All the sequences obtained from this study were submitted and deposited in GenBank under accession numbers of JN675188–JN675219 for 16S rRNA gene sequences and JQ837725–JQ837792 for ITS sequences.
RESULTS
Aerosol leachate composition and the initial environmental conditions
The elements and compounds released from the East Asian aerosol samples are shown in Table I. There was a significant amount of seawater leachable N as well as various trace metal elements, especially Pb, Zn, Cu and Fe, in the aerosol leachate. The leachable N/P ratio was ∼235, almost 15 times higher than the Redfield ratio.
The seawater at both stations was oligotrophic as indicated by low macronutrient and Chl a concentrations (Table II). The initial phosphate concentrations were below the detection limit (0.08 µmol L−1) at both stations. The concentration of inorganic nitrate and nitrite at shelf station C3a (∼0.6 µmol L−1) was higher than that at oceanic station S412 (below the detection limit). Low Chl a concentrations (<0.5 µg L−1) were observed at both stations, with Chl a from the <20-µm phytoplankton accounting for 87 and 92% of the total Chl a at stations C3a and S412, respectively.
Initial biotic and abiotic parameters detected for the bioassay experiments
| Station | Bottom depth (m) | SST (°C) | Salinity | NO2−+ NO3− (µmol L−1) | PO43− (µmol L−1) | SiO32− (µmol L−1) | Chl a >20 µm (µg L−1) | Chl a <20 µm (µg L−1) | Chl a total (µg L−1) | Pro (×103cells mL−1) | Syn (×103cells mL−1) | HB (×106cells mL−1) | HNA HB/total HB (%) | HNF (cells mL−1) |
|---|---|---|---|---|---|---|---|---|---|---|---|---|---|---|
| C3a | 137 | 22.82 | 34.06 | 0.609 | <0.080 | 1.5 | 0.041 (0.003) | 0.268 (0.003) | 0.309 (0.001) | 40.73 (0.27) | 46.98 (0.80) | 1.02 (0.003) | 42.80 | 537 (23) |
| S412 | 3340 | 24.27 | 33.8 | <0.100 | <0.080 | 1.75 | 0.035 (0.001) | 0.427 (0.020) | 0.462 (0.022) | 23.58 (1.952) | 49.75 (1.70) | 1.52 (0.061) | 54.60 | 336 (39) |
Numbers in parenthesis represent standard deviation. ST, sea surface temperature; Chl, chlorophyll; Pro, Prochlorococcus; Syn, Synechococcus; HB, heterotrophic bacteria; HNA HB, heterotrophic bacteria with high nucleic acid content; HNF, heterotrophic nanoflagellate.
Response of bacterial and HNF abundance
Flow cytometry enabled the discrimination of four bacterial cell groups: bacterial cells with high nucleic acid (HNA) and low nucleic acid (LNA) contents, Prochlorococcus and Synechococcus. Different responses of the four groups in terms of abundance were observed during the experiments (Figs 2 and 3).
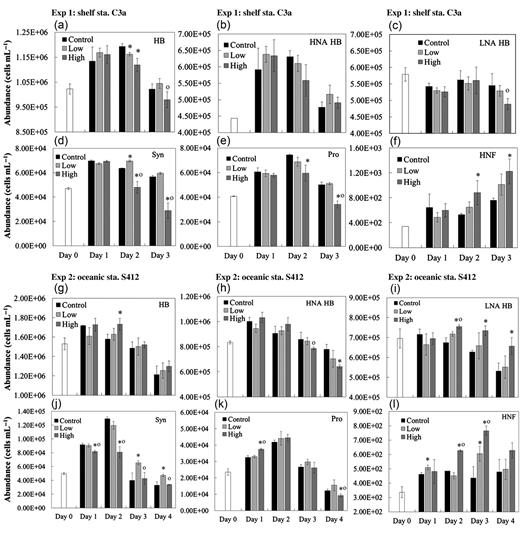
Daily change in abundances of (a and g) heterotrophic bacteria (HB), (b and h) high nucleic acid HB (HNA HB), (c and i) low nucleic acid HB (LNA HB), (d and j) Synechococcus (Syn), (e and k) Prochlorococcus (Pro) and (f and l) HNFs in control, low and high treatments at stations C3a and S412. Error bars represent the standard deviation of the measurements in the control and treatments. Asterisks and circles indicate statistically significant differences (P < 0.05) compared with control and low treatment, respectively.
The initial abundance of heterotrophic bacteria was higher at oceanic station S412 (1.52 × 10⁶ cells mL−1) than that at shelf station C3a (1.02 × 10⁶ cells mL−1) (Table II). The HNA bacteria accounted for about a half of the total heterotrophic bacterial abundance and the proportion was higher at oceanic station S412 (Table II). At shelf station C3a, the heterotrophic bacterial abundance increased in all incubation bottles during Day 1, changed little during Day 2 and declined sharply during Day 3 (Fig. 2a). Similar results were observed at oceanic station S412, and heterotrophic bacterial abundances were much lower by the end of the experiment than at the beginning (Fig. 2g). Nevertheless, there was no apparent difference in the heterotrophic bacterial abundance between the control and aerosol treatments at both sites (Fig. 3). Similar patterns of increase and then decrease in the abundance throughout the incubation period were observed for HNA bacteria (Fig. 2b and h), while the abundance of the LNA showed much less variation during the experiments (Fig. 2c and i). Compared with the controls, the abundance of HNA bacteria decreased in both low (−9.8%) and high (−17.8%) treatments at oceanic station S412, but were largely unchanged with insignificant increase at the end of the experiment at shelf station C3a (Fig. 3). Responses of LNA bacterial abundance were somewhat opposite to that of HNA bacteria; they decreased (with relative changes in −3.0 and −10.3% in low and high treatments, respectively) at shelf station C3a, but increased (with relative changes of 3.7 and 23.5% in low and high treatments, respectively) at oceanic station S412 (Fig. 3). The HNA/LNA ratio did not change much at shelf station C3a but decreased from 1.29 to 0.98 at oceanic station S412 in the high treatment at the end of the experiment.
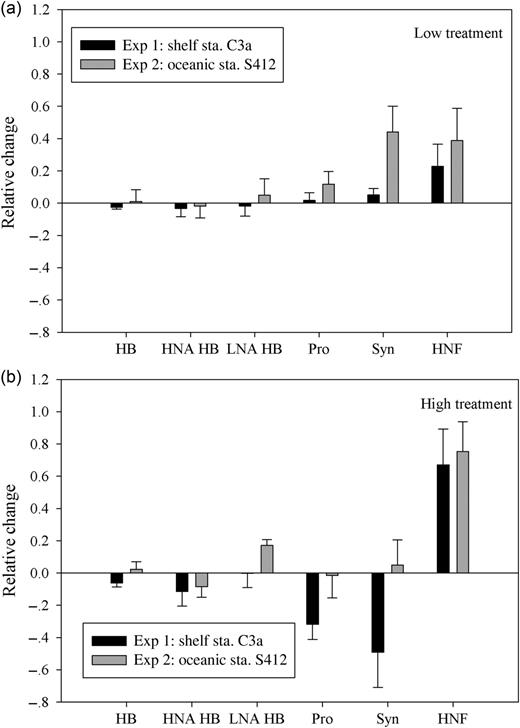
Relative changes in heterotrophic bacteria (HB), high nucleic acid HB (HNA HB), low nucleic acid HB (LNA HB), Prochlorococcus (Pro), Synechococcus (Syn) and HNFs abundances in the Low (a) and High (b) treatment at stations C3a and S412 at the end of the experiments. Relative changes were calculated as (A–C)/C (A and C are the mean values of the variable in the aerosol and control treatments, respectively). Error bars represent the propagation of the standard deviation of the measurements in the control and treatments.
For autotrophic picocyanobacteria, the initial abundances of Synechococcus were 4.6 × 10⁴ and 5.0 × 10⁴ cells mL−1 at shelf and oceanic stations, respectively, while Prochlorococcus were slightly less abundant, with 4.1 × 10⁴ cells mL−1 at shelf station and 2.4 × 10⁴cells mL−1 at the oceanic station. An increase and then decrease in the abundance throughout the experimental period also occurred for both populations at both sites (Fig. 2d, e and j, k). By adding a low dose of aerosol, the abundances of both Prochlorococcus and Synechococcus increased at the two stations, and the increase was more apparent at oceanic station S412 than shelf station C3a (Fig. 3). In the high aerosol input treatment, however, a sharp decline of up to 50% in Prochlorococcus (at both stations) and Synechococcus (at the shelf station C3a only) were observed when compared with controls (Fig. 3).
The abundance of HNF increased over the period of the experiments, particularly in aerosol-amended treatments (Fig. 2f and l). The relative change in the HNF abundance reached 31.6–61.7% in the high treatment and 3.9–33.7% in the low treatment at the end of the two experiments (Fig. 3). Furthermore, a significant negative correlation was obtained between bacterial and HNF abundances on each day during incubation at station C3a (Spearman correlation r = −0.635, n = 29, P < 0.001).
Response of bacterial community composition
A substantial change in bacterial assemblages was observed. At shelf station C3a, the DGGE analysis of samples in the control and treatments revealed between 11 and 23 bands in each sample and consistent banding patterns among replicates in the control, low and high treatments were observed (Fig. 4a). Cluster analysis demonstrated that high amounts of aerosol addition and an increased HNF grazing pressure induced substantial change in bacterial assemblages compared with the control and low treatment, whereas the low treatment and control shared relatively higher similarity (∼73%) of the DGGE-banding pattern (Fig. 4b). Both species richness (S) and diversity (H′) decreased significantly after aerosol addition compared with the control (t-test; S: high, P < 0.01; H′: low, P < 0.01; high, P < 0.01), and the decrease was more pronounced in the high treatment (Fig. 4a). In the initial waters, the bacterial community was mainly composed of Actinobacteria, Alteromonas (Gammaproteobacteria) and Synechococcus (Figs 3 and 4, Table III). The composition shifted to the predominance of Alteromonas (Gammaproteobacteria) and Roseobacter (Alphaproteobacteria) at the end of the incubation (Fig. 5). Compared with the control, the intensity of most bands decreased in the aerosol treatments, such as B1-1, -2, -3, -4, -5, -7, -10 (Alteromonas) and B1-8 (Roseobacter), (Fig. 4a). The decreases in Alteromonas bands were more pronounced in the high treatments than in the low ones (Table III; Fig. 4a). As a result, the proportion of Alteromonas decreased significantly in the high treatment (42.8%) compared with the control (71.5%) and low treatment (70.9%), while Roseobacter and Actinobacteria accounted for larger percentages in the high treatment (13.8 and 31.6%) compared with the control (7.9 and 15.5%) and low treatment (5.0 and 16.1%) (Fig. 5a). B1-11 and -14 (Synechococcus) were the only bands becoming slightly brighter in the low treatment corresponding to the increase of their abundance in the low treatments measured by flow cytometry (Table III; Fig. 4a).
Variation and phylogenetic affiliation of DGGE bands that dominated the bacterial community or showed obvious changes at station
| DGGE band | Initial | Day 3 | Accession no. | Closest relative | Similarity (%) | Taxonomic description | |||
|---|---|---|---|---|---|---|---|---|---|
| Control | Low | High | |||||||
| C3a | |||||||||
| 1–1 | × | √ | → | ↓ | HQ161434 | Uncultured Alteromonas sp. clone H02C48-32 | 99 | Gammaproteobacteria | Alteromonas |
| 1–2 | × | √ | → | ↓ | HQ188622 | Alteromonas sp. N58(2010) | 99 | Gammaproteobacteria | Alteromonas |
| 1–3 | × | √ | ↓ | × | HM584088 | Alteromonas macleodii strain CAIM 1335 | 96 | Gammaproteobacteria | Alteromonas macleodii |
| 1–4 | × | √ | ↓ | ↓ | DQ659068 | Alteromonas sp. LZXC22 | 99 | Gammaproteobacteria | Alteromonas |
| 1–5, 7, 9 | × | √ | ↓ | ↓ | HQ161408 | Uncultured Alteromonas sp. clone H02P24-52 | 99 | Gammaproteobacteria | Alteromonas |
| 1–6 | ↓ | √ | → | → | FJ951118 | Uncultured marine bacterium isolate DGGE gel band 16S-13 | 96 | Uncultured bacterium | |
| 1–8 | × | √ | ↓ | ↓ | DQ659059 | Roseobacter sp. LZXC12 | 98 | Alphaproteobacteria | Roseobacter |
| 1–10 | × | √ | ↓ | ↓ | DQ659068 | Alteromonas sp. LZXC22 | 99 | Gammaproteobacteria | Alteromonas |
| 1–11 | ↑ | √ | ↑ | → | AM750042 | Uncultured Synechococcus sp. | 92 | Cyanobacteria | Synechococcus |
| 1–12 | → | √ | → | → | HQ161389 | Uncultured Alteromonas sp. clone H02P24-33 | 99 | Gammaproteobacteria | Alteromonas sp. |
| 1–13 | → | √ | → | → | GQ342218 | Uncultured bacterium isolate DGGE gel band 0.22–31 | 95 | Uncultured bacterium | |
| 1–14 | → | √ | ↑ | ↓ | FJ903280 | Uncultured Synechococcus sp. clone 031806#45 | 99 | Cyanobacteria | Uncultured Synechococcus sp. |
| S412 | |||||||||
| 2–1 | → | √ | ↓ | ↓ | GU206795 | Uncultured bacterium isolate DGGE gel band GH2 | 91 | Uncultured bacterium | |
| 2–2 | → | √ | ↓ | → | FJ951118 | Uncultured marine bacterium isolate DGGE gel band 16S-13 | 94 | Uncultured bacterium | |
| 2–3 | × | √ | ↑ | ↑ | AM747331 | Uncultured marine bacterium | 95 | Alphaproteobacteria | Roseobacter |
| 2–4 | × | √ | ↑ | ↑ | AB302363 | Alpha proteobacterium C26 | 99 | Alphaproteobacteria | |
| 2–5 | × | √ | ↑ | ↑ | HQ425683 | Sulfitobacter pontiacus strain 37-PW11-OH7 | 99 | Alphaproteobacteria | Sulfitobacter pontiacus |
| 2–6 | × | × | ↑ | ↑ | FJ161311 | Thalassobius mediterraneus strain D6064 | 92 | Alphaproteobacteria | Thalassobius mediterraneus |
| 2–7 | × | × | ↑ | ↑ | HM732352 | Uncultured bacterium clone GB7N87003G7UZU | 88 | Uncultured bacterium | |
| 2–8 | → | √ | → | ↓ | EU361321 | Uncultured Synechococcus sp. clone HF70_08O24 | 99 | Cyanobacteria | Synechococcus |
| 2–9 | ↓ | √ | → | ↓ | FJ903280 | Uncultured Synechococcus sp. clone 031806#45 | 99 | Cyanobacteria | Uncultured Synechococcus sp. |
| 2–10 | ↓ | √ | → | ↓ | GQ342212 | Uncultured bacterium isolate DGGE gel band 0.22–17 | 90 | Uncultured bacterium | |
| 2–11 | → | √ | → | → | FJ903280 | Uncultured Synechococcus sp. clone 031806#45 | 99 | Cyanobacteria | Uncultured Synechococcus sp. |
×, band not detectable; √, band detectable; ↑, band intensity increased compared with the control; ↓, band intensity decreased compared with the control; →, band intensity kept no change compared with the control.
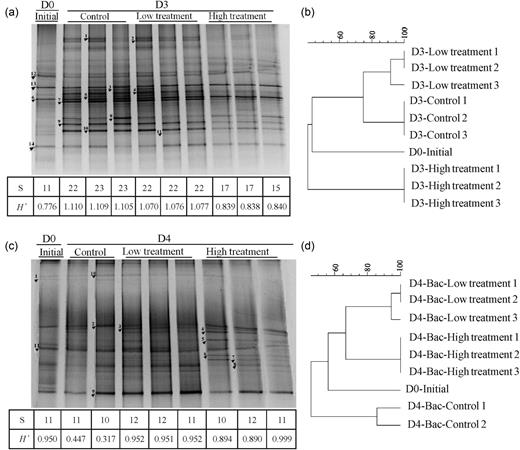
DGGE profile and dendrogram classification of heterotrophic bacteria 16S rRNA gene fragments from samples of control, low and high treatment at C3a (a and b) and S412 (c and d). D0, initial; D3 (4), Day 3 (4).
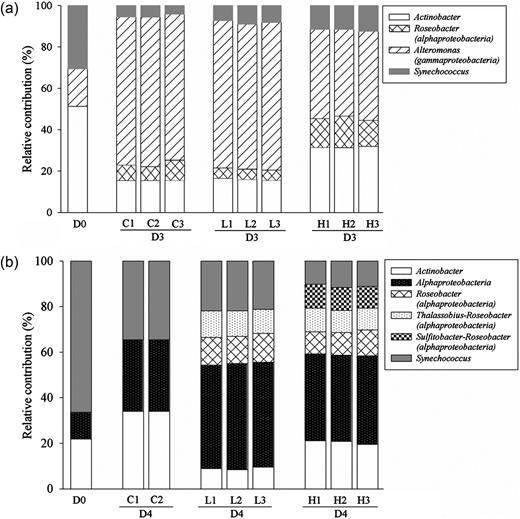
Proportional changes in the different microbial components in both low and high treatments at stations C3a (a) and S412 (b). D0, initial; D3 (4), Day 3 (4); C, control; L, low treatment; H, high treatment.
At oceanic station S412, the band patterns as well as the trend of change were very different from those at shelf station C3a. The DGGE analysis revealed 10–12 bands in different lanes. Communities in the low and high treatments clustered together, and were distant from the control and initial communities (Fig. 4d). Species diversity increased significantly after the aerosol addition at station S412 compared with the control (t-test; Low- P < 0.01; High- P < 0.01). Sequencing of the DGGE bands showed that three phylotypic groups, Synechococcus, Alphaproteobacteria and Actinobacteria constituted the bacterial communities in the initial and control bottles on Day 4 (Fig. 5b). With the aerosol addition, some species affiliated to Roseobacter (Alphaproteobacteria) but not being found in the initial and control bottles such as Sulfitobacter (B4-5) and Thalassobius mediterraneus (B4-6) prevailed and accounted for a significant proportion in the whole community (Fig. 5b). However, the intensity of the bands that identified as Synechococcus exhibited either a decrease (B4-8, B4-9) or no change (B4-11) in the high treatment and did not show noticeable change in the low treatment (Fig 3c).
Response of picocyanobacterial composition
To investigate the aerosol effect on the picocyanobacterial composition, a total of 414 clones from 8 clone libraries including 1 initial and 3 final treatment samples for each dust addition experiment were screened, from which 67 distinct RFLP patterns were identified. The 67 sequences were further grouped into 56 OTUs based on the cut-off value of 98% sequence similarity and they were all phylogenetically affiliated within Synechococcus and Prochlorococcus. The recovered Prochlorococcus sequences (15 OTUs) were 91.2 and 99.5% similar to one other and they were clustered into the high-light clade II (HL II) except one unique sequence affiliated to the clade HL I that was found in D0 at station S412 (Fig. 6). The Synechococcus sequences obtained, however, were more diverse and the similarities shared among sequences were between 73.2 and 99.9%. The 39 identified OTUs were mainly distributed into 8 known Synechococcus clades, including clades II, XV, IV, III, VII, IX, X in subcluster 5.1 and 1 clade in subcluster 5.2 (Fig. 7). Three sequences in two OTUs (C3a-D0-45 and C3a-L54) were distinct from any existing reference sequences in the database (Fig. 7) and they are indicated as unknown in Fig. 8.
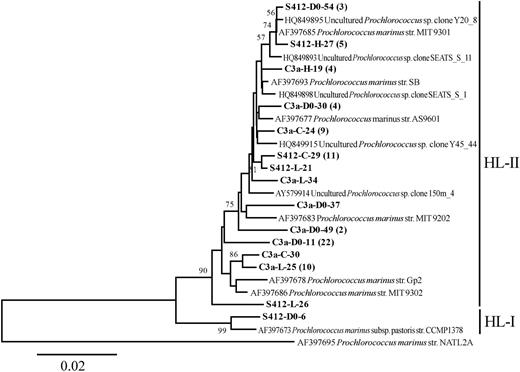
Neighbor-joining phylogenetic tree constructed with Prochlorococcus ITS sequences (ca. 800 positions) from Genbank and this study. The sequences in bold were obtained in this study; their names—using S412-D0-54 (3) as an example—are constructed as follows: name of the station (C3a or S412), treatment (D0 for initial; C for Control; L for low; H for high), clone number (e.g. 54) and the number of clones recovered in this OTU (e.g. 3). Bootstrap resampling was performed 1000 times, and the values >50% are shown. Prochlorococcus marinus str. NATL2A (AF397695) was used as the outgroup.
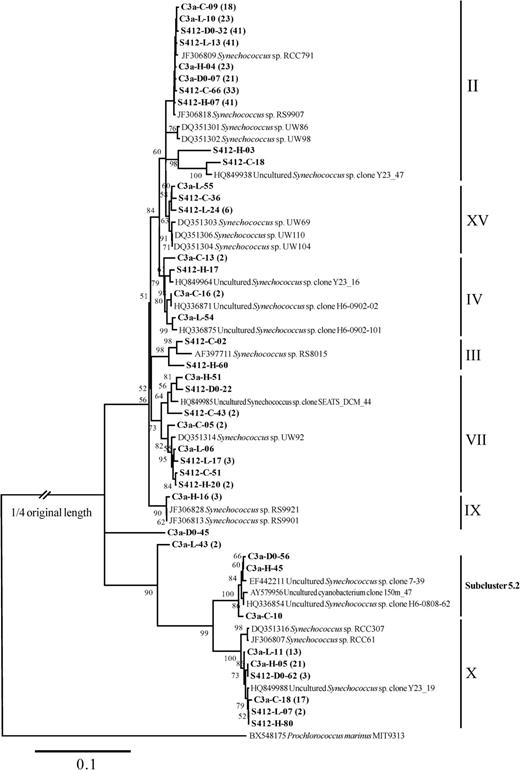
Neighbor-joining phylogenetic tree constructed with Synechococcus ITS sequences (ca. 800 positions) from Genbank and this study. The sequences in bold were obtained in this study; the same naming system of Figure 6 is applied. Bootstrap resampling was performed 1000 times, and the values >50% are shown. Prochlorococcus marinus MIT9313 (BX548175) was used as the outgroup.
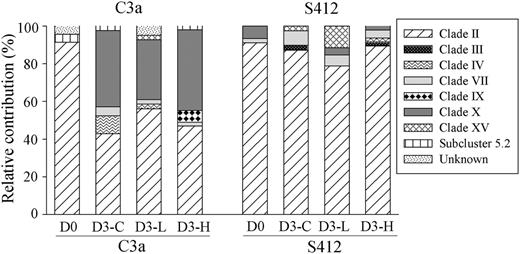
Proportional changes in the different phylogenetic groups of Synechococcus in initial (D0), control (C), low (L) and high (H) treatments at each station. D3 (D4) represents Day 3 (Day 4) as the end point of the incubation in the experiments.
Among the diverse Synechococcus communities, clade II was the dominant group, presenting in all samples and accounting for 42.8–91.3% of total sequences (Fig. 8). Clade X was detected in six out of the eight samples, and made up the second largest component in the three samples at station C3a at the end of the incubation (Fig. 8). Other Synechococcus clades, such as clade IV and VII accounted for a relatively smaller proportion of less than 10% in different treatments. In addition, some unique Synechococcus clades were only detected at one station, such that the clade IX and subcluster 5.2 was only observed at station C3a and clade III was only observed at station S412.
DISCUSSION
The relative chemical composition of the soluble nutrients and trace metal elements in our study is consistent with the chemical composition of the aerosols over the SCS and other East Asian aerosols reported in previous studies, which are characterized by relatively higher concentrations of nitrate and ammonium than phosphate, and relatively higher concentrations of Al, Fe, Pb, Cu, Mn, Zn than other trace metals (Cohen et al., 2004; Zhang et al., 2007). The low nutrients and Chl a concentrations at our study sites, especially at oceanic station S412, indicate the nutrient-depleted condition in this region. Nutrient limitation of phytoplankton growth was significantly relieved by aerosol addition indicated by the dramatic increase in the Chl a concentration (up to 454%) (Guo et al., 2012). However, compared with the autotrophic phytoplankton, the net change in the heterotrophic bacterial community in response to aerosol input and HNF grazing appeared less noticeable (relative changes of −4.2 to 6.9%) after aerosol addition. Although the standing stocks of microbes are less responsive, previous studies reported strong response of bacterial production and metabolic rates to dust addition (Herut et al., 2005; Lekunberri et al., 2010; Marañón et al., 2010). The disproportionate stimulation of bacterial abundance and production led to the inference that protist grazers might crop the stimulated growth and exert strong trophic control on bacteria (Zubkov et al., 2000; Calbet and Landry, 2004). Protist grazing has been well established as a significant and even dominant source of mortality for bacteria, phytoplankton and other protists in aquatic microbial food webs (Sherr and Sherr, 2002). Protist grazers can respond to nutrient enrichment quickly by increasing their ingestion of prey with improved nutritional condition due to the relief of nutrient limitation (Landry et al., 2000; Worden and Binder, 2003). In our study, the pronounced increase in HNF abundances in the aerosol treatments compared with controls (Fig. 3) and the significant negative correlation between bacteria and HNF abundance at shelf station C3a indicated that protist grazing could be an important force that prevented the accumulation of bacteria standing stocks after aerosol addition. As the incubation proceeded, all bacterial populations (except for LNA bacteria) exhibited a decreasing trend, while HNF abundance showed an increasing trend, suggesting that grazing pressure increased in both control and aerosol treatments and exerted important controls on bacterial abundance. The increase in HNF abundance during incubation may be a result of the elimination of larger grazers that feed on HNF because of the relatively small experimental volume. Besides, the controlling effect of protist grazing at oceanic station S412 seemed not to be as strong as that of shelf station C3a, as indicated by the less-abundant HNF and a positive though not significant correlation between HNF and bacterial abundances. Previous study has shown that the grazing rate is lower in oceanic areas than in coastal zones of SCS (Chen et al., 2009). The decreasing trend of heterotrophic bacterial and cyanobacterial abundance with the duration of incubation may also be because of the increased abundance of HNF after removing large zooplankton.
Furthermore, protistan grazing may also result in changes in the bacterial taxonomy through the complex interplay of grazing selectivity (by size, physiology and other characteristics of the prey), differences in vulnerability of bacterial species to grazing, as well as the direct and indirect influence of grazing on bacterial growth conditions (substrate supply) and bacterial competition (Hahn and Höfle, 2001). It has been reported that the HNA bacteria were metabolically more active and thus have significantly higher growth rate and grazing mortality than LNA bacteria (Gasol and del Giorgio, 2000; Scharek and Latasa, 2001). The preference for HNA bacteria by protist grazers (Gasol et al., 1995) may explain the relative decrease in HNA bacteria in aerosol-amended treatments, especially at the oceanic station (Figs 2 and 3). Furthermore, our observation of the active growth of LNA bacteria appears to be contrary to the view that LNA bacteria are metabolically inactive or dead cells (Gasol et al., 1995; Zweifel and Hagström, 1995; Lebaron et al., 2002), but rather consistent with a few previous studies that suggested that the LNA bacteria can be an active part of the microbial food web and more responsive to exudates from phytoplankton (Zubkov et al., 2001; Jochem et al., 2004; Longnecker et al., 2005; Ortega-Retuerta et al., 2008).
Nevertheless, the bulk measurements of bacterial abundance can mask the variations in different phylogenetic groups in the bacterial community. In this study, we observed a clear change in bacterial community structure in response to the enrichment of East Asian aerosol, and the pattern of the responses varied with the amount of aerosol addition and the geographical location of the stations. Noticeable changes in bacterial community structure following dust addition have also been reported from the Mediterranean Sea (Lekunberri et al., 2010; Laghdass et al., 2011), which is mainly due to the relief of P limitation after the input of Saharan dust. A majority of the bacteria phylotypes identified in our study belonged to the Alteromonadaceae (Gammaproteobacteria) and Rhodobacteriaceae (Alphaproteobacteria); both can respond to environmental changes rapidly, but appear to occupy different niches (Allers et al., 2007). Alteromonadaceae could rapidly respond to irregular disturbance by external events and profit from allochthonous glucose input, whereas Rhodobacteriaceae are related to more predictable autochthonous events and benefit from phytoplankton blooms (Allers et al., 2007). The most intense DGGE bands in Experiment 1 were identified as phylotypes affiliated to the family Alteromonas belonging to the most widespread cultured Gammaproteobacteria. Previous studies have observed their rapid growth after enhanced inorganic P or organic nutrient supply in the Mediterranean Sea (Pukall et al., 1999; Schäfer et al., 2001). Although these bacteria are able to respond to increased nutrient availability, they appear to be particularly vulnerable to HNF grazing (Beardsley et al., 2003; Allers et al., 2007). As a result, the intense grazing pressure at shelf station C3a after aerosol addition might be one of the reasons for the decrease in the Alteromonas group in the bacterial community. This agrees with the results of mesocosm experiments which showed that Gammaproteobacteria, particularly Alteromonas, tended to develop at the beginning of the experiments (Schäfer et al., 2001; Allers et al., 2007) but were substituted by Alphaproteobacteria, especially Rhodobacteraceae, at the end of the experiments (Lekunberri et al., 2010).
In contrast to Experiment 1 at station C3a, which was dominated by Gammaproteobacteria, the most prominent feature of Experiment 2 at station S412 was the prevalence of Alphaproteobacteria, especially species belong to Roseobacter clade, after aerosol addition. A wide distribution of Roseobacter spp. in seawater has been demonstrated across diverse marine habitats, from coastal waters to open oceans, and they undertake many roles in the marine environment (González and Moran, 1997; Buchan et al., 2005). For example, the members of the Roseobacter group have been shown to be very important in transforming organic and inorganic sulfur compounds and mediating many key processes in the sulfur cycle, including dimethylsulfoniopropionate degradation and methyl and inorganic sulfur compound utilization (González et al., 1999). In particular, bacteria belonging to Roseobacter are always associated with enhanced resource availability and have close associations with marine algae. This group has been reported to increase in abundance or even become predominant community members after natural or experimentally induced algal blooms (Schäfer et al., 2002; Buchan et al., 2005; Grossart et al., 2006). Therefore, the prevalence of those Roseobacter phylotypes may be triggered by organic substrates or inorganic nutrients released by the aerosol, or from increased phytoplankton exudation as a result of the significant phytoplankton increase after the aerosol input. However, no Gammaproteobacteria were detected by DGGE in this experiment, possibly because they were outcompeted by Alphaproteobacteria under low nutrient concentrations (Pinhassi and Berman, 2003).
A previous study which used GF/F prefiltered lake water that excluded grazing pressure and phytoplankton competition and exudation with dust addition observed no noticeable change in the bacterial community composition (Reche et al., 2009), which indicated the importance of other controlling factors in determining the impact of dust deposition on the bacterial community, such as selective consumption of protist grazers as we have discussed above, and competition for nutrients with phytoplankton species. Bacterial and phytoplankton community structure have been shown to be closely linked in previous studies (Pinhassi et al., 2004; Jasti et al., 2005; Rooney-Varga et al., 2005). The quantitative and qualitative changes in phytoplankton species composition induced by some episodic events may lead to pronounced differences in bacterioplankton species composition (González et al., 2000; Pinhassi et al., 2004). The results from the experiments conducted in parallel to this study demonstrated significant increase in the total chl a concentration in the high treatment (Fig. 9) and a substantial change in the phytoplankton community structure from picophytoplankton to microphytoplankton especially diatoms after aerosol addition (Guo et al. 2012). The succession in the phytoplankton community likely influences the quality, including the concentration and biochemical composition of autochthonous organic matter available to bacteria (Hannen et al., 1999; Quigg et al., 2003; Pinhassi et al., 2004). Mesocosm and field studies have showed that dissolved organic matter of differing quality released by different phytoplankton will benefit the development of different bacterial populations, thus substantially affecting the composition of bacterial communities (Hannen et al., 1999; Kent et al., 2007).
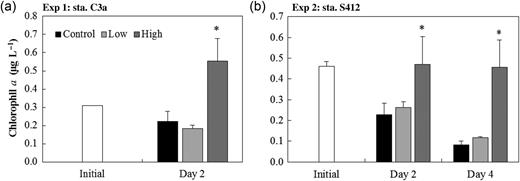
Change in the total chlorophyll a concentration during the incubation at stations C3a (a) and S412 (b). Asterisks indicate statistically significant mean values (P < 0.05) of treatments compared with the corresponding controls on the same day.
Picocyanobacteria, including Prochlorococcus and Synechococcus are also important components among the bacteria phylotypes identified. It has been reported that Synechococcus showed strong seasonal variations in SCS with <104 cells mL−1 during most time of the year, and a “bloom” occurring in winter as the result of enhanced vertical mixing that brings nutrients to the euphotic layer (Liu et al., 2007). In our study, the overall impact of the aerosol on picocyanobacteria was negative, particularly with high aerosol addition, suggesting that severe dust storms may dampen the winter Synechococcus “bloom” and shift the dominant primary producers from picoplankton to diatoms (Guo et al., 2012). The negative response of Prochlorococcus and Synechococcus to aerosol enrichment may be due to the grazing stress resulting from enhanced food quality after aerosol addition (Worden and Binder, 2003; Guo et al., 2012) or the toxicity of some aerosol-derived trace metals, such as copper (Brand et al., 1986; Mann et al., 2002; Paytan et al., 2009). On the other hand, no clear change was observed in the picocyanobacterial composition among the control, low and high dust addition treatments during the incubation. At both the experimental sites, HL II Prochlorococcus dominated in all samples, which is consistent with previous observations that Prochlorococcus ecotype HLII tend to dominate at low and mid-latitudes but to be substituted by ecotype HLI at latitudes >30° (Johnson et al., 2006). A recent study also showed the dominance of clade HL II in the surface waters of the SCS (Jing and Liu, 2012). For Synechococcus, clade II, which was suggested to thrive in upwelling, coastal and continental shelf zones between the latitudes of 30°S and 30°N (Zwirglmaier et al., 2008), was the dominant group in our experiments. Previous studies showed that Synechococcus clade II grew rapidly after the East Asian dust storm, while other clades did not show large changes, and indicated this clade as a good indicator of nutrient-related environmental changes in oligotrophic regions (Chung et al., 2010). However, we did not observe such responses clearly in our study. It might be quite hard to observe a clear increase in the compositional change due to the high proportion (∼90%) of clade II in the initial water at station S412. The relatively short incubation time (3 or 4 days) might also be the reason for the lack of change in the picocyanobacterial community composition.
Conclusion
Our study has demonstrated the effect of East Asian aerosol on the abundance and composition of microbial community in the SCS. Unlike phytoplankton, which showed a remarkable increase after aerosol amendment, we detected little change in bacterial abundance, though an apparent shift in the phylogenetic composition of the bacterial assemblage occurred. The changes in bacterial abundance and composition could be directly triggered by the input of organic substrates or inorganic elements, and further shaped by phytoplankton community structure change or differentiated mortality loss caused by bacterivory. Furthermore, the net outcome of microbial community response to aerosol input varied with the form of aerosol events and the hydrographic location of the deposition site. Understanding the link between bacterial community composition and their ecological function in response to aerosol input and its implication in oceanic carbon and element cycling will be of great importance to predict the global effect of aerosols on biogeochemical cycles under future scenarios of increasing atmospheric deposition.
SUPPLEMENTARY DATA
Supplementary data can be found online athttp://plankt.oxfordjournals.org.
FUNDING
This study was supported by the National Basic Research Program (“973” Program) of China through Grant No. 2009CB421203 and the Research Grants Council of Hong Kong RGF grants (661610 and 661911) provided to H.L.
ACKNOWLEDGEMENTS
We sincerely thank Dr. Jianzhen Yu for helping us collecting aerosol. We sincerely thank the captain and crew of R/V Dongfanghong II, chief scientist Dr. Minhan Dai, as well as the students and staff on board the cruise, for their support during the work at sea. We also thank Dr. Minhan Dai for providing in situ inorganic nutrients data and Dr. Jianyu Hu for providing the CTD data.
References
Author notes
Corresponding editor: John Dolan
