


Abstract
We present a data set describing the seasonal climatology and the spatial pattern in mortality and recruitment in early stages of Calanus finmarchicus in the lower St Lawrence estuary (LSLE) and the Gulf of St Lawrence (GSL), respectively. Contrary to the common assumption of constant mortality, daily mortality during development from egg to N3 or N6 showed important seasonal and spatial variations mostly independent from patterns in population egg production. Patterns in recruitment rate to late naupliar stages were mainly associated with patterns in survival, and dictated patterns in abundance of nauplii N4–6 (seasonal, LSLE) and early copepodite C1–2 (spatial, GSL). Consequently, recruitment to late naupliar and early copepodid stages was largely independent from patterns in population egg production. A multiple regression model showed that phytoplankton biomass and female abundance exerted opposite effects in the control of mortality, illustrating the beneficial effect of high phytoplankton biomass on the survival due to a relaxation of the cannibalism pressure or mortality owing to food shortage. A sensitivity analysis using a stage-based model clearly showed variations in the amplitude and the timing in recruitment to late naupliar stages solely due to different mortality formulations. Moreover, our simulations suggested that temperature alone should not be of primary importance in determining patterns in survival because of its general scaling effect on metabolism. Our study reinforces the importance of an adequate description of mortality and survival in studies of population dynamics and illustrates the importance of developing dynamic mortality formulations integrating multiple effects for future use in models of C. finmarchicus.
INTRODUCTION
Accurate description of mortality patterns is one of the most important challenges in marine ecology and in modeling zooplankton population dynamics (Runge et al., 2004). Despite its well-recognized importance in the control of population dynamics in planktonic copepods (Myers and Runge, 1983; Kiørboe et al., 1988; Kiørboe and Sabatini, 1994; Hirst and Kiørboe, 2002; Twombly et al., 2007), mortality has been mainly overlooked in marine ecology because of the inherent difficulty in obtaining reliable estimates in the field. This difficulty mainly arises from the openness of most marine ecosystems, i.e. that planktonic populations are subjected to losses and gains through advective processes. Because of this constraint, few studies describing marine copepod mortality using horizontal life table (HLT) analysis (Wood, 1994) have been consequently restricted to semi-enclosed systems such as fjords (Ohman and Wood, 1996), or based on high-resolution time series of relatively short duration (Ohman and Hirche, 2001; Eiane and Ohman, 2004). The need for robust approaches for applications in more open regions has recently promoted the development of the vertical life table (VLT) method (Aksnes and Ohman, 1996). The VLT approach uses the instantaneous ratios between successive life stages rather than the variability of their absolute abundance over time, which implies different assumptions allowing its use with data collected on synoptic spatial surveys or during long-time series in more open marine habitats (Aksnes and Ohman, 1996; Ohman et al., 2002; Hirst et al., 2007).
In marine copepods, in general, mortality decreases sharply from the egg and early naupliar stages to older development stages, and shows distinct stage-specific patterns among species, regions and seasons (Kiørboe et al., 1988; Kiørboe and Sabatini, 1994; Eiane and Ohman, 2004; Ohman et al., 2004; Ohman et al., 2008). Only a few studies have directly demonstrated that mortality in early stages could exert a strong effect on the population dynamics of marine copepods, mostly in small neritic species (Peterson and Kimmerer, 1994; Uye and Liang, 1998; Hirst et al., 2007). This phenomenon has been mainly attributed either to density-dependent processes (cannibalism) (Liang et al., 1994; Peterson and Kimmerer, 1994; Ohman and Hirche, 2001; Ohman et al., 2002; Ohman et al., 2008) or to predation from other copepod species (Liang and Uye, 1996a, b; Ohman et al., 2008). It is known that copepods can ingest con-specific eggs and early nauplii even in the presence of alternate algal food, although the feeding mode remains equivocal (prey switching: Landry, 1981; independent feeding mode: Basedow and Tande, 2006). In Calanus finmarchicus, egg mortality rate could exceed birth rate prior to the spring bloom, and could potentially control the seasonal pattern in recruitment to copepodid stages in the Norwegian Sea (Hirche et al., 2001; Ohman and Hirche, 2001). Based on a limited set of data, Heath et al. (Heath et al., 2008) hypothesized that spatial pattern in naupliar mortality and survival would control regional differences in recruitment to copepodid stages in the Irminger Sea (Heath et al., 2008). However, there are still very few direct demonstrations of the effect of mortality and survival on copepod recruitment and population dynamics, nor functional relationships relating mortality rate to environmental parameters. This lack of knowledge precludes the development of mechanistic functions of mortality that are needed in biological models of zooplankton population dynamics (Runge et al., 2004).
Our study aimed at testing the null hypothesis that patterns in recruitment to late naupliar stages in C. finmarchicus is determined solely by population egg production rate, implying a relatively constant rate of mortality. Conversely, our alternate hypothesis was that variations in mortality and survival in early developmental stages control patterns in recruitment. We also aimed at developing an empirical relationship between mortality in early stages and key environmental parameters for its inclusion in a biological model. We applied the VLT approach to data describing seasonal and spatial environmental conditions (temperature and phytoplankton biomass) and C. finmarchicus population dynamics (egg production and stage abundance). Results were used to describe the seasonal climatology and spatial pattern in mortality in early stages and survival (recruitment) to late naupliar stages. Data from both sources were then used to test the hypothesis that density-dependent processes (cannibalism) in C. finmarchicus would be favored at low levels of alternative food by examining the relation between mortality, ambient phytoplankton biomass and abundance of adult females. Finally, we synthesized our results as a dynamic mortality formulation incorporated in a simple biological model of C. finmarchicus that was used to compare the effect of different deterministic and dynamic mortality formulations on population dynamics.
METHOD
Field work, environmental variations and basic population parameters
A 340-m deep monitoring station located 12 nautical miles off Rimouski in the central lower St Lawrence estuary (LSLE) was visited on a quasi-weekly basis from April to October–November in 1994, 1996–2000 and 2006 (Fig. 1). Zooplankton were collected concurrently with hydrographic data (CTD, chlorophyll a biomass) with a 333-µm (1994, 1996–2000) or a 200-µm (2006) plankton net vertically towed at 0.5 m s−1 from 320 m to the surface, and with a 73 µm net from 50 m to surface (Plourde et al., 2001; Plourde et al., 2003). For the purpose of our study, abundance of naupliar stages of C. finmarchicus was estimated from 73-µm samples, while abundance of con-specific females was determined from depth-integrated samples collected with the 333-µm or 200-µm (only in 2006) nets as both sampling gears yield similar abundance estimates of late development stages (Plourde, unpublished data). Zooplankton samples and hydrographic data were also collected at 178 stations in the Gulf of St Lawrence (GSL) in June and August 2006 (Fig. 1). Zooplankton were sampled with a 200-µm net vertically towed at 1 m s−1 from 5 m above the bottom to the surface. Naupliar stages of C. finmarchicus were distinguished from those of C. glacialis and C. hyperboreus, mostly present in April and May, based on stage-specific size frequency distributions, and from Pseudocalanus spp and Metridia longa from both size and morphological criteria (Plourde, unpublished data; Durbin et al., 2000). Because nauplii N1 and N2 of C. finmarchicus could have been confounded with Metridia longa N1–2 during some years, we considered that N3 was the first stage for which a reliable identification was achieved.
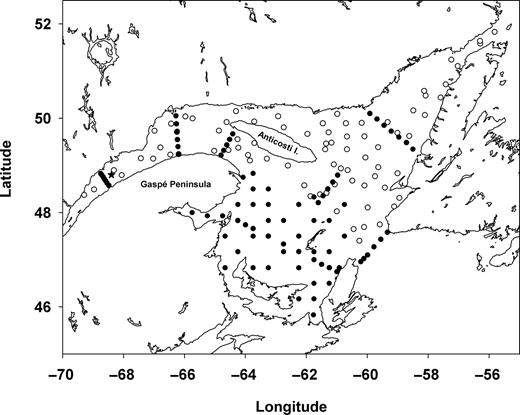
Map of the Gulf of St Lawrence showing locations of the Rimouski station in the lower St Lawrence estuary (star), and stations sampled in June (black circles) and August (open circles) 2006.
A quantitative assessment of the mesh selection indicated that N3 and N6 of C. finmarchicus were quantitatively sampled with the 73-µm and 200-µm net, respectively. The relationship between the width of organisms and mesh size described by Nichols and Thompson (Nichols and Thompson, 1991) (their equation 4) showed that the 73-µm net captured 100% of C. finmarchicus N3 (body width of 128 µm; Durbin, unpublished data). Additionally, more than 95% of nauplii stages N3–6 of C. finmarchicus are found in the upper 20 m of the water column in the LSLE (Plourde unpublished data; Durbin et al., 2000), indicating that our sampling strategy (0–50 m) was appropriate to reliably estimate abundance of C. finmarchicus N3. The same analysis applied to the 200-µm net resulted in an estimated capture efficiency of 20 and 80% for N5 and N6 (body width N5 = 169 µm, N6 = 203 µm; Durbin, unpublished data). Considering that (i) tow speed affects the capture efficiency of the smaller organisms collected by a given mesh size (Colton et al., 1980), (ii) our 200-µm net was towed at a speed typically three times lesser than the one used in the Nichols and Thompson (Nichols and Thompson, 1991) study (1 versus 3 m s−1) and (iii) we only had a limited number (20–25) of direct comparisons between the 73 and 200 µm (2006), we adopted a conservative approach and assumed that C. finmarchicus N6 were adequately sampled. Nevertheless, we assessed the potential impact of underestimating N6 abundance on our results by correcting N6 abundance based on the 80% capture efficiency estimated above and comparing daily mortality rates obtained with those estimated from non-corrected abundance data (see Results).
The population egg production rate (PopEpr) was used as the input parameter in the mortality estimate (see below). In situ Epr and hatching success were routinely measured at the fixed station (Plourde and Joly, 2008 for technical details) with the exception of hatching success in 1994. We did not measure in situ Epr during the spatial surveys in 2006, but predicted it using an Ivlev (Type II) function relating specific Epr to ambient chlorophyll a biomass (Plourde and Joly, 2008). Chlorophyll a biomass during the August 2006 cruise was estimated from region-specific relationships between in situ fluorescence and in situ direct measurement of chlorophyll a biomass done during the cruise conducted in June 2006 (Starr, unpublished data). Epr was combined with the abundance of adult females to estimate PopEpr assuming that all females were reproductively active during the spatial survey.
Calculation of mortality rate, survival and daily recruitment
We used the VLT approach to calculate instantaneous daily mortality rate (losses) in the combined egg-N3 (seasonal data) or egg-N6 (spatial surveys) stages (Ohman et al., 2002). We restricted our analysis to these stages (i) because the high mortality rates in early development stages would disproportionately impact the population dynamics relative to mortality in later stages (Ohman et al., 2008) and (ii) to minimize the potential effect of advection. As most of these early stages are located in the upper 0–30 m layer in the St Lawrence system (Runge and de Lafontaine, 1996), they would experience the same influence of transport, a prerequisite for the application of the VLT (Aksnes and Ohman, 1996). Development times (D, in days) were estimated with temperature averaged in the upper 30 m of the water column (Campbell et al., 2001). We did not consider food limitation in the determination of D in N3, N4 and N5 because mortality estimates appear generally little affected by variations in D within a factor of 2 (Ohman et al., 2004; Hirst et al., 2007).
Mortality (m) averaged across egg-N3 (megg-N3) was estimated from equation (4) in Ohman et al. (Ohman et al., 2002):
where AN3 is the abundance of N3 (no. m−2) and Degg-N2 and DN3 are D of the aggregate stage eggs-N2 and the stage N3, respectively. For the estimate of megg-N6, D from egg-N5 and in N6 were used instead.


We used the abundance of nauplii N4–6 (seasonal, LSLE) and copepodite C1–2 (spatial, GSL) to examine the relative importance of the PopEpr and our indices of recruitment RN3 and RN6 in the control of the seasonal and spatial patterns in recruitment. We used these stages because they were not included in the estimates of mortality, survival and recruitment rate (independent variables), but close enough in the cohort development schedule to minimize bias caused by variations in the development state of the population.
Condition of application of the VLT
PopEpr shows important seasonal variations in the LSLE (Plourde et al., 2001), representing a potential bias when estimating mortality with the VLT because it assumes that the population is in steady state during a period equivalent to the development duration of the stages considered in calculations (Aksnes and Ohman, 1996). We tested this assumption following Hirst et al. (Hirst et al., 2007) by examining loge transformed PopEpr during the 7 years of data in order to identify periods with consistent temporal trends. We then compared for each of the 17 periods identified the daily rates of change in PopEpr (slopes of linear regressions) with the mean megg-N3 during each period. The former metric represented daily variations in egg input, whereas the later represented the daily variation in the standing stock of egg-N3. Daily rate of changes in PopEpr during the 17 periods identified was on average 0.054 ± 0.048 day−1 (mean ± standard deviation), typically one order of magnitude lower than megg-N3 (0.628 day−1, all data). Therefore, we concluded that temporal changes in PopEpr would not significantly bias our mortality estimates.
VLT is also appropriate to estimate mortality in stage pairs that experience the same effect of transport (Ohman et al., 2004). The short residence time of surface waters (<12 days; El-Sabh, 1979) and D from egg to N3 greater than 14 days during the spring maximum in freshwater runoff (Fig. 2A and B) indicate that eggs produced in spring would encounter a greater probability of being transported downstream before developing to N3 than those laid during the summer-autumn period. Additionally, the Rimouski station is located at the upstream end of the Laurentian Channel, the overwintering ground of Calanus population in GSL, suggesting limited contribution from upstream at our sampling location (Fig. 1; Plourde et al., 2002). Therefore, there was a high potential for the egg/N3 abundance ratio used in the mortality calculations to be biased towards the egg stage due to advection from late April to mid June. We, therefore, excluded data prior to day 170 (37 out of 127 sampling events) from our statistical analyses in order to limit the potential effect of advective losses and limit the interpretation to “local” environmental conditions (Fig. 2).
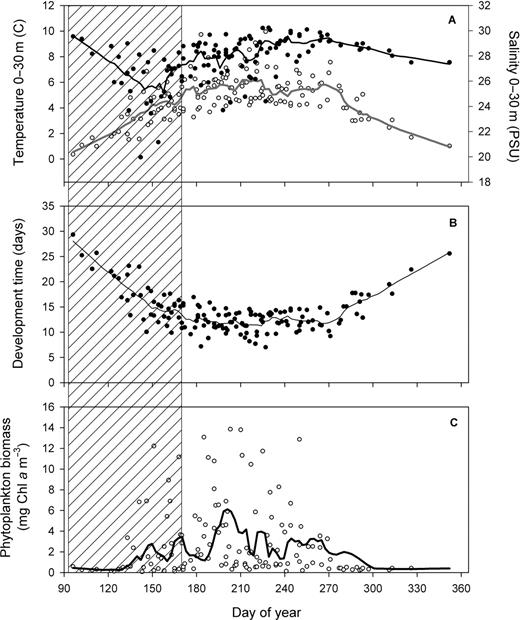
Seasonal climatology (1994–2006) in the lower St Lawrence estuary of (A) temperature (open circles) and salinity (filled circles) in the surface layer (0–30 m), (B) temperature-dependent development time (D) of Calanus finmarchicus from egg to N3 and (C) phytoplankton biomass (mg chl a m−3) averaged in the upper 50 m. Lines: Lowess smoothing function fitted to all data. Area with diagonal lines: period excluded from statistical analysis (see text for explanations).
Statistical analysis
The seasonal climatology at the Rimouski station was described using Lowess functions fitted to data from all years and spatial data were interpolated using a cubic spline function. The main objective of our study was to relate daily mortality rates to environmental conditions or recruitment to population Epr and mortality-derived population parameters, not to contrast periods or regions. Therefore, multiple linear regression models were performed with individual data to describe the relationship between megg-N3 or megg-N6 with female abundance and ambient phytoplankton biomass. Independent variables were normalized in order to respect the conditions of application of statistical analyses. A non-linear regression model was used to relate mortality estimates to female abundance. Any significant relationships obtained with this approach would indicate that the inherent uncertainties of individual mortality estimates with the VLT included in these relationships would have been affected by the underlying effect of independent variables (Aksnes and Ohman, 1996). Temperature was excluded in the analyses because its effect is already included in the mortality calculation using temperature-dependent D. However, we did present the general relationship between daily mortality rates and ambient temperature to illustrate the general influence of temperature on mortality rate as commonly done in the literature. No negative mortality estimates were obtained and stations where abundance of N3 (Rimouski station time series) and N6 (spatial surveys in 2006) was zero were included.
Biological model
We used a stage-based model of C. finmarchicus (Zakardjian et al., 2003) to test the effect of different mortality formulations on population dynamics. Simulations were driven by seasonal patterns in surface temperature and chlorophyll a biomass typical of the climatology in the NWGSL (Fig 2A). Five thousand females appeared in the system around day 90 and gradually disappeared according to a constant mortality rate. No subsequent recruitment into reproducing females was allowed. We tested the effect of four different formulations of mortality on recruitment to nauplii N4–6: (i) mortality decreasing exponentially from egg to late copepodid stages within the range of reported values for C. finmarchicus at different locations, and remaining constant with time (see Fig. 9A; Ohman et al., 2004); (ii) density-dependent megg-N2 on Georges Bank (Ohman et al., 2002) and (iii) megg-N3 in the LSLE including the negative effect of algal biomass (our study). These two formulations in early stages were combined to constant mortality in older stages used in formulation (i). Finally, (iv) we applied the formulation based on LSLE data weighted for variations in temperature using a Q10=3.5 and a base temperature of 5°C, derived from Fig. 8A in Ohman et al. (Ohman et al., 2002). Q10 was not applied to mortality in females in order to keep reproductive output in spring and early summer constant among scenarios. We used a Q10 function as temperature could not be included in the multiple regression model because it was not independent from the dependent variable (mortality), and to consider the obvious effect of temperature on mortality in marine copepods in general (Hirst and Kiørboe, 2002), and in Calanus species in particular (Ohman et al., 2002; Hirst et al., 2007).
RESULTS
Seasonal climatology in the LSLE
Temperature and salinity in the upper 30 m and phytoplankton biomass in the upper 50 m were characterized by marked seasonal variations (Fig. 2). Temperature increased gradually from a minimum of 0.4°C in early April to a maximum in August (5.5 to 6°C) (Fig. 2A), a pattern mirrored by an opposite trend in D in egg-N3 (Fig. 2B). Freshwater always has a strong influence in the LSLE with averaged values of salinity typically lower than 29 PSU with a minimum (<26 PSU) observed from late April to mid June (Fig. 2A). The climatology of chlorophyll a biomass averaged in the upper 50 m showed values >1 mg m−3 with the main bloom occurring in July. A second bloom was observed in autumn (Fig. 2C). Blooms of lesser amplitude and shorter durations were also observed in late May and June (Fig. 2C).
Climatology of C. finmarchicus female abundance and reproduction showed marked seasonal variations (Fig. 3). Female abundance increased sharply in May and remained high until late June; this main peak in abundance was followed by two brief periods of high abundance in early July and early August and by a small peak in abundance in late September (Fig. 2A). Specific in situ Epr increased in May and reached maximal values (50–80 eggs f−1 day−1) in July in response to the main phytoplankton bloom; specific Epr remained high until late September (Fig. 3A). PopEpr was characterized by three distinct peaks (>100 × 103 eggs m−2 day−1) in late May–early June, July and August corresponding to periods of high abundance of females (Fig. 3B).
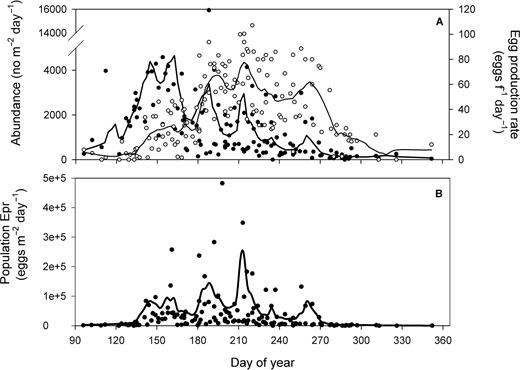
Seasonal climatology (1994–2006) in the lower St Lawrence estuary of (A) C. finmarchicus female abundance (filled circles) and specific egg production rate (open circles) and (B) population egg production rate. Lines: Lowess smoothing function fitted to all data.
Daily mortality in egg-N3 (megg-N3) and proportion surviving during development to N3 (Segg-N3) showed important variations (Fig. 4). Individual observations of megg-N3 (0.659 ± 0.317 day−1) varied by a factor of 10 while the Lowess fit (time-averaged values) showed values ranging between 0.2 and 0.8 day−1 (Fig. 4A). Daily megg-N3 peaked on two occasions during summer, once in early June (day 150–160) and the other in late July and early August (days 210–220). The peak in megg-N3 around day 315 (November) has to be interpreted with caution due to the paucity of data during this period. Segg-N3 showed minimum values corresponding to the periods of high mortality, and maximum values (0.01) in July (days 180–210) and in autumn when megg-N3 was lower (Fig. 4B).
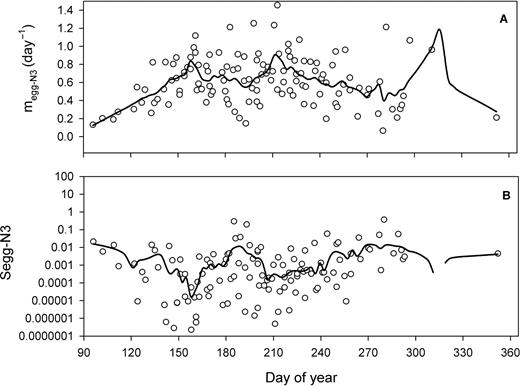
Seasonal climatology (1994–2006) in the lower St Lawrence estuary of (A) daily mortality rate in egg-N3 (megg-N3) and (B) proportion surviving from egg to N3 (Segg-N3). Lines: Lowess smoothing function fitted to all data.
The seasonal pattern in daily recruitment to the first feeding stage N3 (RN3) resulted from the interplay between the pattern in survival and PopEpr (Fig. 5A). Periods of high PopEpr in late May–early June and early August resulted in poor RN3 due to a very low survival, while the peak in RN3 occurred in July during the period of greater survival from egg to N3 (c.a. 0.01) and high PopEpr (Fig. 5A and B). This period of greater RN3 in July corresponded to the one of high abundance of N4–6 (Fig. 5C). A secondary peak in RN3 in late September and early October (centered on day 270) resulted from a short period of elevated PopEpr and survival (Fig. 5A and B). However, this late peak in RN3 did not correspond to one in abundance of N4–6 (Fig. 5C).
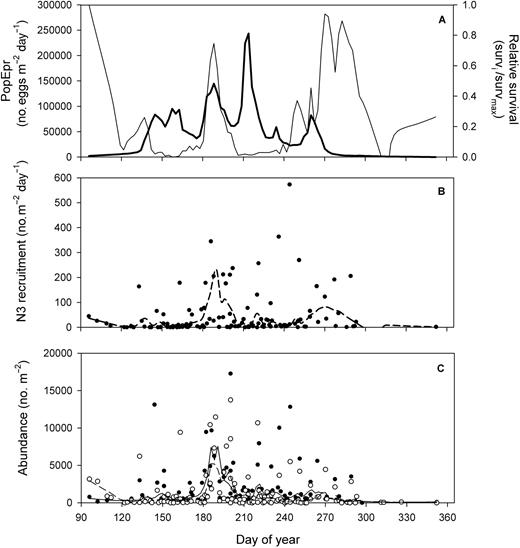
Seasonal climatology (1994–2006) in the lower St Lawrence estuary of (A) population egg production rate (Lowess fit only: bold line) and (B) relative survival (%) in egg to N3 estimated from Lowess fit data taken from Fig. 4B (survivali/survivalmax), (B) daily recruitment rate of C. finmarchicus N3 and (C) abundance of C. finmarchicus N3 (filled circles, full line) and N4–6 (open circles, dashed line). Lines: Lowess smoothing function fitted to all data.
Spatial pattern in the GSL in summer 2006
Averaged daily mortality rates in egg-N6 (megg-N6) obtained with abundance data corrected for potential undersampling of N6 with the 200-µm net (0.548 ± 0.3 day−1) and non-corrected abundance data (0.559 ± 0.3 day−1) differed by only 2% and were not significantly different (P < 0.05). We therefore concluded that megg-N6 were reliable and adequately described mortality patterns in the GSL.
Data from the spatial surveys are shown as an overall representation of the processes in the GSL in summer 2006 (Fig. 6). Temperature and chlorophyll a biomass in the upper layer of the water column were generally lower and greater, respectively, in the northwest GSL relative to the eastern regions (Fig. 6A, B). Using the same sub-regions, daily megg-N6 was significantly lower (Kruskal–Wallis, P < 0.001) west of the Anticosti Island (0.389 ± 0.228 day−1) than elsewhere in the GSL (0.644 ± 0.324 day−1). PopEpr showed important spatial variations with several regions of intense production (>120 × 103 egg m−2 day−1) located in the LSLE, and in regions located west and east of the Anticosti Island (Fig. 6C). However, daily recruitment to N6 (RN6) showed a different spatial pattern with regions of elevated RN6 restricted to few areas in the northwest GSL, off Gaspé Peninsula and in the eastern GSL (Fig. 6F). This spatial pattern closely corresponded to the one in Segg-N6 (Fig. 6E) resulting from the integration of daily megg-N6 (Fig. 6D) over D from egg to N6 estimated from temperature (Fig. 6A).
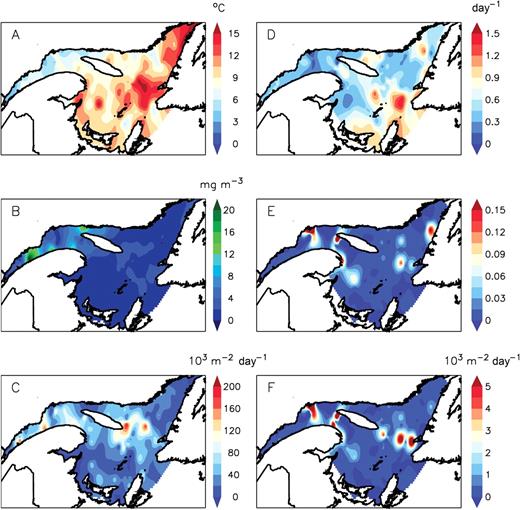
Spatial pattern in the Gulf of St Lawrence in summer 2006 of (A) surface layer temperature (0–30 m) and (B) phytoplankton biomass (mg chl a m−3) averaged in the upper 25 m and C. finmarchicus (C) population egg production rate (population Epr), (D) daily mortality rate in egg-N6 (megg-N6), (E) proportion surviving from egg to N6 and (F) daily recruitment rate to N6. Data were interpolated using a cubic spline function.
Relationship between PopEpr, recruitment rate and abundance of early stages
Our results clearly support our alternate hypothesis that variations in mortality and survival in early development stages control patterns in recruitment in C. finmarchicus. Daily recruitment (RN3 or RN6) derived from mortality and survival estimates clearly controlled the seasonal and spatial patterns in abundance of N4–6 in the LSLE and C1–2 in the GSL, respectively (Fig. 7). While abundance of these stages showed no significant relationship with PopEpr (P > 0.05) (Fig. 7A and C), RN3 and RN6 explained a significant percentage of the variance in the abundance of N4–6 in the LSLE (r2 = 0.95, Fig. 7B) and in C1–2 in the GSL in 2006 (r2 of 0.89 and 0.24 in June and August, respectively, Fig. 7D). Note that the relationship between abundance of N4–6 and RN3 in the LSLE remains highly significant without the high value (r2 = 0.54, P < 0.0001, Fig. 7B). Lower abundance of C1–2 relative to PopEpr or to RN6 in August than in June 2006 also suggests that “recruitment efficiency” of C. finmarchicus was lower in late summer in the GSL (Fig. 7C and D).
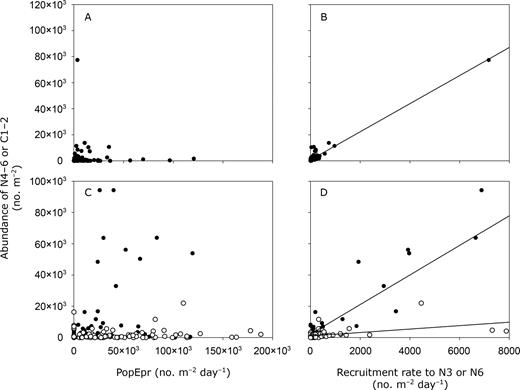
Recruitment in C. finmarchicus. Abundance of N4–6 (A and B) or N6-C1 (C and D) in relation to population egg production rate (PopEpr: A and C) and daily recruitment rate to N3 (B) or N5 (D). (A and B) Seasonal data from the lower St Lawrence estuary (1994–2006). (C and D) Spatial data from the Gulf of St Lawrence in June (filled circles) and August (open circles) 2006. Lines: linear regression fitted to the data in (B) y=10.8x+ 828.3, r2 = 0.94, (D) filled circles: y = 9.4x+ 2218.7, r2 = 0.89; open circles: y = 1.1x+1023.9, r2 = 0.24.
Relation between daily mortality and the environment
Mortality in early stages of C. finmarchicus was influenced by phytoplankton biomass and abundance of con-specific females (Table I). A multiple linear regression model (P < 0.0001) between megg-N3 and these two parameters explained 56% of the variability in mortality at the Rimouski station with opposite effects of female abundance (positive) and phytoplankton biomass (negative) (Table I). A similar regression model applied to megg-N6 from the spatial surveys in 2006 was barely not significant (P = 0.06). However, although mortality was not influenced by female abundance (P > 0.05), it was again negatively related to chlorophyll a biomass (P < 0.02) (Table I). This lack of effect of female abundance was likely due to low abundance during the surveys in 2006 (few observation >2500 ind. m−2) when compared with our seasonal data based on several years at the Rimouski station (Fig. 8A). The relationship between megg-N3 and female abundance in the LSLE was best described with a non-linear fit (Type II), explaining 34% of the variability with constant mortality rate above c.a. 8 000 female m−2 (Fig. 8A). Finally, neither egg hatching success (%) nor the proportion of eggs successfully developing to N2 (data not shown) significantly affected megg-N3.
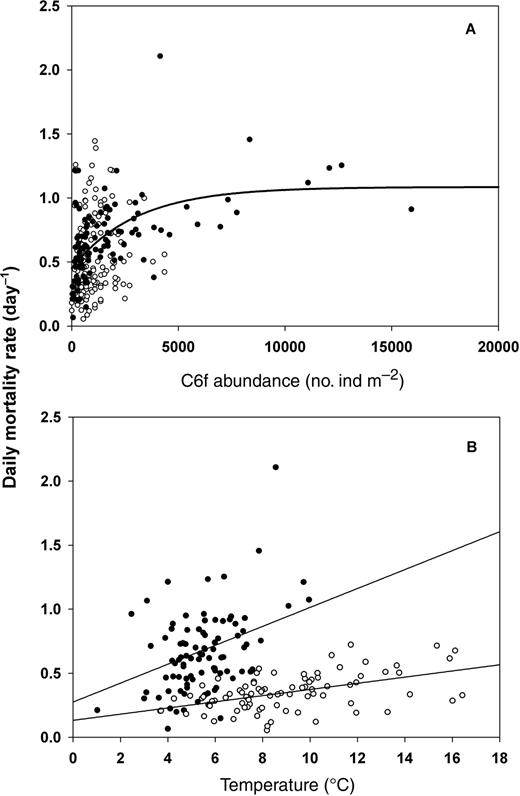
Mortality in C. finmarchicus. Daily mortality rate in egg-N3 (megg-N3, filled circles) and egg-N6 (megg-N6, open circles) in relation to (A) female abundance and (B) temperature (0–30 m). Regression models fitted to the data in (A) Type II fit with megg-N3: y = 0.45 + 0.63*(1−e−0.0003*x), r2 = 0.34, (B) linear fits for megg-N3: y = 0.074x+ 0.275, r2 = 0.18; megg-N6: y = 0.024x + 0.133, r2 = 0.24.
Calanus finmarchicus mortality and environment
| Independent variables | Dependent variables | |||
|---|---|---|---|---|
| Seasonal mEgg-N3 Partial corr. coeff. | P | Spatial 2006 mEgg-N6 Partial corr. coeff. | P | |
| Intercept | −0.426 | 0.0001 | 0.445 | 0.0642 |
| Phytoplankton biomass (mg chl a m−3) | −0.134 | 0.036 | −0.241 | 0.0310 |
| Calanus finmarchicus C6f abundance (ind. m−2) | 0.392 | <0.0001 | 0.096 | 0.166 |
| r2 adjusted | 0.56 | 0.027 | ||
| P | 0.0001 | 0.0641 | ||
Statistics of the linear multiple regression models of mortality in early stages of C. finmarchicus in the lower St Lawrence estuary (seasonal climatology of megg-N3) and the whole Gulf of St Lawrence in 2006 (spatial pattern in megg-N6) against phytoplankton biomass (mg chl a m−3) and abundance of C. finmarchicus females (C6f) (ind. m−2). Partial correlation coefficients are included to indicate the sign of the effect. Bold characters denote significant contribution of independent variables.
Temperature was not included in the multiple regression model as an independent variable because it was used to estimate the development times necessary for mortality calculations. Although these relationships should be considered with caution, we nevertheless presented megg-N3 and megg-N6 in relation to ambient temperature to illustrate the overall general effect of temperature on mortality. Daily mortality was significantly related to temperature but with a considerable variability (low r2) (Fig. 8B).
Impacts of mortality formulations on modeled population dynamics
Mortality formulations in early stages profoundly affected the modeled population dynamics (Fig. 9). First, constant daily mortality in early stages (Fig. 9A and D) combined to the seasonal cycle in temperature resulted in a generally dome-shaped pattern in survival from egg to N3 (Fig. 9B–E). Second, the inclusion of density-dependence based on data from Georges Bank (Ohman et al., 2002) generated temporal changes in daily mortality rate more or less similar to the pattern in female abundance, but a less variable seasonal pattern in survival and recruitment because its effect mainly occurred at low temperature when survival was already really low (Fig. 9D and E). However, mortality pressure was generally lower than in the “constant mortality” scenario, leading to much higher abundance of N4–6 (Fig. 9D–F). The density and chlorophyll a dependent mortality rates in the LSLE were generally higher than in previous scenarios with a slightly different seasonal pattern, resulting in some differences in the patterns of survival and recruitment to N4–6 (Fig. 9D–F). Survival and recruitment was hindered early during the high female abundance prior to the spring bloom and resulted in a delayed and much lower peak in abundance of N4–6. The addition of temperature-adjusted mortality with our Q10 modified the seasonality in daily mortality and survival relative to the LSLE set-up with a greater survival (depressed mortality) in spring under cold conditions and greater mortality (lower survival) in summer during the maximum in temperature (Fig. 9B–E). This change in seasonal pattern resulted in an earlier peak in abundance of N4–6 (Fig. 9F). Finally, all formulations resulted in a secondary peak in abundance of N4–6 in autumn during a period of relatively low PopEpr that was compensated by low number of females, high phytoplankton biomass and relatively high temperature (Fig. 9B–F).
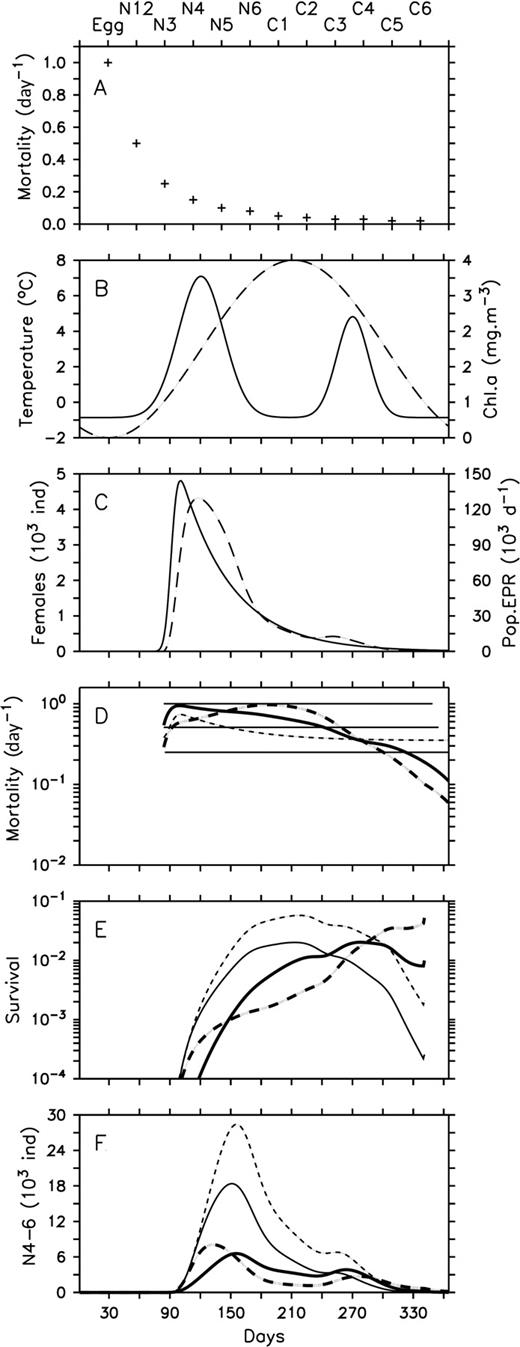
Impacts of four mortality formulations on the recruitment to nauplii N4–6 using a 0-D model of C. finmarchicus. (A) Stage-specific constant mortality, (B) temperature (dashed line) and phytoplankton biomass (mg chl a m−3) (line) typical of the northwest GSL, (C) abundance of females (line) and population egg production rate (PopEpr) (dashed line), mortality in early stages (D), proportion surviving from egg to N3 (E) and abundance of nauplii N4–6 (F). Only daily mortality in early stages varied among scenarios: (i) stage-specific constant mortality in eggs, N1–2 and N3 (lines); (ii) density-dependent mortality in egg-N2 (thin dashed line) (Ohman et al., 2002); (iii) mortality in egg-N3 (megg-N3) dependent to the abundance of female and phytoplankton biomass (bold line) (our study); (iv) megg-N3 dependent to the abundance of female and phytoplankton biomass adjusted to variations in temperature with a Q10 (bold dashed line) (our study).
DISCUSSION
Our results clearly illustrated the importance of mortality and survival in early stages in the control of C. finmarchicus recruitment. In the following sections, we compared our mortality estimates in early stages of C. finmarchicus in the St Lawrence system to similar data from other regions in the North Atlantic. We then interpret our results in the context of how environmental conditions control mortality and survival, and how these parameters affect recruitment and population dynamics. Finally, implications of our results and the importance of using dynamic functions describing mortality in modeling population dynamics of C. finmarchicus are discussed.
Comparison of mortality in early stages in the Gulf of St Lawrence with other regions
Daily mortality in early stages egg-N3 (megg-N3, seasonal) and egg-N6 (megg-N6, spatial) of C. finmarchicus in the LSLE and GSL appeared greater than in other regions across the North Atlantic. The most robust comparison could be done with daily megg-N3 observed during a multi-year program on Georges Bank (Ohman et al., 2008). In this region, the overall averaged daily megg-N3 was c.a. 0.4 day−1 (based on Fig. 2B in Ohman et al., 2008) in comparison to an average of 0.659 ± 0.317 day−1 in the LSLE (Fig. 4A). Similarly, the averaged daily mEgg-N6 in the LSLE–GSL in summer 2006 (0.566 ± 0.320 day−1, Fig. 6D) could have been somewhat greater than megg-N3 observed on Georges Bank because including N4–5 would likely diminish the “averaged” mortality. Although these comparisons are somewhat qualitative, it does suggest a potential for a greater “mortality losses” in early stages in the LSLE–GSL. A comparison with mortality in early stages of C. finmarchicus observed in other areas in the North Atlantic is difficult because of different stage resolutions and approaches used to estimate mortality (VLT or HLT) (Ohman et al., 2004; Heath et al., 2008). However, it does suggest that mortality rates estimated in our study were in the same range than those observed in deep oceanic regions (Norwegian Sea, Irminger Sea) and could be greater than in the North Sea and in two Norwegian fjords (Ohman et al., 2004; Heath et al., 2008). The comparison among regions would be reinforced by the use of similar mortality indexes estimated using the same approach.
Processes controlling mortality and survival
Temperature is an important factor in the control of marine copepod metabolism, affecting egg production, development, growth and mortality (Huntley and Lopez, 1992; Hirst and Bunker, 2003; Bunker and Hirst, 2004). Temperature influences daily mortality in C. finmarchicus (Ohman et al., 2002), and certainly represent an underlying factor controlling the seasonal and spatial patterns in daily mortality rate in early stages. However, temperature alone should not be an important factor in the control of the seasonal and spatial patterns in the proportion surviving within the “optimal” temperature range of C. finmarchicus. Survival is the integration of the effect of daily mortality rate during the development from egg to N3 or N6 and represents the key variable to consider when relating processes such as EPR and daily mortality to stage abundance (recruitment). Theoretical considerations indicate that temperature would scale both mortality and development rates, which should result in relatively constant survival. Results from our model best illustrate this phenomenon: our scenario of constant daily mortality rates weighted for the seasonal change in temperature with a Q10 function yields a relatively constant survival in comparison to mortality formulations with constant mortality or including effects from density-dependent process and phytoplankton biomass (Fig. 10). Patterns in mortality and survival observed in early stages of C. finmarchicus in the LSLE and in C. helgolandicus in the English Channel deviated considerably from the seasonal cycle in temperature (Fig. 2, 4; Hirst et al., 2007), resulting in highly significant relationships but with a considerable variability (low r2) (Fig. 8B, Ohman et al., 2002; Hirst et al., 2007). Based on this evidence, we suggest that patterns in survival would be governed by factors other than temperature that would change the equilibrium between temperature-driven mortality and development rates such as density-dependent processes (cannibalism), phytoplankton biomass and predation.
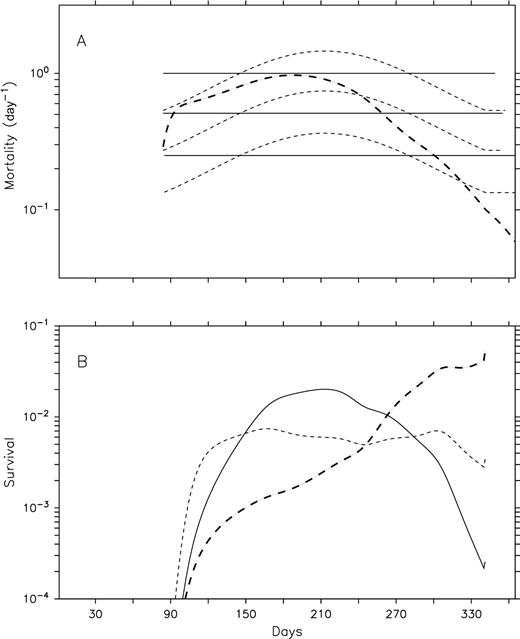
Impacts of temperature-adjusted constant mortality on survival in early stages of C. finmarchicus. Mortality in early stages (A) and survival (%) from egg to N3 (B). Lines: constant daily mortality rate in egg, N1–2 and N3; thin dashed lines: constant daily mortality rate in egg, N1–2, and N3 adjusted to temperature with Q10; bold dashed line: daily mortality in egg-N3 dependent to the abundance of female and phytoplankton biomass adjusted to variations in temperature with Q10.
Our study supports previous findings suggesting density-dependent processes as important factors controlling mortality in early stages of C. finmarchicus, especially during periods of low phytoplankton biomass as suggested by our results (see below). Density-dependent mortality was only observed at relatively high abundance of adult females. Mortality was significantly related to female abundance in the LSLE but not in the GSL in summer 2006 owing to the relatively low numbers, with only a few observations above 2500 ind. m−2 (Fig. 8A). Interestingly, a similar abundance threshold of 2000 ind. m−2 for the occurrence of density-dependent mortality in C. finmarchicus was reported by Ohman et al. (Ohman et al., 2002) and Ohman et al. (Ohman et al., 2004). The Type II relationship in the LSLE indicates that constant mortality would occur at female abundance greater than c.a. 8000 ind. m−2, which would be somewhat similar to the relationship shown for megg-N3 on Georges Bank (Ohman et al., 2002). Other evidence of density-dependent mortality in C. finmarchicus showed linear relationships with a slope on Georges Bank (7.9 × 10⁻⁵) considerably weaker than in the Norwegian Sea (2.5 × 10⁻⁴) (Ohman et al., 2004). These differences are not surprising because different stages were considered in the mortality estimates (egg-N3, egg-N2 and egg) and could partly arise from the use of VLT or HLT (Ohman et al., 2004). Moreover, such relationships are only a crude proxy of the underlying mechanism hypothesized to mediate density-dependence in C. finmarchicus (and other copepods), i.e. cannibalism by late development stages on eggs and early naupliar stages (Landry, 1981; Basedow and Tande, 2006). The good correspondence between estimated daily egg loss in C. finmarchicus and daily predation by potential predators (including C. finmarchicus C4–6) illustrates the benefit of refining our approach (Ohman et al., 2008).
Phytoplankton biomass depressed mortality in early stages of C. finmarchicus in the presence or absence of density-dependent processes. Because megg-N3 in the LSLE mostly included non-feeding stages, this negative relation between chlorophyll a biomass and mortality suggests that high level of phytoplankton biomass would diminish cannibalism pressure on early stages by late copepodid stages, supporting our initial hypothesis that density-dependent processes would be promoted at low ambient phytoplankton biomass. Although evidence is scarce, Calanus species show an ability to ingest their own eggs in the presence of algal food and exhibit potentially different feeding mode such as prey switching (C. pacificus: Landry, 1981) or an independent feeding mode (C. finmarchicus: Basedow and Tande, 2006). We argue that both feeding modes would result in a lower ingestion of eggs and early nauplii at high phytoplankton biomass either because females switch to algal prey when phytoplankton is disproportionally more abundant or attain satiety more quickly (feed for less time) when the overall food concentration is greater. The level of phytoplankton biomass could also have affected our results because of food limitation in the naupliar stages. Food limited growth and survival would likely play a bigger role in the estimate of megg-N6 from our spatial survey in 2006 than in the megg-N3 in the LSLE (more feeding stages involved in the estimate). Nauplii growth and development rates are limited below a chlorophyll a biomass of 1.75 mg m−3 (using a chl a: C ratio of 40 as in Heath et al., 2008; Campbell et al., 2001), while a food concentration above 0.6 mg chl a m−3 appears to be necessary for Calanus nauplii to survive (Lopez, 1996; Irigoien et al., 2003). In the Irminger Sea, mortality in the first feeding stages N3–4 was two to four times greater at chlorophyll a concentrations lower than 0.6 mg m−3 dominated by flagellates, suggesting that starvation was a major cause of mortality in these stages (Irigoien et al., 2003; Heath et al., 2008). This situation is not unusual in the St Lawrence system where algal biomass is limiting for nauplii growth (<1.75 mg chl a m−3) and survival (<0.6 mg chl a m−3) accounted for 50–55% of the observations included in our multiple regression models. Low phytoplankton biomass (<1 mg chl a m−3) dominated by flagellates is a common feature during post-bloom conditions over large areas of the GSL (Ohman and Runge, 1994; Runge and Plourde, 1996).
Our study targeted density-dependent processes driven by C. finmarchicus females but predation by other filter-feeding copepods could represent another important source of mortality in early stages of C. finmarchicus in the LSLE and GSL. Several other copepod species have been shown to ingest copepod eggs and naupliar stages, but very little is known about their feeding behavior and, consequently, their predation impact (Sell et al., 2001; Ohman et al., 2008). Copepodid C4–5 of C. finmarchicus have been included in the assessment of the density-dependent mortality in other studies (Ohman and Hirche, 2001; Heath et al., 2008; Ohman et al., 2008). We did not include them in our analysis because our sampling scheme did not allow for discrimination between the “active” and “overwintering” components of the population. However, the presence of high abundance of copepodid C4–5 in the surface layer in late July and August in the LSLE and northwest GSL suggests that these stages could contribute to the high mortality, low survival and low recruitment during this period (Fig. 6) (Plourde et al., 2001). Additionally, late stages of C. hyperboreus, C. glacialis and M. longa are very abundant in the surface layer at the onset of C. finmarchicus reproduction in May and June, and could constitute an additional cause of the high mortality/low survival in early stages during this period (Fig. 4) (Plourde et al., 2002; Plourde et al., 2003). Predation on C. finmarchicus eggs by these copepod species has been observed (Plourde, unpublished data) and could provide them with an adaptive advantage in exploiting the early stage of the phytoplankton bloom, an ecological strategy called intraguild predation believed to be of primary importance in shaping communities (Polis et al., 1989). In future studies, we need to distinguish between the active and overwintering components of Calanus species to include all potential predators. Clearly, more knowledge on the feeding behavior and ecology in filter-feeding copepods is required in order to understand the effect of cannibalism and predation on mortality and survival in eggs and early naupliar stages of C. finmarchicus.
Predation regime has been mentioned as the most probable factor explaining regional differences in mortality patterns on Georges Bank and in the Irminger Sea (Heath et al., 2008; Ohman et al., 2008). The copepod community differs markedly between the LSLE and Georges Bank with a much greater contribution from large-bodied copepods such as C. finmarchicus, C. hyperboreus, C. glacialis and Metridia longa in the LSLE relative to a community dominated by small-bodied Centropages spp, Pseudocalanus spp and Temora longicornis on Georges Bank (Davis, 1984; Plourde et al., 2002). Calanushyperboreus and C. glacialis differ from C. finmarchicus in their life cycle strategy as they occur in the surface layer early in the season during the onset of reproduction of the C. finmarchicus population (Conover, 1988; Plourde et al., 2001; Plourde et al., 2003), on the contrary to Georges Bank where predators are mostly abundant later in the season relative to C. finmarchicus dynamics (Ohman et al., 2008). Similar regional differences in the composition of the copepod community are also observed between the shallow southern GSL and deeper areas of the LSLE and northern GSL (Harvey et al., 2005). Such differences in predator composition and phenology would likely be of primary importance in defining region-specific differences in level and patterns in mortality in C. finmarchicus in the GSL.
Processes controlling recruitment
Daily recruitment rate estimated from the PopEpr and survival was the main factor controlling C. finmarchicus late naupliar and early copepodid abundance. A peak in daily recruitment to N3 or N6 (and in abundance of subsequent stages) only occurred during periods or in regions of elevated survival (Figs 5 and 6). Alternatively, periods or regions of high PopEpr did not necessarily result in high recruitment rate, although significant PopEpr (reproductive output) had to occur in conjunction with good survival to generate a peak in early stages (Fig. 7). Therefore, high survival in early stages was a prerequisite for high recruitment. Our indexes of daily recruitment allowed a clear illustration of opposite forces exerted by reproduction (bottom-up process) and mortality/survival (top-down process) in the control of population dynamics in C. finmarchicus (Twombly et al., 2007). This interplay between bottom-up and top-down processes and its effect on population dynamics has only been implicitly considered in a few studies on Calanus spp. and Pseudocalanus spp. (Ohman and Wood, 1996; Pierson et al., 2007; Hirst et al., 2007; Heath et al., 2008). More exhaustive description of the effect of these processes on population dynamics has been made for small neritic copepod species (Liang et al., 1994; Peterson and Kimmerer, 1994; Liang and Uye, 1996a, b). Our study has clearly identified the importance of considering multiple environmental parameters in order to get a glimpse at the complex nature of the control of recruitment and population dynamics in copepods (Twombly et al., 2007).
Mortality estimates: limitations and assumptions
The use of the VLT implies theoretical assumptions and application conditions that are sometimes difficult to meet in the field (Aksnes and Ohman, 1996). We believe that the restriction of our study to early stages and our general approach would have minimized potential violations of the conditions of application of the method. We first explored whether temporal changes in C. finmarchicus PopEpr would significantly affect our mortality estimates as it has been demonstrated that VLT is sensitive to trends in recruitment (Aksnes and Ohman, 1996). We found that daily change in the PopEpr represented on average 8% of the daily rate of change in megg-N3, meaning it would not significantly bias our results (Hirst et al., 2007). Secondly, the fact that our study was limited to the mortality from egg to N3 should minimize the potential problems caused by variations in development time or successive development stages not being at short-term equilibrium (recruitment-mortality) over the time considered in our estimates (D from egg to N3; Aksnes and Ohman, 1996; Ohman et al., 2002). Thirdly, temperature is certainly a good predictor of development time as stages included in our estimates were mostly non-feeding stages egg, N1 and N2 although food limitation could delay development in N3 of C. finmarchicus (Campbell et al., 2001). However, the VLT is relatively robust to variations in stage development by a factor of two (Aksnes and Ohman, 1996; Hirst et al., 2007). Finally, we excluded data that could have been affected by the combined effect of the station location in the LSLE and losses due to advection in spring (see Methods section), hence likely minimizing the bias caused by differential transport in successive stages (Aksnes and Ohman, 1996; Ohman et al., 2002).
Hirst et al. (Hirst et al., 2007) described mortality patterns in early stages of C. helgolandicus during two consecutive years and used smoothed values of mortality estimates in their relationships with environmental parameters. They were motivated by the fact that mortality estimates from the VLT are more robust when averaged over 5–7 values (Aksnes and Ohman, 1996; Hirst et al., 2007). We applied the same approach to our data using Lowess fits and obtained very similar results in our statistical analysis (not shown). However, our time-dependent smoothed values actually represented means of data from several years (seasonal climatology based on several years), which markedly differed from Hirst et al. objectives (Hirst et al., 2007). We, therefore, concluded that using discrete data of both mortality estimates and environmental parameters were more appropriate in the context of our study. We argue that the significant relationships obtained with this approach indicate that the underlying effect of independent variables would dominate over the inherent uncertainties of individual mortality estimates with the VLT (Aksnes and Ohman, 1996).
Mortality formulations and modeling population dynamics in Calanus finmarchicus
Simulations with our stage-based model of C. finmarchicus demonstrated that differences in mortality formulations generate important variations in population dynamics (Fig. 9). Historically, mortality has been used in biological models of zooplankton as a closure term with imposed stage-specific mortality that could be “manipulated” to fit modeled results to observations (Heath et al., 1997; Lynch et al., 1998; Miller et al., 1998). Contrary to bottom-up processes such as egg production, development and growth for which the use of mechanistic formulations is widespread, only in a few instance has mortality been “adjusted” from environmental parameters such as temperature or food (Bryant et al., 1997; Zakardjian et al., 2003; Runge et al., 2004; Speirs et al., 2006). The different mortality formulations used in our study depicted either a deterministic stage-specific mortality schedule representative of the overall values found in the literature (see Fig. 9A) or the addition of a dynamic component to this schedule by the inclusion of density-dependent mortality in early stages. This density-dependent mortality was for egg-N2 from Georges Bank (Ohman et al., 2002) or for egg-N3, weighted for phytoplankton biomass and temperature from LSLE (our study). These different formulations resulted in distinct seasonal pattern in daily mortality rate, survival and significant alterations to the seasonal pattern and absolute level of recruitment to late nauplii stages N4–6 (Fig. 9), illustrating the sensitivity of the population model to mortality and the importance of using region-specific mortality patterns. Mortality is one of the greatest challenges in zooplankton modeling and the ability to “apply” representative region-specific mortality patterns would be a significant improvement to the current situation (Runge et al., 2004).
Giving the importance of mortality in the control of population dynamics, mechanistic mortality functions constitute a prerequisite for simulating seasonal, inter-annual and spatial variations in population dynamics of zooplankton (Runge et al., 2004). To our knowledge, our “multivariate” formulation of mortality in early stages egg-N3 based on female abundance (density-dependent process), phytoplankton biomass and temperature (Q10 for seasonal forcing) represents the first attempt at integrating multiple effects from environmental and population-related (density-dependent) parameters on mortality and survival into a dynamic function in modeling of C. finmarchicus, and in zooplankton in general. Accurate formulations of processes regulating production, mortality, survival and recruitment in early development stages of copepods appear to be critical owing to the elevated losses experienced by early stages relative to older ones (Ohman et al., 2008; Heath et al., 2008). However, our formulation is based on empirical relationships between mortality and environmental parameters rather than representing the “true” mechanism involved (example: feeding rate of female on their eggs and early nauplii stages). It nevertheless provides a way to introduce non-linearity in population response to variations in environmental forcing and the capability of biological models to simulate temporal and spatial patterns in population dynamics of C. finmarchicus (Ohman et al., 2002; Runge et al., 2004; Speirs et al., 2006).
FUNDING
This work was funded by the Department of Fisheries and Oceans, Canada, and by a PhD scholarship from the Natural Science and Engineering Research Council of Canada to F.M.
ACKNOWLEDGEMENTS
We wish to thank I. St-Pierre, J.-F. St-Pierre, F. Demontigny, A. Gagné, D. Archambault, Y. Gagnon and R. Desmarais and others for their help at sea. We are thankful to L. Devine and C. Lafleur for the management of environmental data. M.-F. Beaulieu, C. Lebel, P. Rivard and S. Guittard analyzed zooplankton samples. Computing routine for mortality calculations were written by C. Lafleur. Comments from three anonymous reviewers greatly helped improving our manuscript.
REFERENCES
Author notes
Corresponding editor: Roger Harris
