


Abstract
Of the 4 medulloblastoma subgroups, Group 3 is the most aggressive but the importance of angiogenesis is unknown. This study sought to determine the role of angiogenesis and identify clinically relevant biomarkers of tumor vascularity and survival in Group 3 medulloblastoma.
VEGFA mRNA expression and survival from several patient cohorts were analyzed. Group 3 xenografts were implanted intracranially in nude rats. Dynamic susceptibility weighted (DSC) MRI and susceptibility weighted imaging (SWI) were obtained. DSC MRI was used to calculate relative cerebral blood volume (rCBV) and flow (rCBF). Tumor vessel density and rat vascular endothelial growth factor alpha (VEGFA) expression were determined.
Patient VEGFA mRNA levels were significantly elevated in Group 3 compared with the other subgroups (P < 0.001) and associated with survival. Xenografts D283, D341, and D425 were identified as Group 3 by RNA hierarchical clustering and MYC amplification. The D283 group had the lowest rCBV and rCBF, followed by D341 and D425 (P < 0.05). These values corresponded to histological vessel density (P < 0.05), rat VEGFA expression (P < 0.05), and survival (P = 0.002). Gene set enrichment analysis identified 5 putative genes with expression profiles corresponding with these findings: RNH1, SCG2, VEGFA, AGGF1, and PROK2. SWI identified 3 xenograft-independent categories of intratumoral vascular architecture with distinct survival (P = 0.004): organized, diffuse microvascular, and heterogeneous.
Angiogenesis plays an important role in Group 3 medulloblastoma pathogenesis and survival. DSC MRI and SWI are clinically relevant biomarkers for tumor vascularity and overall survival and can be used to direct the use of antivascular therapies for patients with Group 3 medulloblastoma.
Group 3 medulloblastoma is the deadliest of the 4 medulloblastoma subgroups. Genetic alterations that drive tumorigenesis and angiogenesis have not been well described. There is a need to elucidate the importance of angiogenesis in Group 3 medulloblastoma as a therapeutic target and a need to identify clinically relevant biomarkers to predict tumor vascularity and survival. In several patient cohorts, we found significantly elevated VEGFA mRNA levels in Group 3 medulloblastoma and an association of VEGFA mRNA expression and survival. We then used Group 3 rodent models to demonstrate that increased tumor vascularity was negatively associated with survival by both DSC MRI and SWI. These MRI findings corresponded to histologic vessel density and rodent VEGFA protein expression. Furthermore, gene expression profiling identified 5 putative drivers of angiogenesis. For the first time, we demonstrate a relationship between angiogenesis and Group 3 medulloblastoma pathogenesis and survival.
Little is known about the importance of angiogenesis in the pathogenesis of medulloblastoma. In vitro studies of angiogenesis in medulloblastoma have reliably shown high vascular endothelial growth factor (VEGF) expression,1,2 a key component of angiogenesis. However, unlike other types of malignant brain tumors,3 a clear association between angiogenesis and poor prognosis in patients with medulloblastoma has not been established.2,4 Medulloblastoma consists of at least 4 distinct molecular subgroups: wingless (Wnt), sonic hedgehog (SHH), Group 3, and Group 4. An association of both SHH and Wnt signaling and angiogenesis has been described.5–10 However, medulloblastoma-specific pathways of angiogenesis, particularly in Group 3 and Group 4, are unknown.
Of the 4 subgroups of medulloblastoma, Group 3 has the worst prognosis,11–13 with a 5-year overall survival (OS) of just over 50% compared with 70% for the other 3 groups. In a recent multivariable analysis accounting for subgroup, age, metastatic status, adjuvant therapy, and institution where treatment was administered, Group 3 status was the strongest predictor of poor progression-free survival (PFS) and OS.11 Group 3 tumors predominantly arise in infants and children, and metastases at presentation are relatively common. MYC amplification is almost exclusively found in Group 3 tumors,14 but other tumor and angiogenesis drivers have not been identified.15MYC amplification has been associated with angiogenesis and VEGF alpha (VEGFA) expression in solid tumors.16,17 We therefore hypothesize that angiogenesis plays a key role in the poor prognosis associated with Group 3 medulloblastoma.
Due to the lack of understanding of Group 3 tumorigenesis and angiogenesis, there are currently no therapeutic agents that specifically target Group 3 medulloblastoma. Additionally, clinically relevant biomarkers to predict therapeutic responders in patients with Group 3 tumors have not been described. There is a critical need to identify therapeutic targets and biomarkers in Group 3 medulloblastoma.
In a large group of patients, we found that VEGFA mRNA levels are significantly higher in Group 3 compared with the other subgroups, and high VEGFA mRNA expression is associated with worse outcome. We then used intracranial rodent models of Group 3 medulloblastoma to demonstrate the importance of angiogenesis in prognosis, using dynamic susceptibility contrast (DSC) MRI as a biomarker for tumor vascularity and survival. We then correlate this MRI data with angiogenic gene expression profiling to identify putative genes that drive angiogenesis in Group 3 medulloblastoma. We also propose a novel classification of MRI tumor vascular architecture using susceptibility weighted imaging (SWI) in rodent models and gradient echo (GRE) MRI in humans as a novel biomarker for survival. We expect that the results of this study will be used to direct the use of antivascular therapy in patients with Group 3 medulloblastoma.
Materials and Methods
Patient VEGFA mRNA Expression and Survival
The R2 Genomics Analysis and Visualization Platform (http://r2.amc.nl) was used to investigate VEGFA mRNA expression across medulloblastoma subgroups using publicly available datasets.18–20 Treatment information of these cohorts is not available. However, the majority of patients were treated at Children’s Oncology Group–affiliated organizations from the late 1990s to the early 2010s. ANOVA was used to compare VEGFA mRNA levels among subgroups. Patients were categorized as having “high” or “low” VEGFA mRNA levels using Bonferroni multiple comparisons to find natural cut points for these designations. Log-rank testing was also completed. Levels of mRNA of RNH1, SCG2, AGGF1, and PROK2 were subsequently analyzed using the same methods.
Gene Expression Profiling
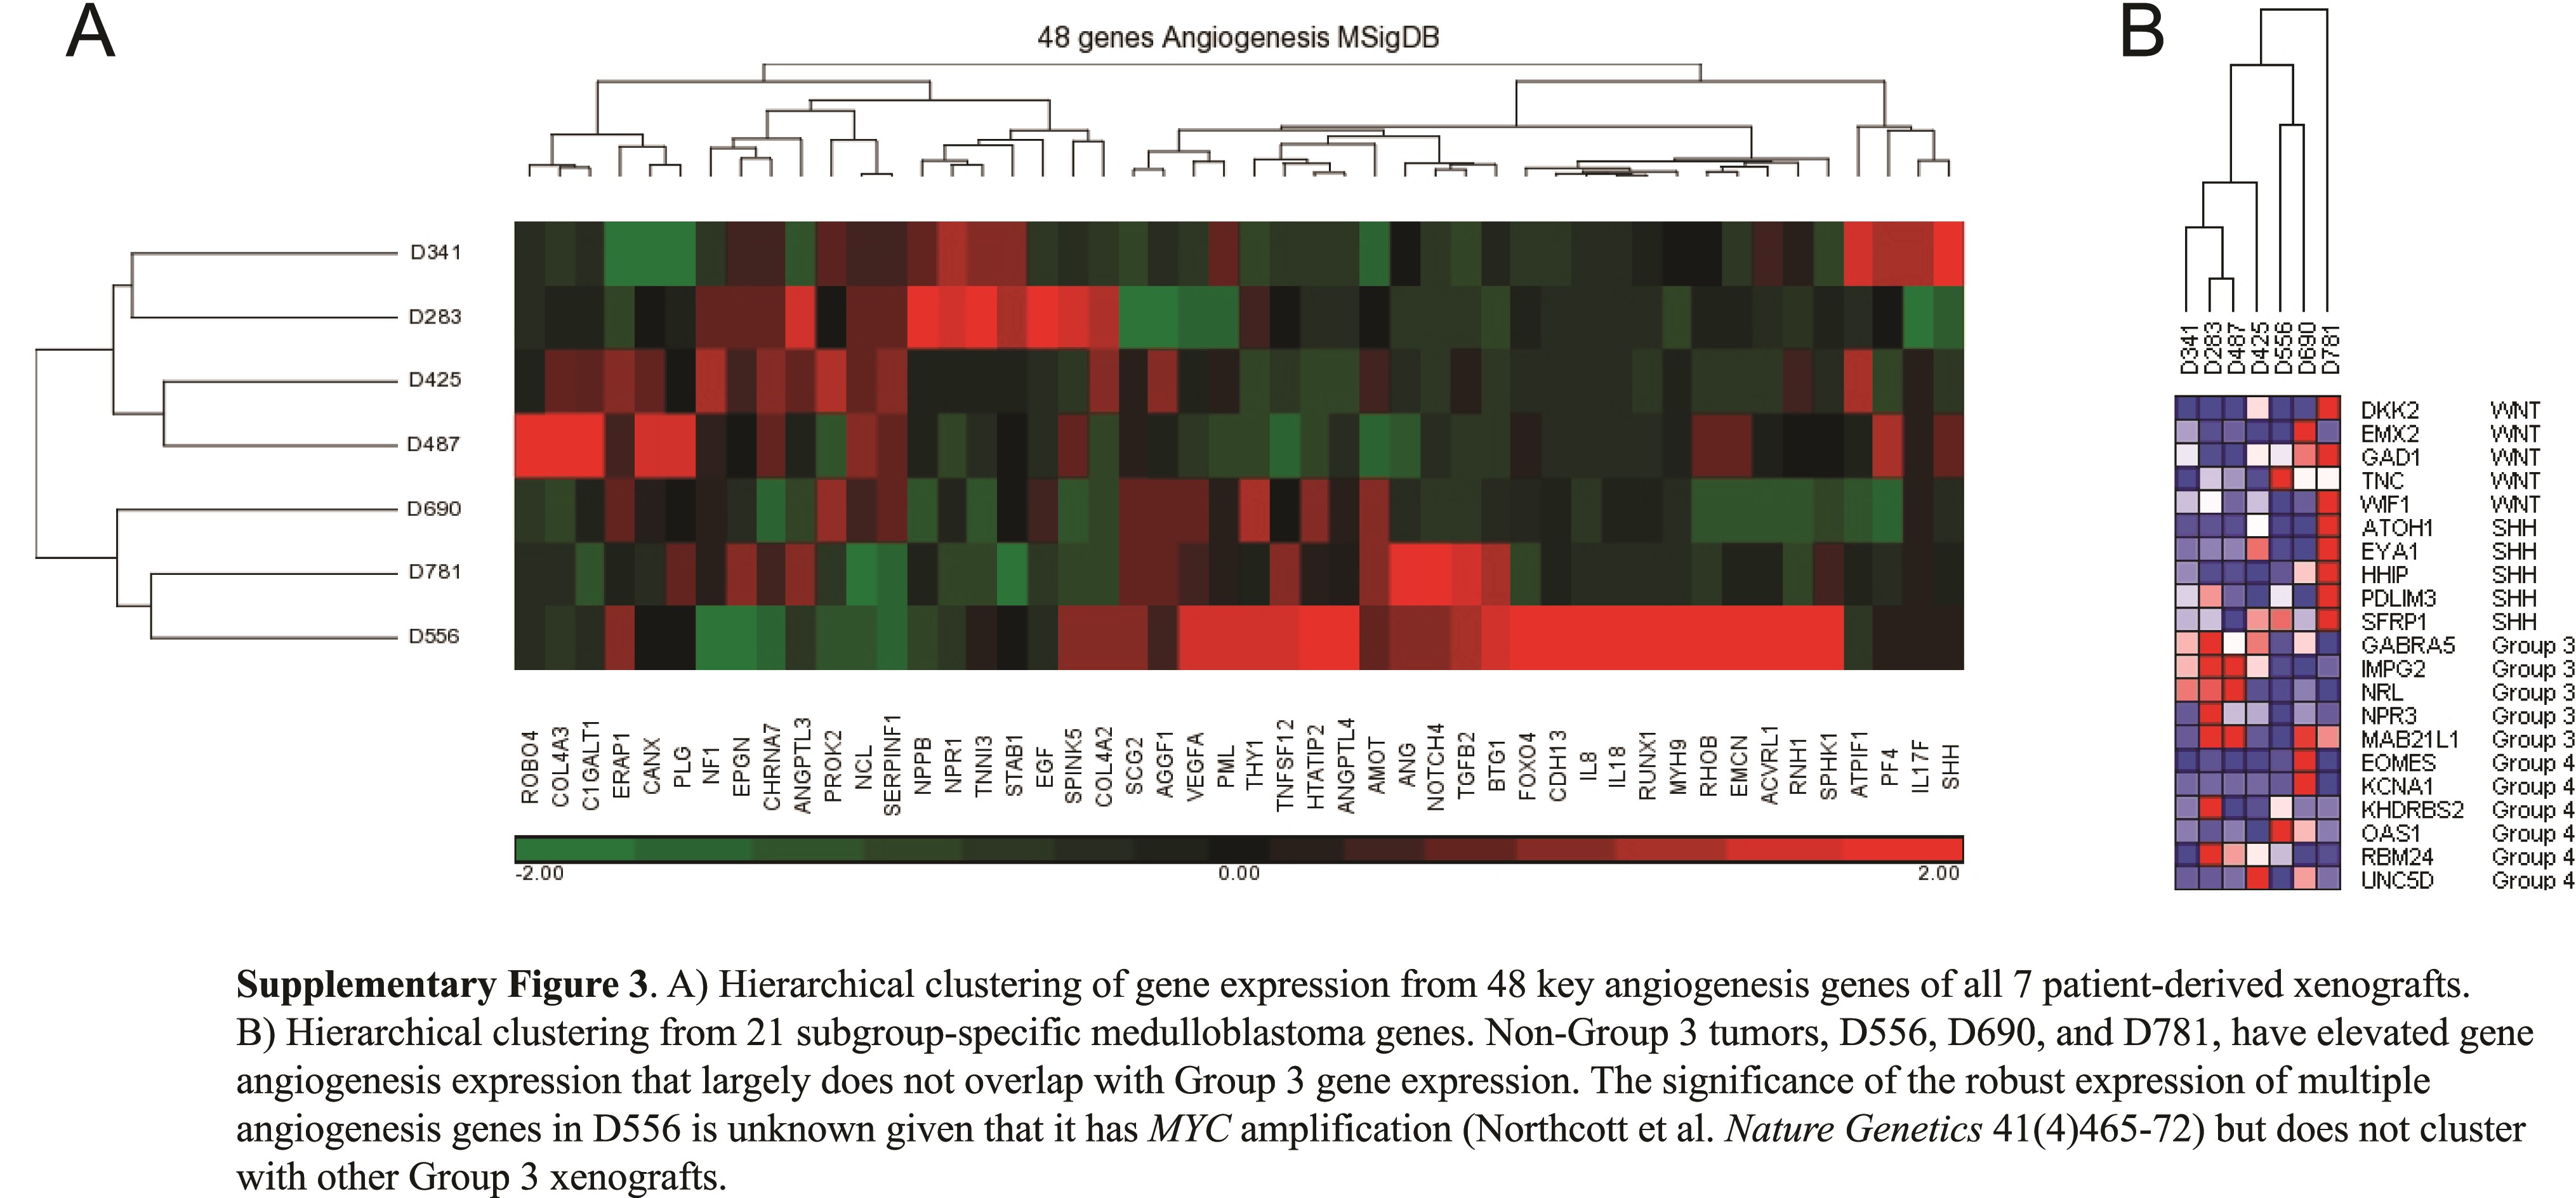
Gene expression profiling (GEP) of Duke University medulloblastoma patient-derived xenografts was performed as previously described using 2 different methods.21,22 In the first method,21 RNA was processed and hybridized to the Affymetrix Gene 1.1 ST array (Centre for Applied Genomics, Toronto, Canada). CEL file output was entered into Gene Set Enrichment Analysis (GSEA) software (Broad Institute). In the second method, total RNA was extracted using the Trizol method, nanoString nCounter Technology was used to quantify the expression level of 21 medulloblastoma subgroup-specific signature genes.22 Unsupervised hierarchical clustering and MYC amplification profiles23 were used to identify Group 3 xenografts. The “angiogenesis” gene set of the Molecular Signatures Database (Broad Institute/MSigDB) was used to compare gene expression of Group 3 xenografts.
Medulloblastoma Xenograft Preparation
All animal procedures conformed to the guidelines of the Institutional Animal Care and Use Committee and the National Institutes of Health. Male and female athymic mice (nu/nu genotype, Balb/c background, 6- to 8-wk old) were used to maintain xenograft lines. Xenograft tumor homogenate was injected subcutaneously into the right flank of athymic mice at an inoculation volume of 50 μL with a 19-gauge needle.24–26 Tumors are allowed to reach a size of 1000–1500 mm3. Xenografts were sterilely removed from animals and morsalized through a tissue press. The tissue was then agitated in 20 mL of phosphate buffered saline and passed through a 70 µM filter.
Medulloblastoma Intracranial Tumor Models
Nude female rats (Charles River) weighing 180–240 g were administered 100 mg/kg cyclophosphamide i.p. 24 hours prior to tumor implantation to facilitate tumor engraftment.27 Animals were sedated using isoflurane (5% induction, 2% maintenance) and placed in a stereotactic headframe (David Kopf Instruments); 1.5 × 10³ cells in 15 µL 50/50 phosphate buffered saline/Matrigel (Corning) were then injected into the left basal ganglia (3.1 mm lateral to the bregma, depth 6.5 mm). Xenografts were implanted into the caudate in lieu of the cerebellum because DSC and dynamic contrast enhanced (DCE) MRI have not been fully characterized in the rodent posterior fossa and to maximize potential differences in OS. Animals were followed for survival and were euthanized when they either demonstrated severe neurological signs such as hemiparesis or seizures or lost >15% body weight.
MRI Acquisition
MR images were collected using a Bruker 7.0T MRI scanner with a 72 mm quadrature volume coil. The scanner was operated using Paravision 5.1 software (Bruker Biospin). Animals were anesthetized using 1.5% isoflurane with 40% oxygen and 60% nitrogen. The animals’ core body temperatures were maintained at 37°C ± 0.5°C by a circulating water bath, and respiratory rates were maintained at 50–70 respirations per second. MRI acquisition parameters are listed in Supplementary Table 1. For DSC MRI, after 30 s baseline acquisition, a 60 μL bolus of undiluted ferumoxytol (AMAG Pharmaceuticals) was injected at the rate of 3 mL/min, followed by a 500 μL saline flush at the same injection rate (total scan time = 3 m 58 s). For DCE MRI, after 40 s baseline acquisition, 60 μL (31.74 mg) gadobenate dimeglumine (MultiHance, Bracco) was injected at the rate of 3 mL/min through the tail vein catheter followed by 500 μL flush (total scan time = 3 m 58 s). DSC and DCE MRI slices were centered at the largest T2-weighted tumor area. SW images were reconstructed using Paravison 5.1.
Image Post Processing
All images were reviewed by a single author (E.M.T.), who was blinded to xenograft type. The IBNeuro (Imaging Biometrics) plugin for Horos (v2.0.0) was used to determine relative cerebral blood volume (rCBV) and relative cerebral blood flow (rCBF). Arterial input function was calculated using the multiple point automated feature of IBNeuro. Tumors were not included in the analysis unless the maximum area was >7.5 mm2. The tumor region of interest was compared with the contralateral normal gray matter. The CBVmax and CBFmax are reported in this work because reporting the area of maximum provides the highest interobserver reproducibility28 and is arguably the most clinically relevant.29,30 The DCE tool (Kyung Sung) plugin for OsiriX (v.7.0.4) was used to determine the transfer coefficient (Ktrans) and extravascular extracelluar volume fraction (ve), both markers of vessel permeability.
Intracranial Xenograft Protein Expression
At the time of euthanasia, animals underwent intracardiac perfusion of heparinized saline, brains were snap frozen in 2-methylbutane, and cryostat sectioned at 9 µm. Histologic specimens were prepared as previously described.31 Briefly, to identify vessels, immunofluorescence was performed using rabbit anti–zonula occludens 1 (Life Technologies) at 1:200 dilution for 24 hours, then incubated with fluorescent antibody (Life Technologies) for 60 minutes. Three images of each tumor were taken on an Axio Observer at 10x. Individual vessels were manually counted and blinded to xenograft type.
For enzyme-linked immunosorbent assay of rat VEGFA, frozen tumor was sharply excised from the rat brain. Tumor protein was harvested in lysis buffer: 20 mM HEPES, 2 mM MgCl2, 1 mM EDTA and EGTA, 150 mM NaCl, 1% Triton X-100, 0.1% sodium dodecyl sulfate, and protease inhibitors. After centrifugation at 16000 × g for 10 min, tumor protein extract was snap frozen and stored at −80°C. Upon thawing, 100 μg total tumor protein was loaded onto each well (performed in duplicate) in a rat hypoxia panel 96-well plate (catalog: N45123B-1, Meso Scale Diagnostics) and analyzed following manufacturer’s protocol.
MR Imaging of Humans with Group 3 Medulloblastoma
Retrospective data collection was approved by the Stanford University/Lucile Packard Children’s Hospital institutional review board. Molecular subgrouping of human tumors was completed using NanoString limited gene expression profiling, as previously described.22 The patients underwent brain MRI at either 1.5T (Signa, GE Medical Systems) or 3.0T (Discovery MR750, GE Medical Systems). As part of routine brain tumor protocol, standard axial 2D GRE planar imaging was performed using the following parameters: on 1.5T MRI, 500/30 (repetition time [TR] ms/echo time [TE] ms), 22-cm field of view (FOV), 288 × 192 matrix, 15-degree flip angle, 5-mm section thickness, and 1.5-mm skip; on 3.0T MRI, 600/15 (TR/TE), 22-cm FOV (phase FOV 0.75), 384 × 224 matrix, 20-degree flip angle, 4-mm section thickness, and 0.5-mm skip.
Statistical Analysis
Patient data were analyzed using R2 (http://r2.amc.nl). Preclinical statistical analysis was performed using GraphPad Prism 6. An ANOVA with Tukey multiple comparisons was used to compare vessel density, VEGFA rat protein expression, rCBV, rCBF, Ktrans, and ve among xenografts. Log-rank Mantel–Cox proportions were used for survival.
Results
VEGFA Expression Is Elevated in Group 3 Medulloblastoma
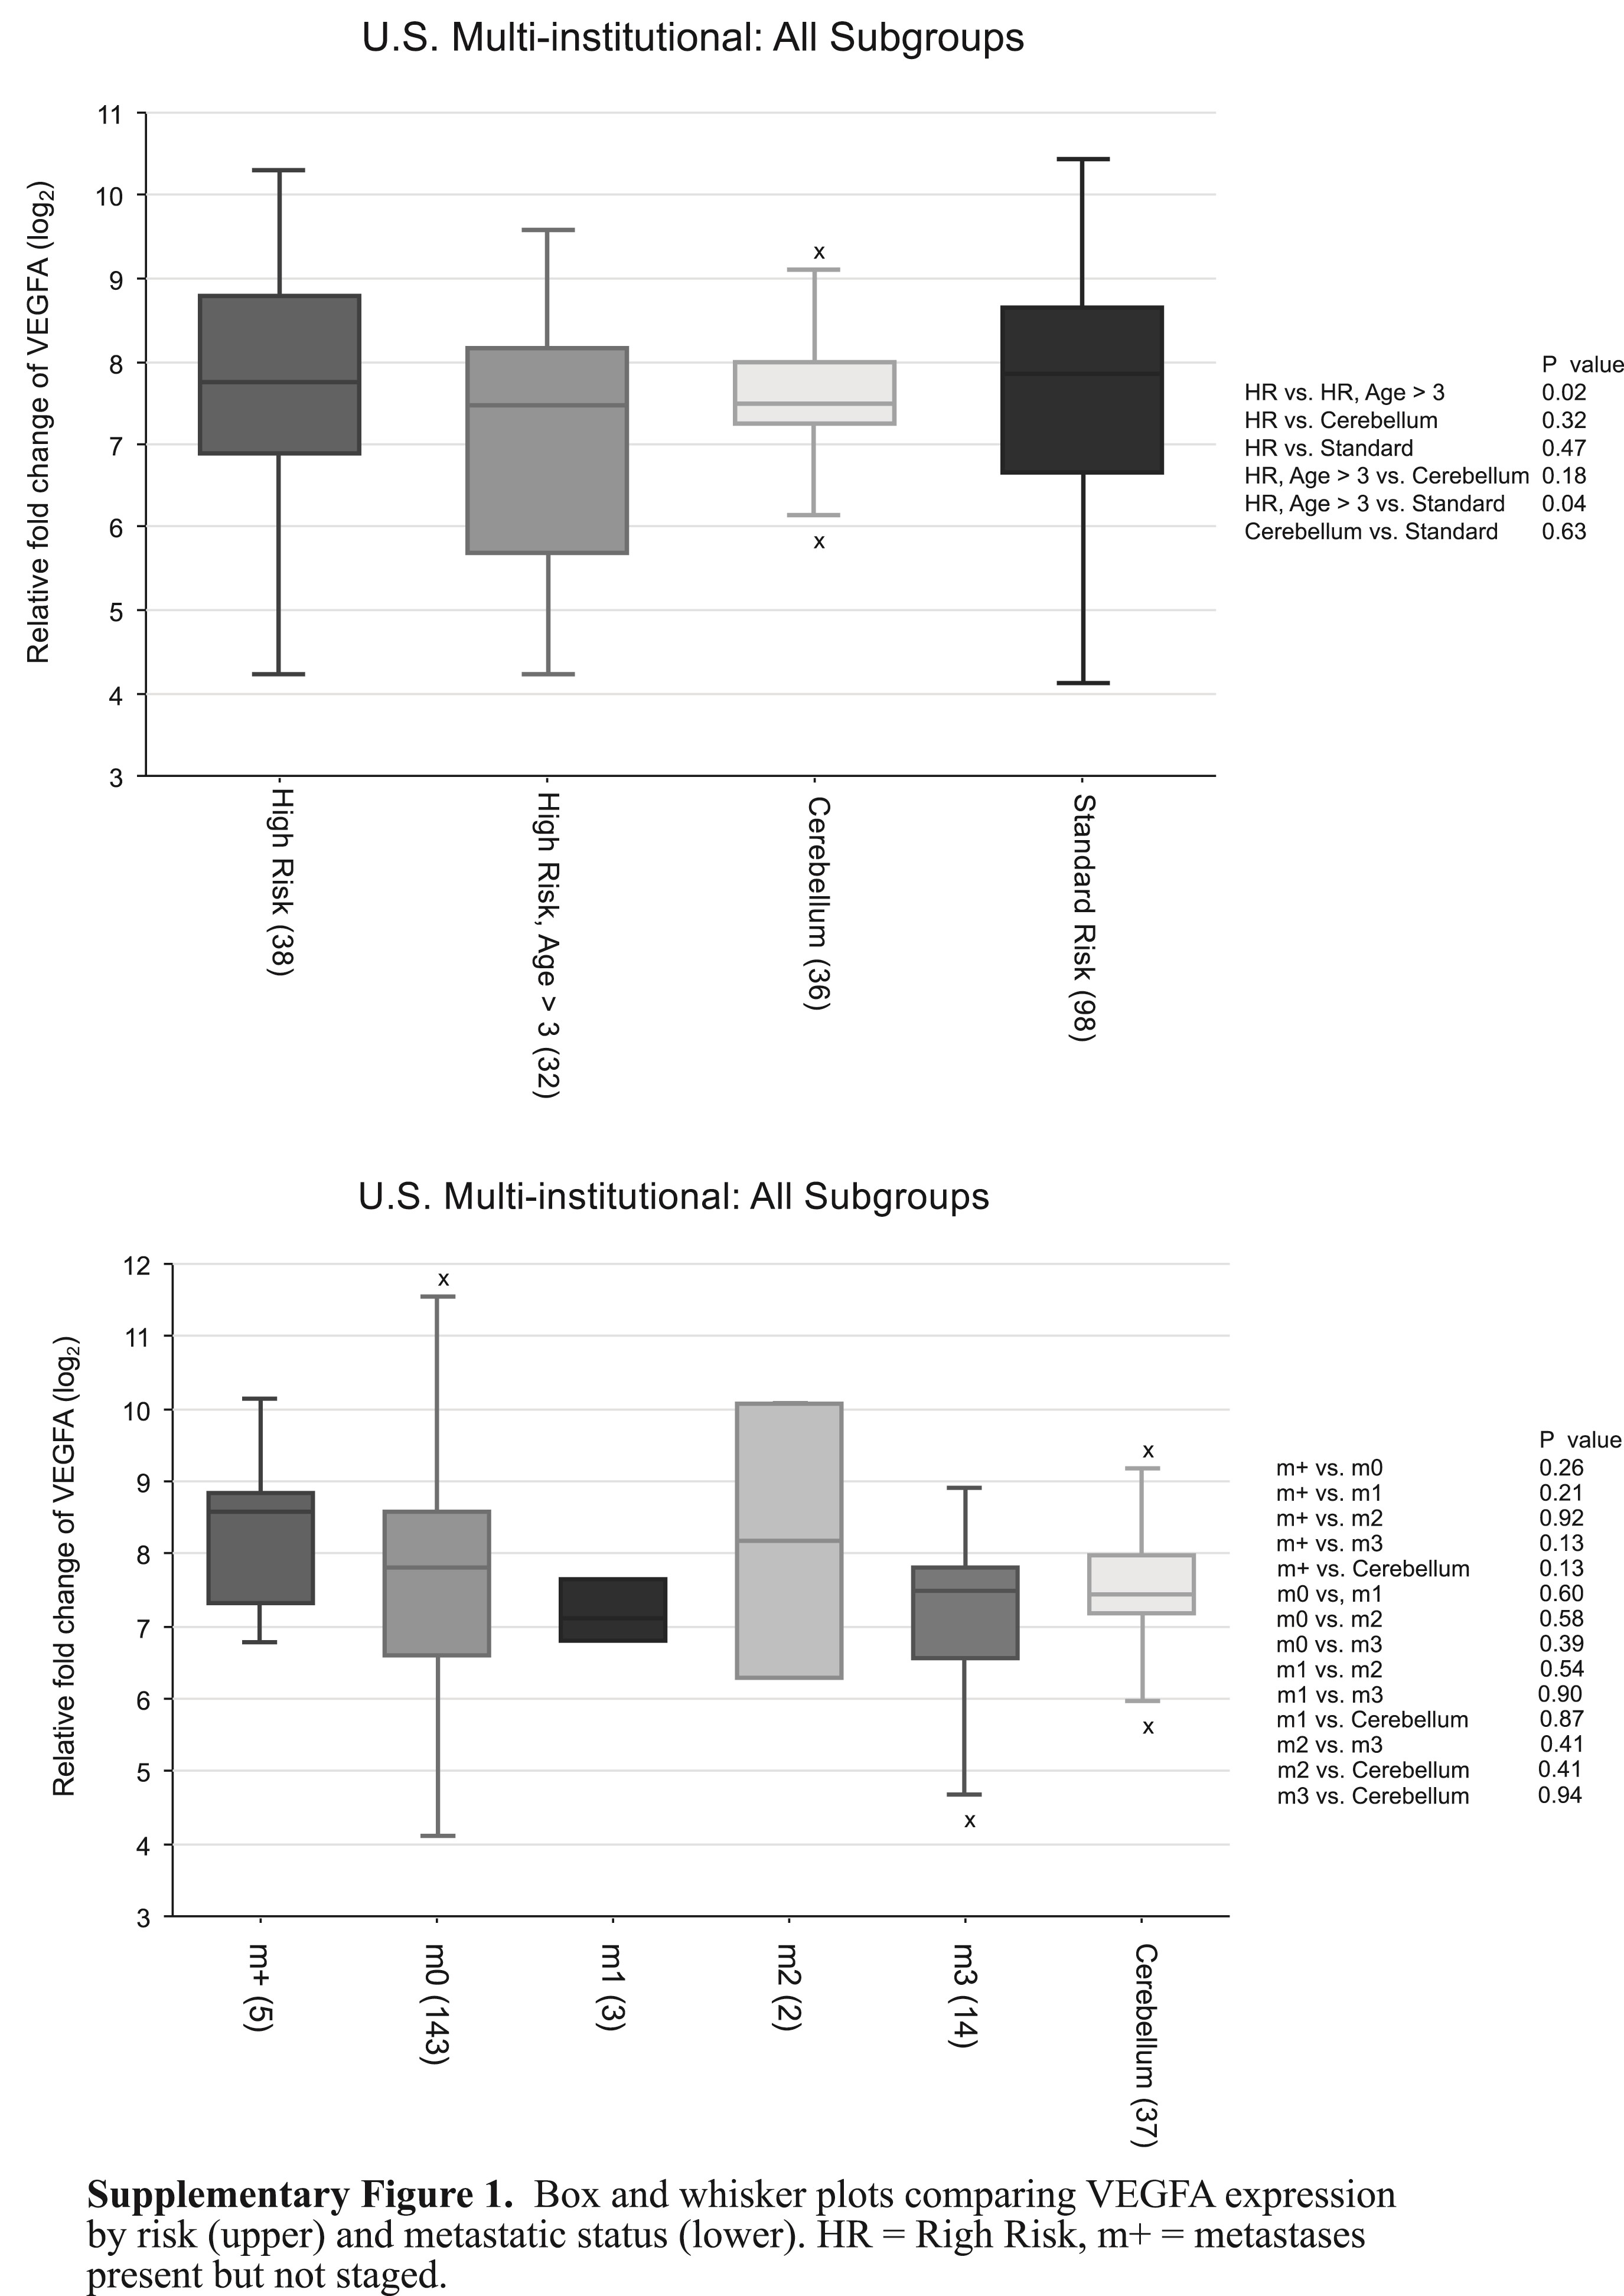
Patient VEGFA mRNA expression analysis from 3 independent cohorts confirmed elevated levels of VEGFA mRNA in Group 3 compared with all other groups (P < 0.001) (Fig. 1A). Likewise, VEGFA mRNA expression and survival from 2 independent cohorts of all subgroups demonstrated a survival advantage in patients with “low” expression compared with “high” expression (Fig. 1B). A similar survival advantage was found when only Group 3 patients were analyzed (Fig. 1B). We therefore elected to focus on Group 3 for the validation of MRI biomarkers of vascularity and survival and to elucidate putative genetic drivers of angiogenesis. Of note, we found no clear associations between VEGFA expression and potentially confounding “high risk” variables (M+, age <3 y, >1.5 cm2 residual tumor) associated with poor prognosis.20 There was also no clear association with VEGFA expression and Chang metastatic stage20,32 (Supplementary Figure 1).
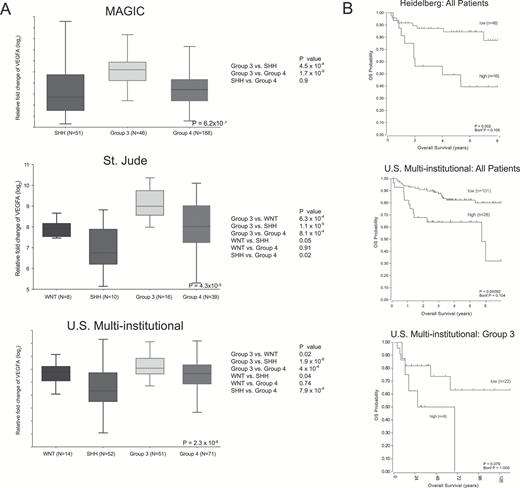
VEGF expression is elevated in patients with Group 3 medulloblastoma and is associated with survival. (A) Box and whisker plots from 3 independent cohorts all demonstrating significantly elevated VEGFA mRNA expression in Group 3 medulloblastoma compared with the other 3 subgroups. Top plot from the Medulloblastoma Advanced Genomics International Consortium (MAGIC),18 middle plot from St Jude Children’s Research Hospital,19 and lower plot from multiple US institutions20 (middle line = median, box = upper and lower quartiles). “Relative fold change” is relative to background mRNA expression. (B) Kaplan–Meier survival curves of patients in 2 independent cohorts comparing all patients with “high” versus “low” VEGFA mRNA expression. Top curve from Heidelberg,12 bottom 2 curves from the same cohort of multiple US institutions.20 Upper P-value is derived from log-rank test. Lower “Bonf P” is Bonferroni P-value corrected for multiple comparisons used to determine cut points of “high” versus “low” VEGFA expression.
DSC MRI Is a Biomarker for Vascularity and Survival
Gene expression profiling was completed on D283, D341, D425, D487, D556, D690, and D781 xenografts. D283, D341, and D425 are known to have MYC amplifications.23 Hierarchical clustering (Fig. 2) combined with these data suggests that D425, D341, and D283 xenografts are Group 3 medulloblastomas and were thus selected for in vivo vascularity analysis.
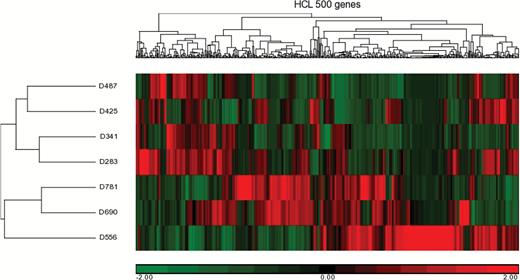
Hierarchical clustering (HCL) of gene expression from 500 genes of the 7 patient-derived xenografts analyzed.
Seven animals had D283 intracranial tumor implantations, 6 had D341, and 6 had D425. Using DSC MRI to assess vascularity, rCBV and rCBF were highest in D425 xenografts (mean ± SD: 5.64 ± 2.76 and 5.79 ± 3.85, respectively), followed by D341 (3.54 ± 1.51 and 3.59 ± 2.05), then D283 (2.58 ± 1.18 and 2.75 ± 1.04). D425 tumors were significantly more vascular compared with D283 tumors as determined by both rCBV and rCBF (P < 0.05) (Fig. 3A–C). Survival among the 3 xenografts was significantly different (P = 0.0002). The median survival of the D283 group was the longest at 47 days, followed by D341 at 18.5 days, and D425 at 15 days (Fig. 3D). Length of survival appeared inversely related to rCBV and rCBF. We conclude that DSC MRI is a rational biomarker to predict the tumor vascularity in Group 3 medulloblastoma, and this vascularity is associated with survival.
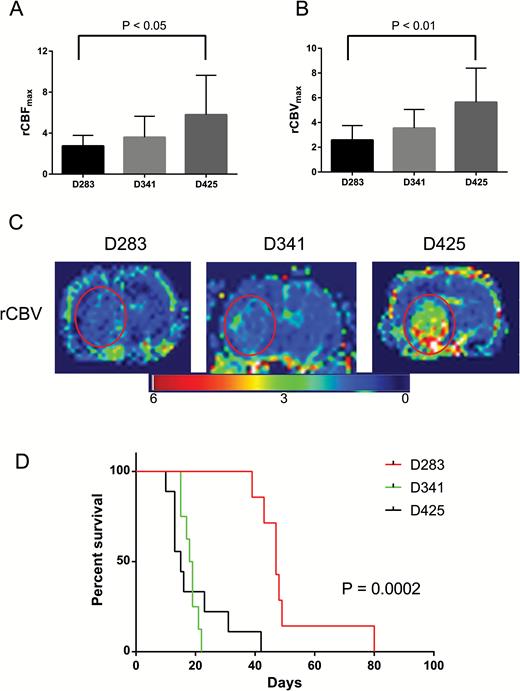
Group 3 medulloblastoma vascularity as determined by DSC MRI corresponds to survival. D425 tumors had significantly elevated vascularity as determined by both (A) rCBF and (B) rCBV compared with D283 tumors. Columns are mean values and error bars are standard deviation. (C) Parametric rCBV maps of representative animals from each xenograft cohort demonstrating tumor size and location (red circle). (D) Kaplan–Meier survival curve comparing the 3 xenograft groups.
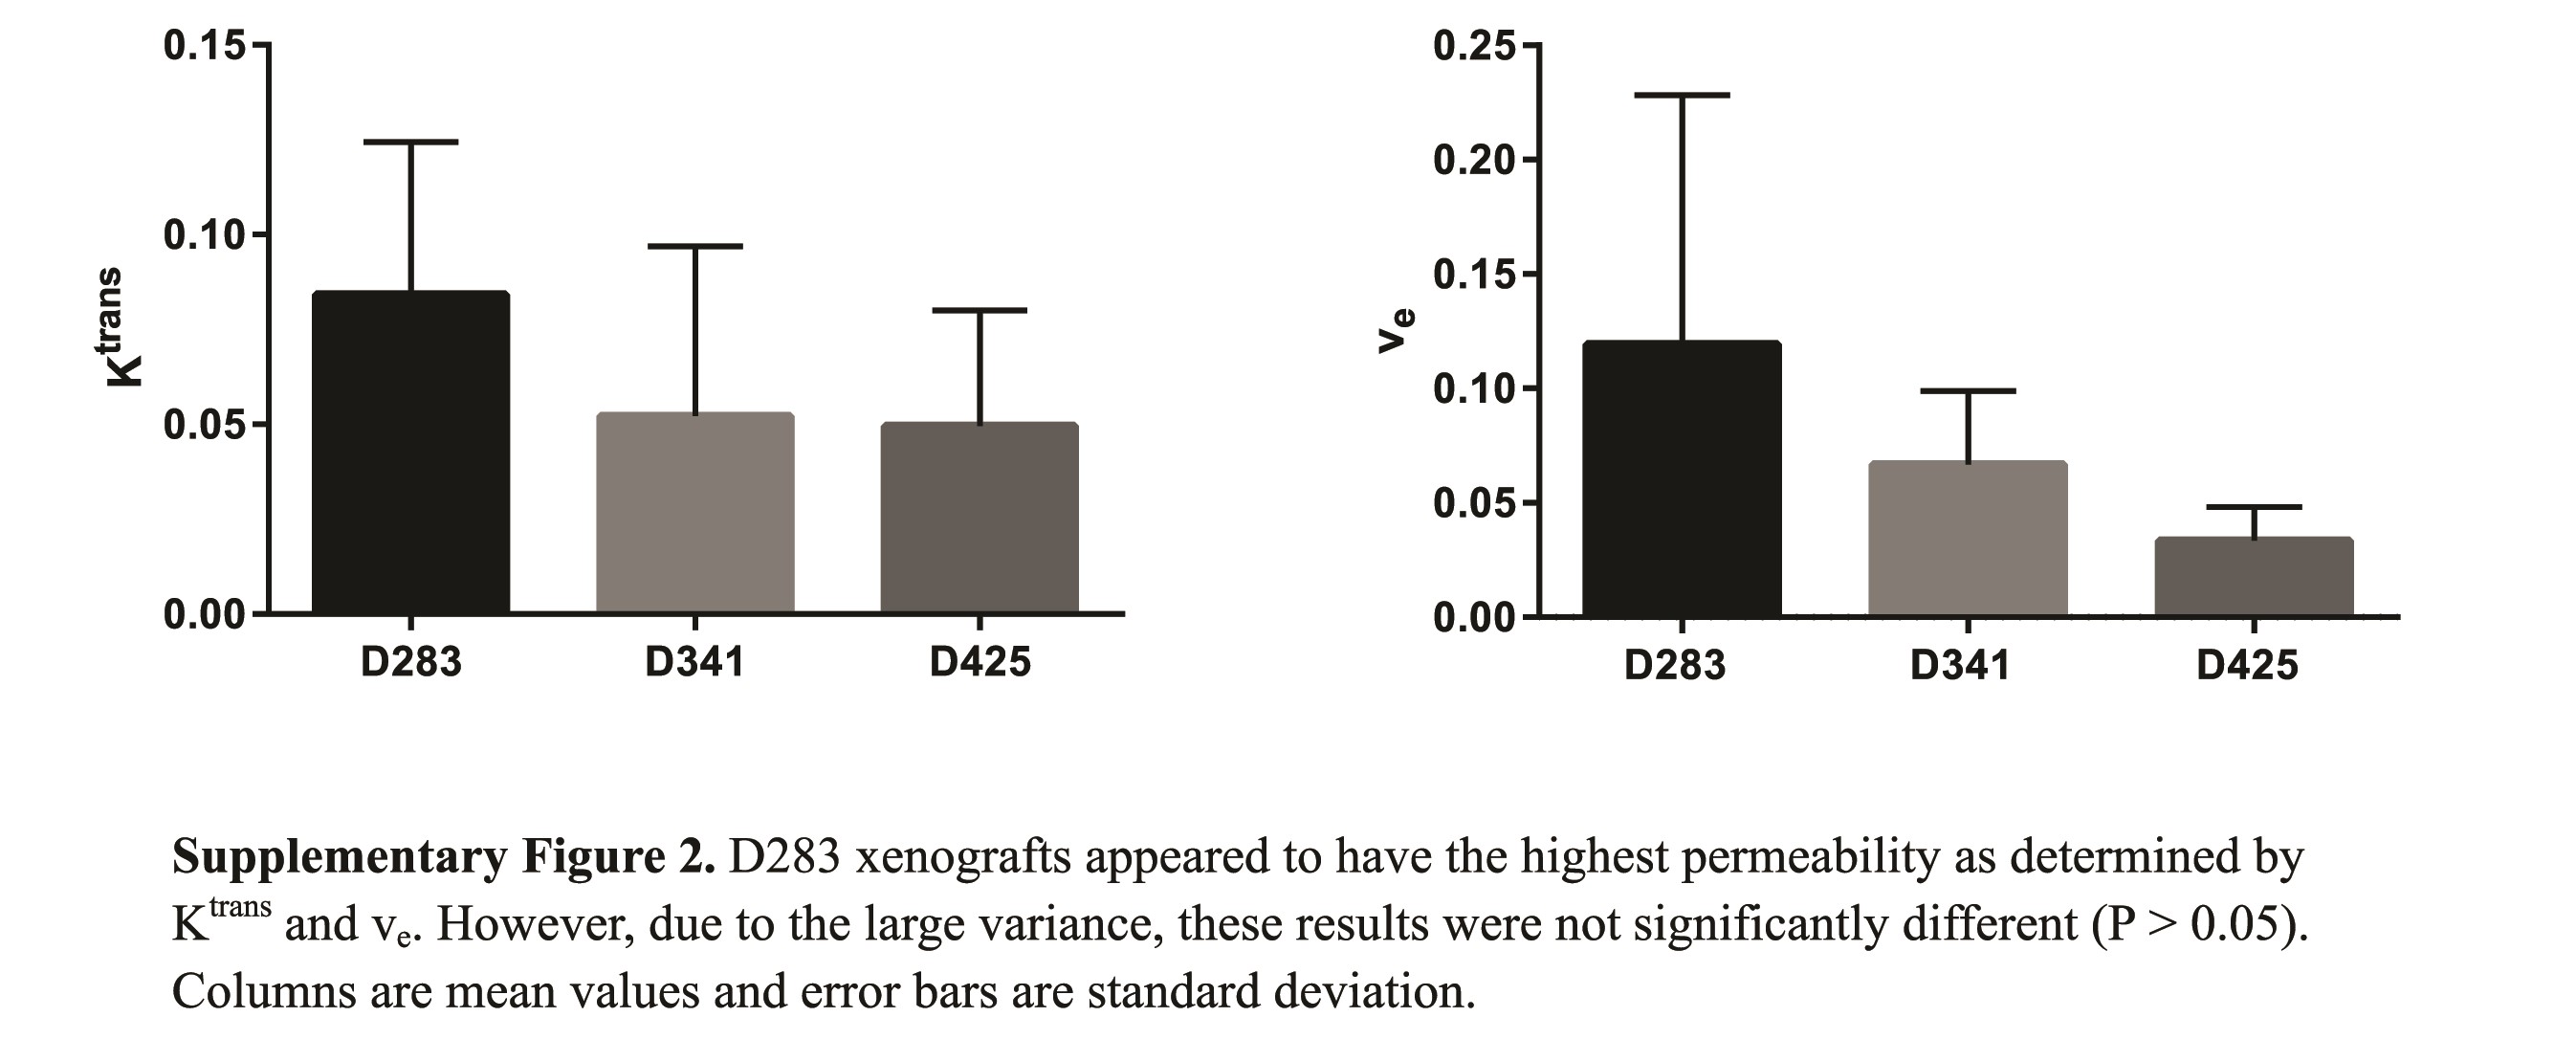
Elevated rCBF and rCBV levels by DSC MRI also corresponded to increased histological tumor vessel density in Group 3 xenografts. The D283 cohort had significantly less vessel density than both D341 and D425 (P < 0.05) (Fig. 4A). Intratumoral rat VEGFA expression was also assessed. Expression was significantly higher in D425 animals compared with D283 animals (P < 0.05) (Fig. 4B). Together, these histologic data and VEGFA expression further support our hypothesis that angiogenesis plays a key role in the aggressiveness of Group 3 medulloblastoma. Of note, we did not find an association between brain tumor vessel permeability assessed by DCE MRI (Ktrans and ve) and xenograft group (Supplementary Table 2, Supplementary Figure 2). Thus, the clinical relevance of DCE MRI as a biomarker to compare different tumor groups remains nebulous.
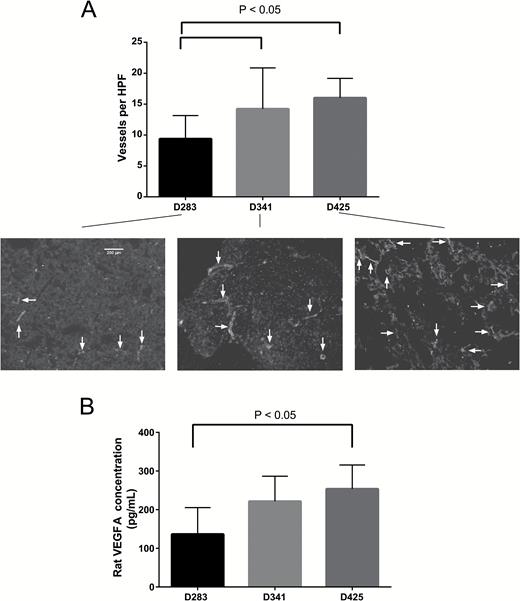
Vessel density and rat VEGFA protein expression correspond with rCBV, rCBF, and survival. (A) D283 tumors had significantly less vessel density compared with both D341 and D425 tumors. Arrows indicate vessels. HPF is high power field. (B) Enzyme-linked immunosorbent assay of rat brain VEGFA expression demonstrates a significant increase in D425 tumors compared with D281 tumors. Columns are mean values and error bars are standard deviation.
Next, we sought to use these in vivo data to identify potential key drivers of angiogenesis in Group 3 medulloblastoma. A GSEA for 48 key genes involved in angiogenesis was performed to compare the 3 xenografts. Five genes were found with relative expression (low in D283, intermediate in D341, and high in D425) that correlated to our DSC MRI, histology, VEGFA expression, and survival findings: RNH1, SCG2, VEGFA, AGGF1, and PROK2 (Fig. 5). A brief description of each gene can be found in Supplementary Table 3. Non–Group 3 xenografts demonstrated elevated expression of select, but largely non-overlapping, genes involved in angiogenesis (Supplementary Figure 3).
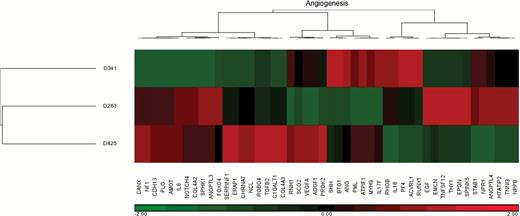
Hierarchical clustering of gene expression from 48 key angiogenesis genes of the 3 patient-derived xenografts. Relative expression of the genes RNH1, SCG2, VEGFA, AGGF1, and PROK2 among the 3 tumor types correlated with DSC MRI, vessel density, rat VEGFA expression, and OS.
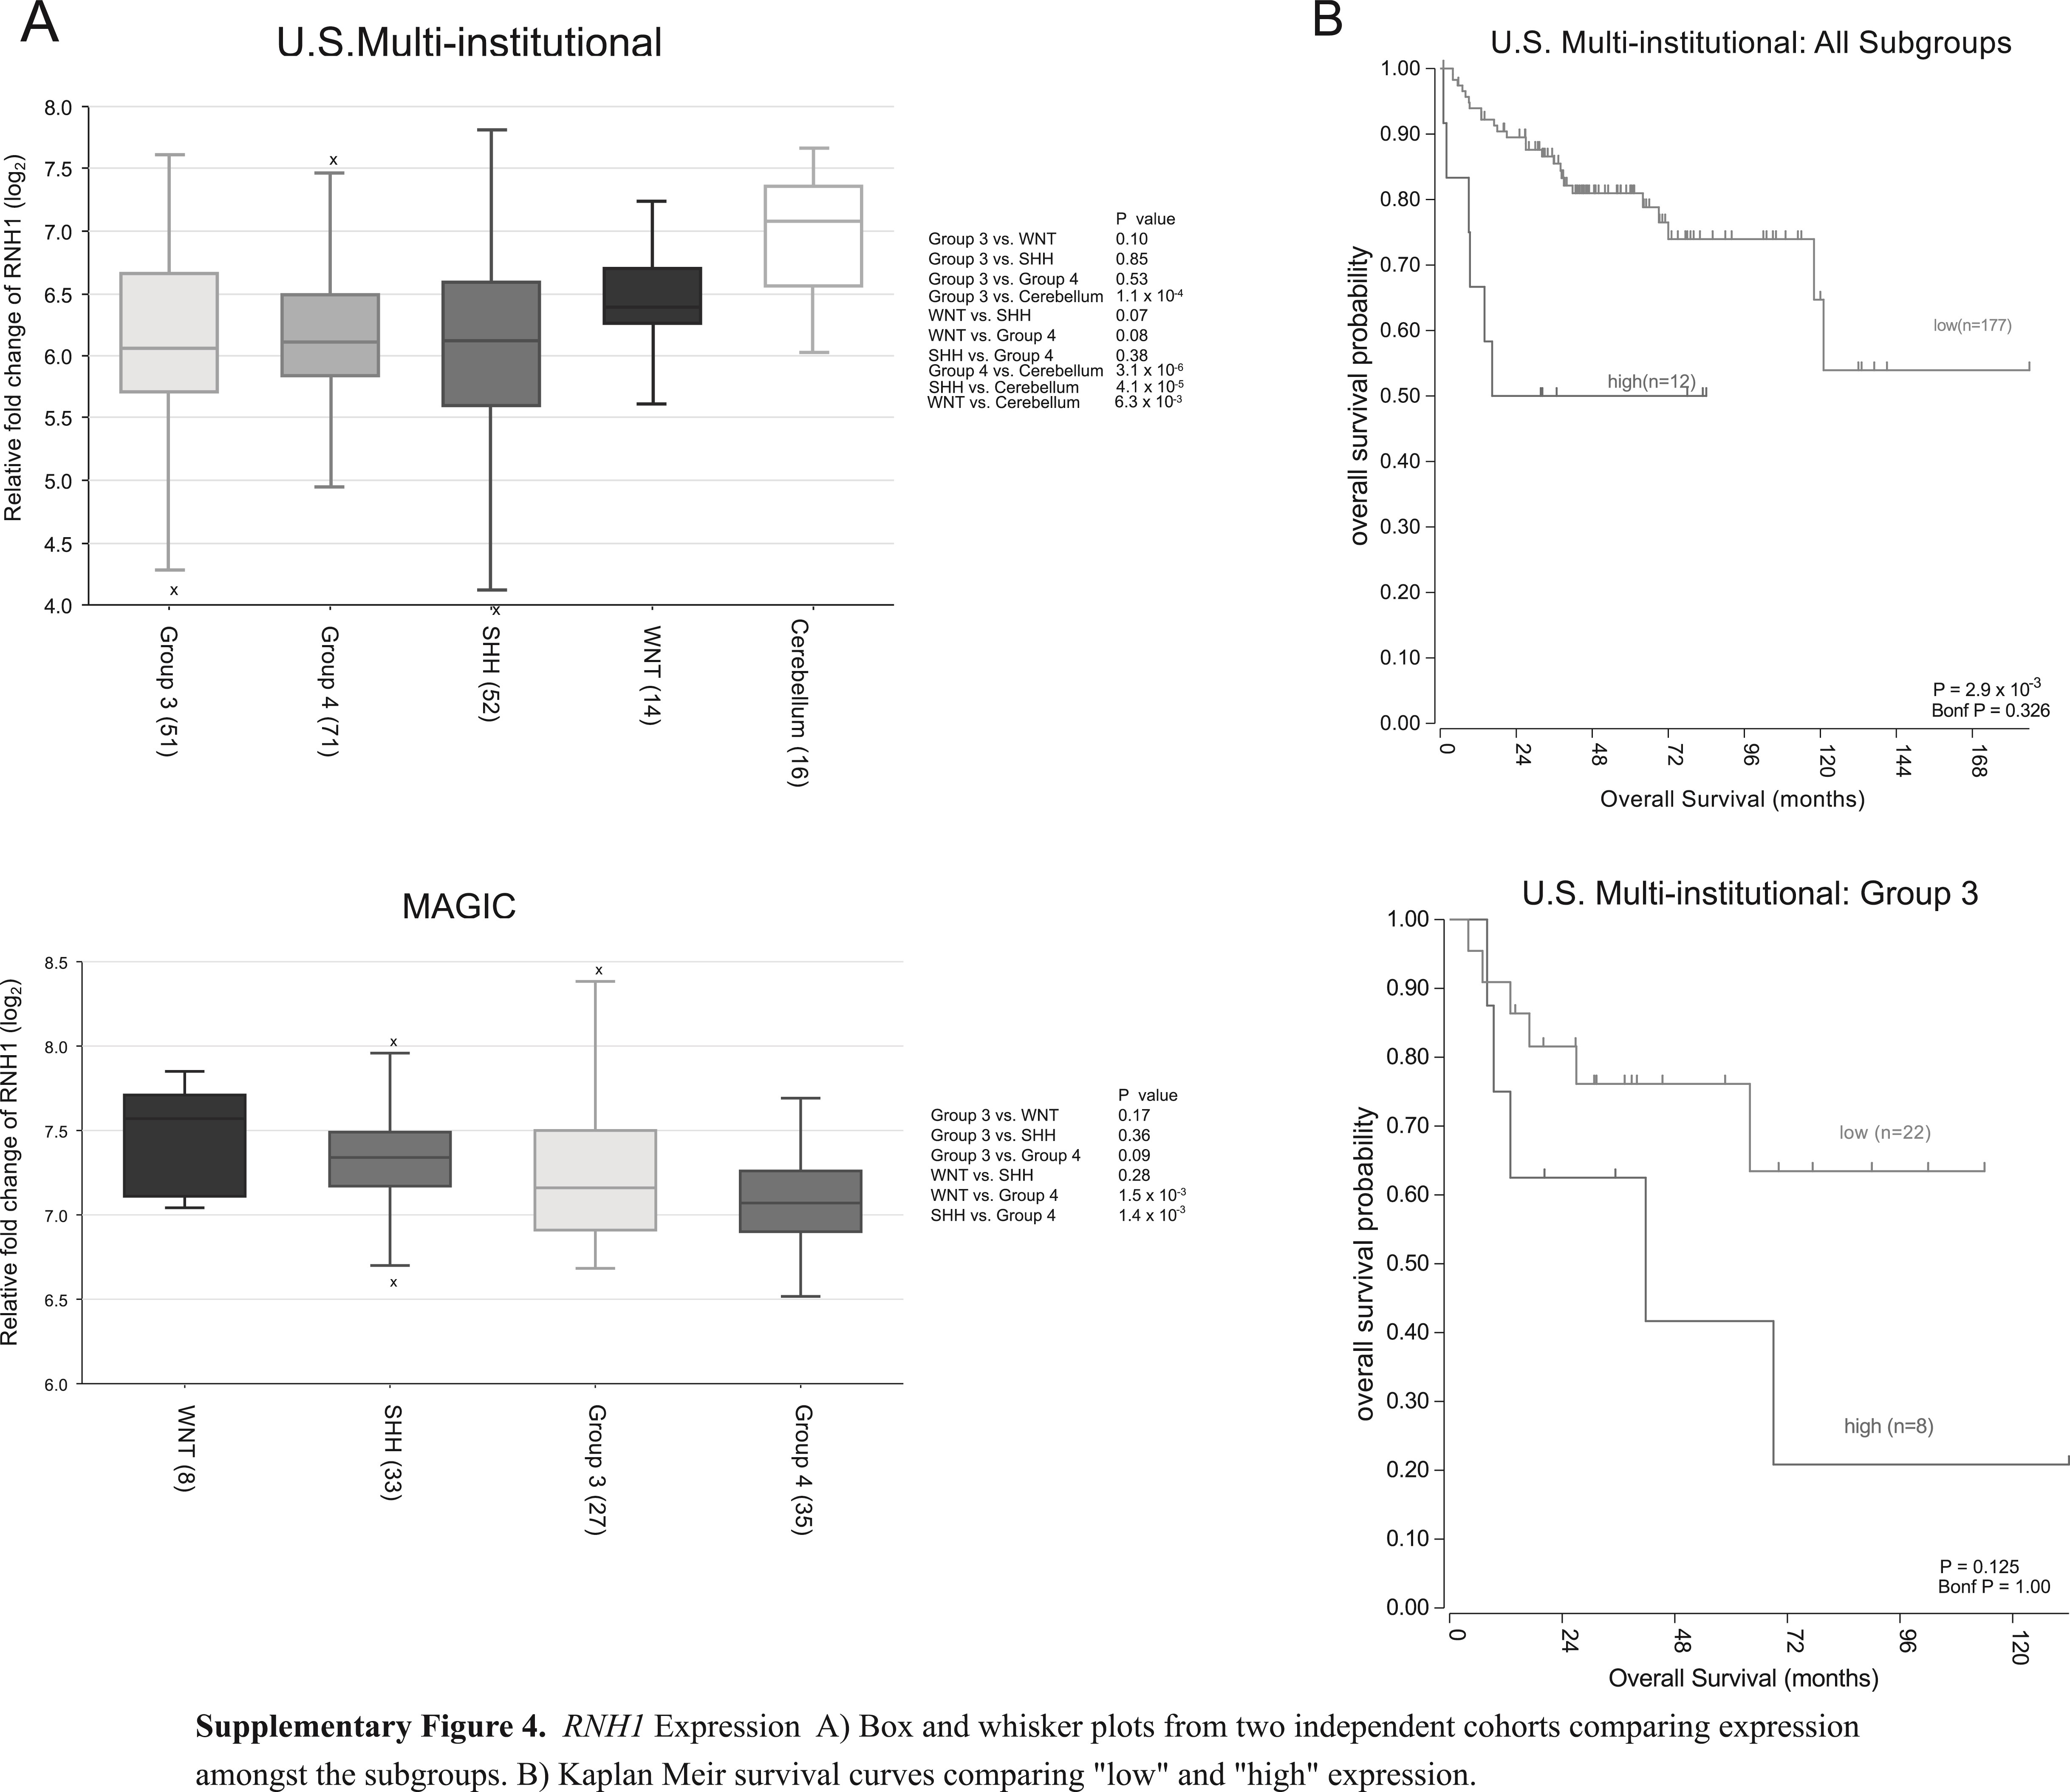
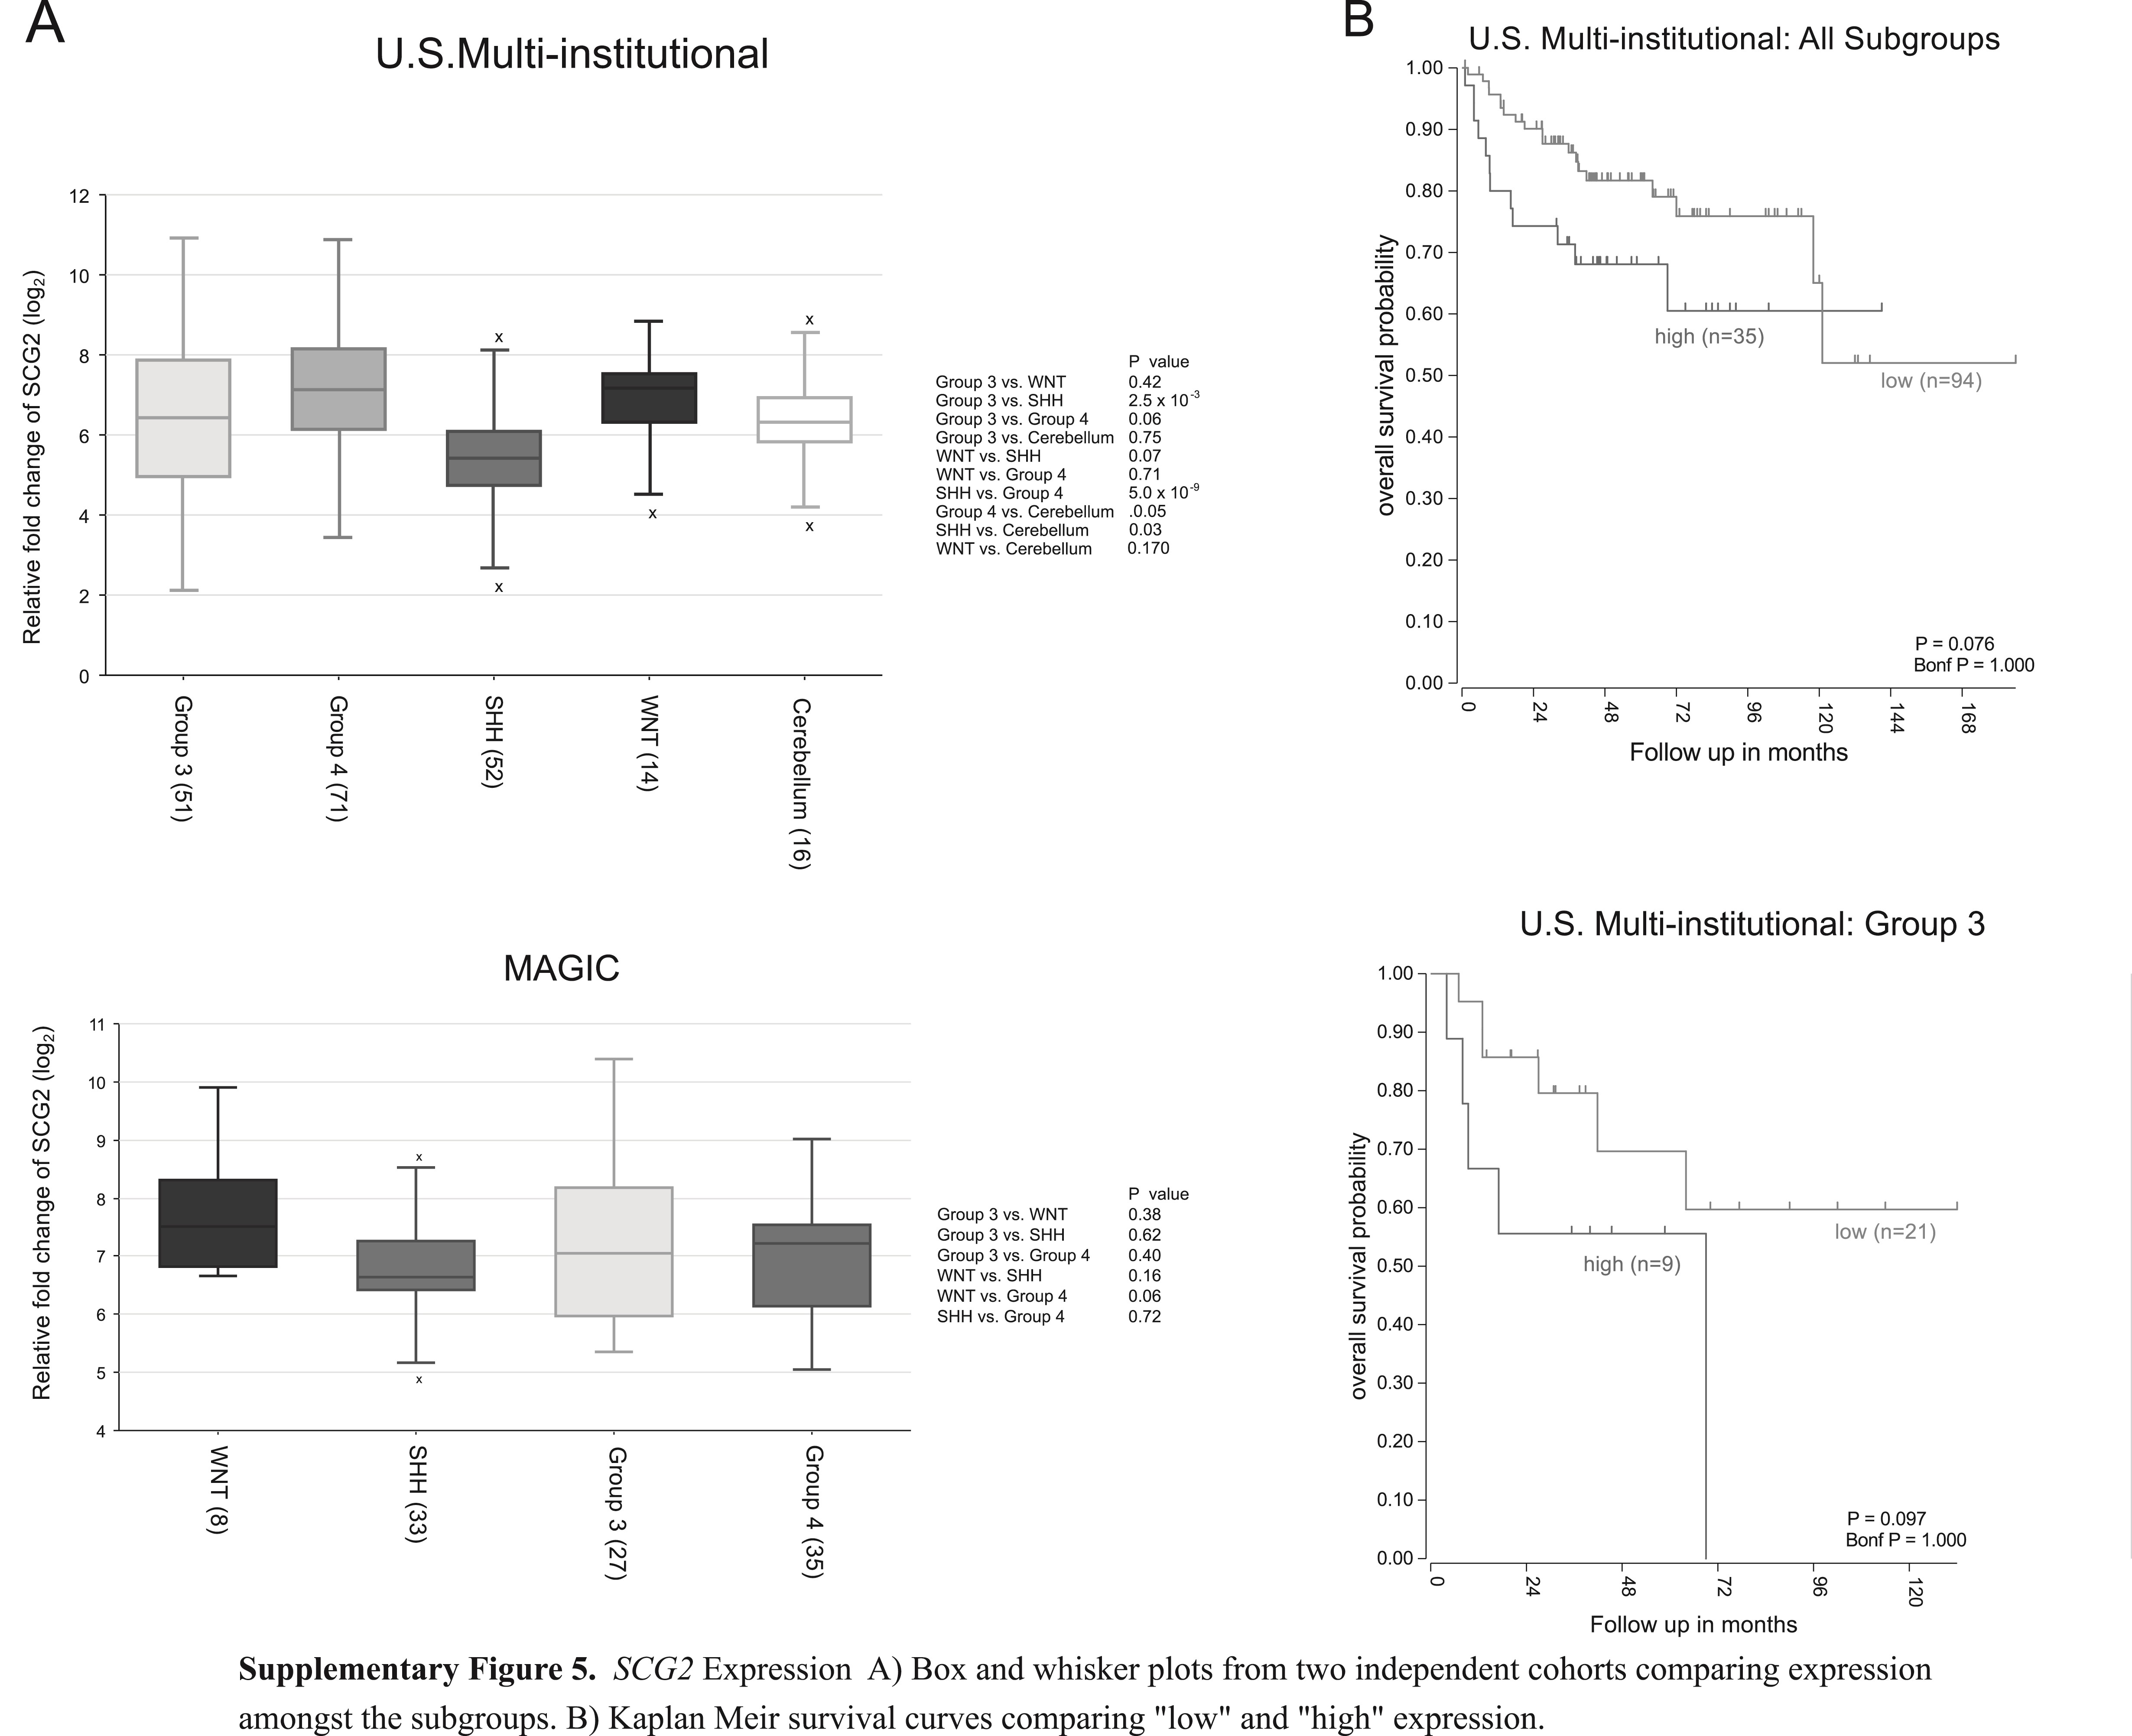
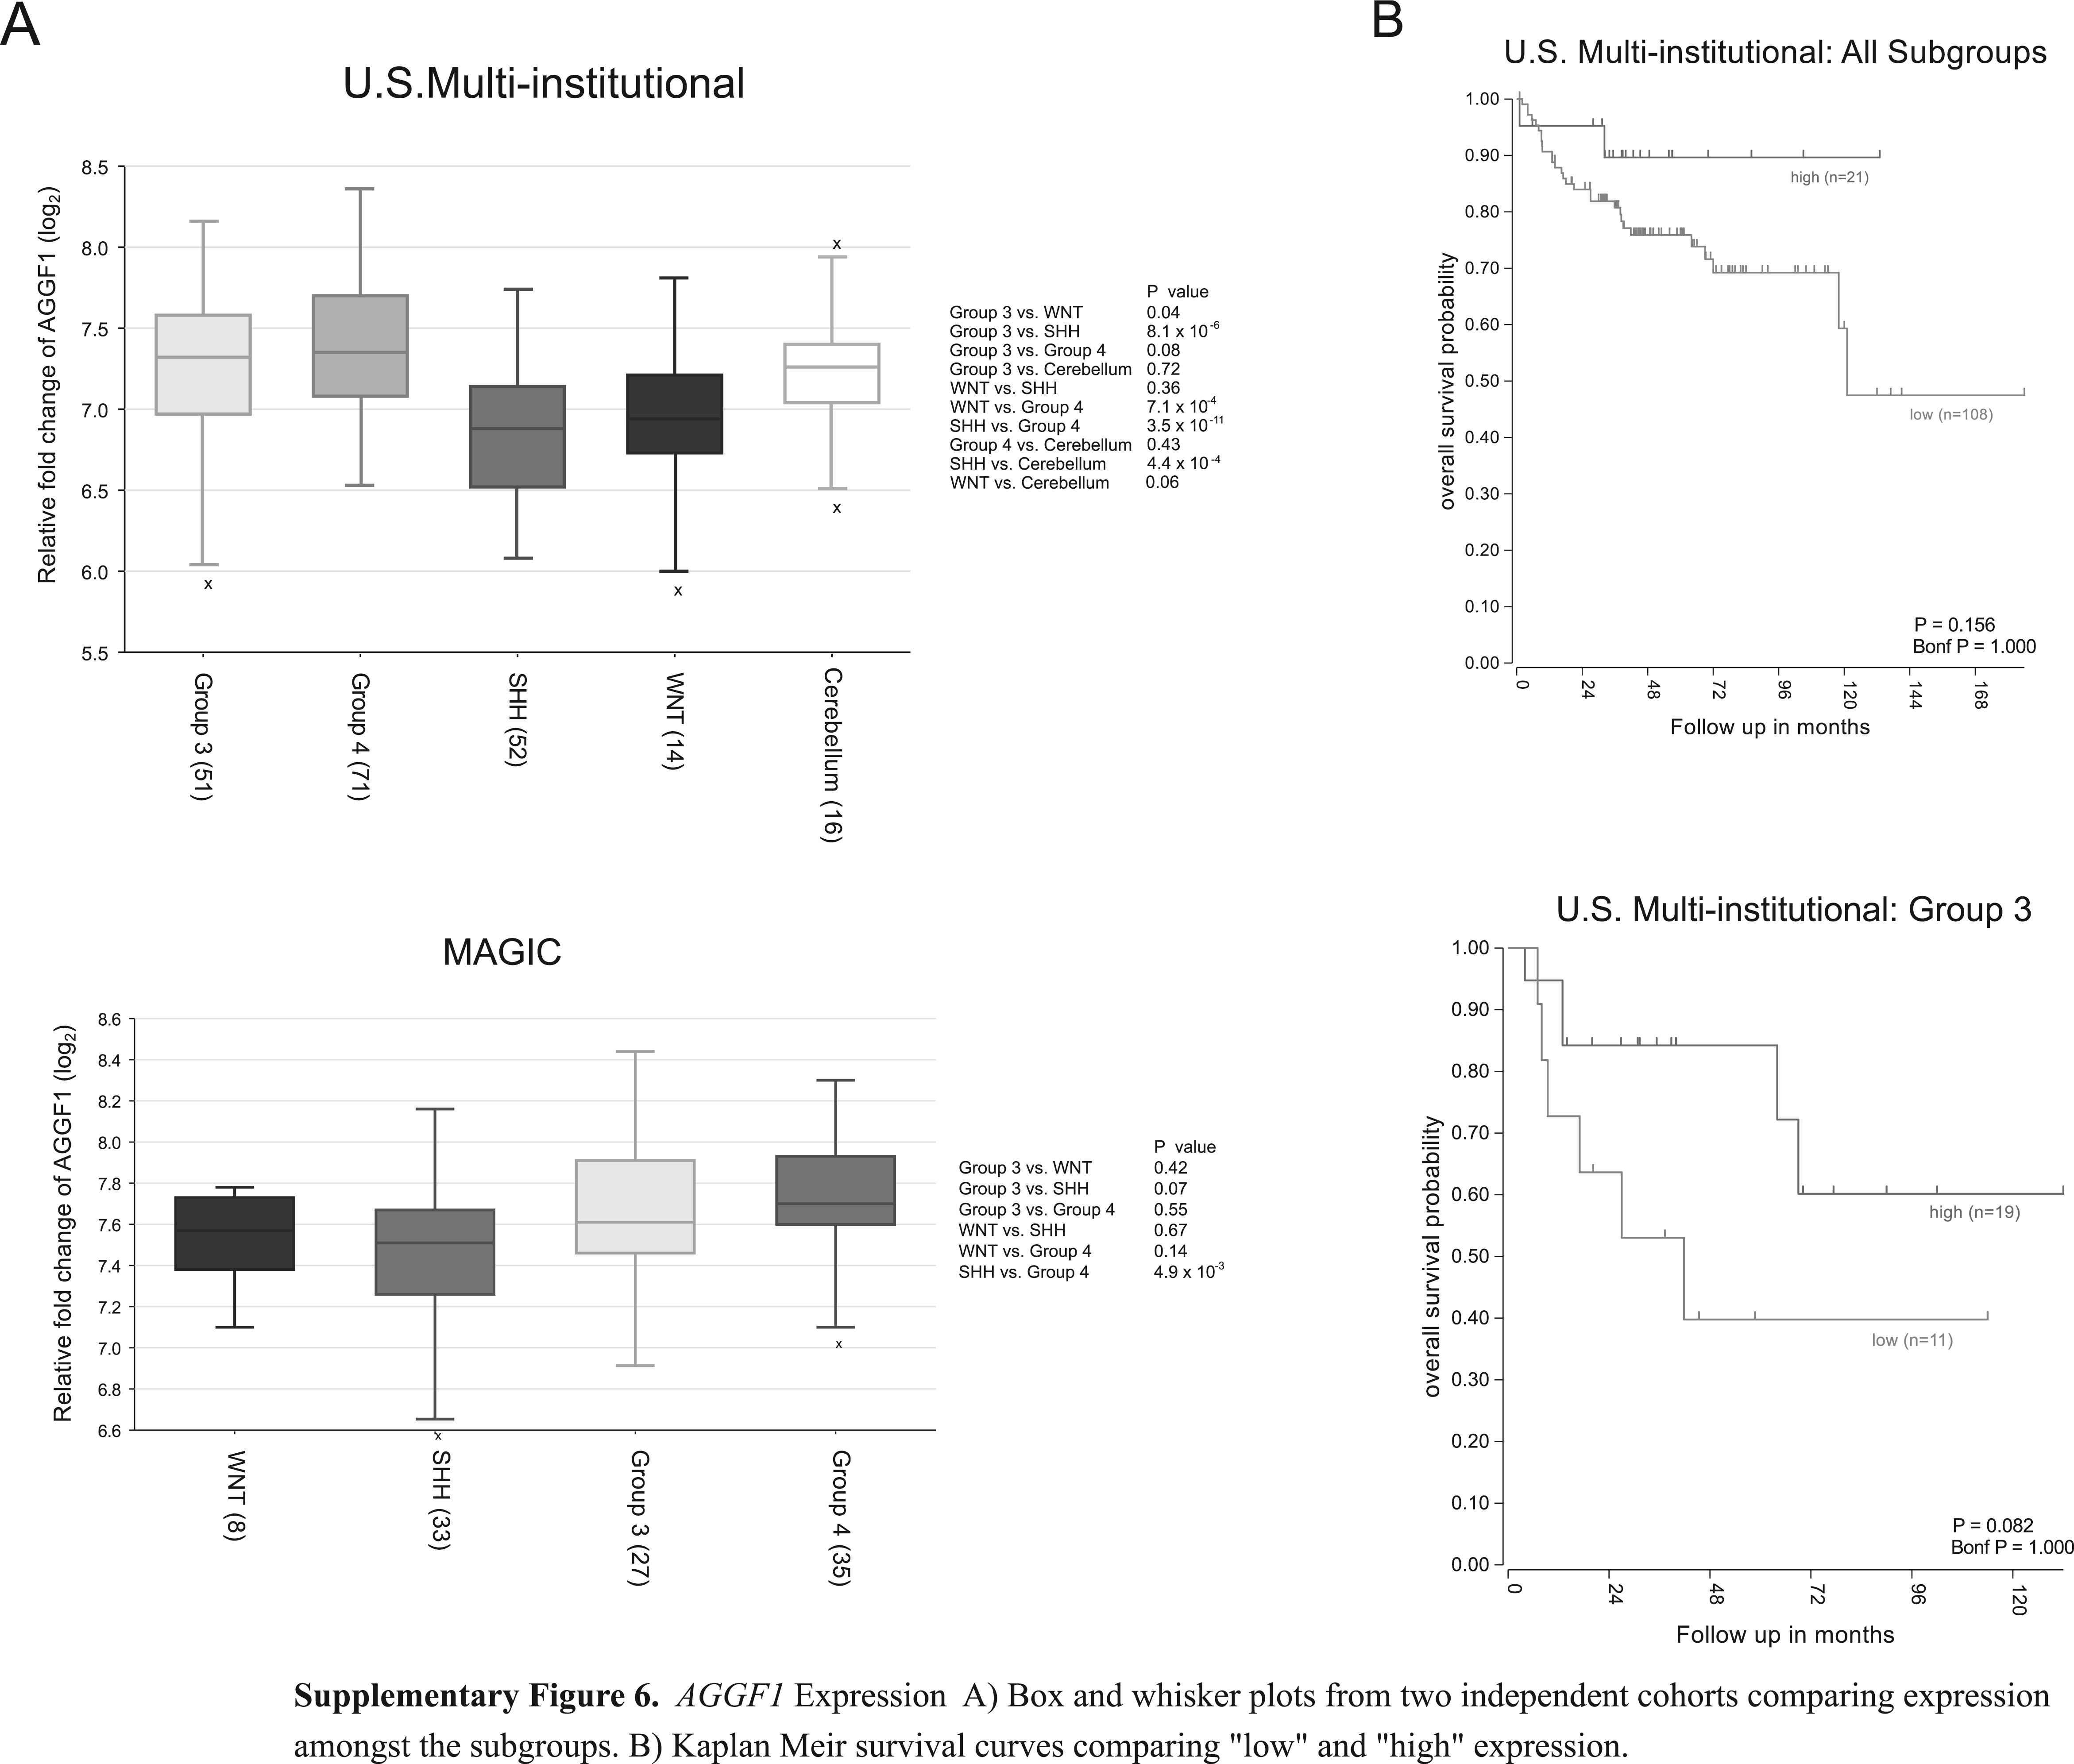
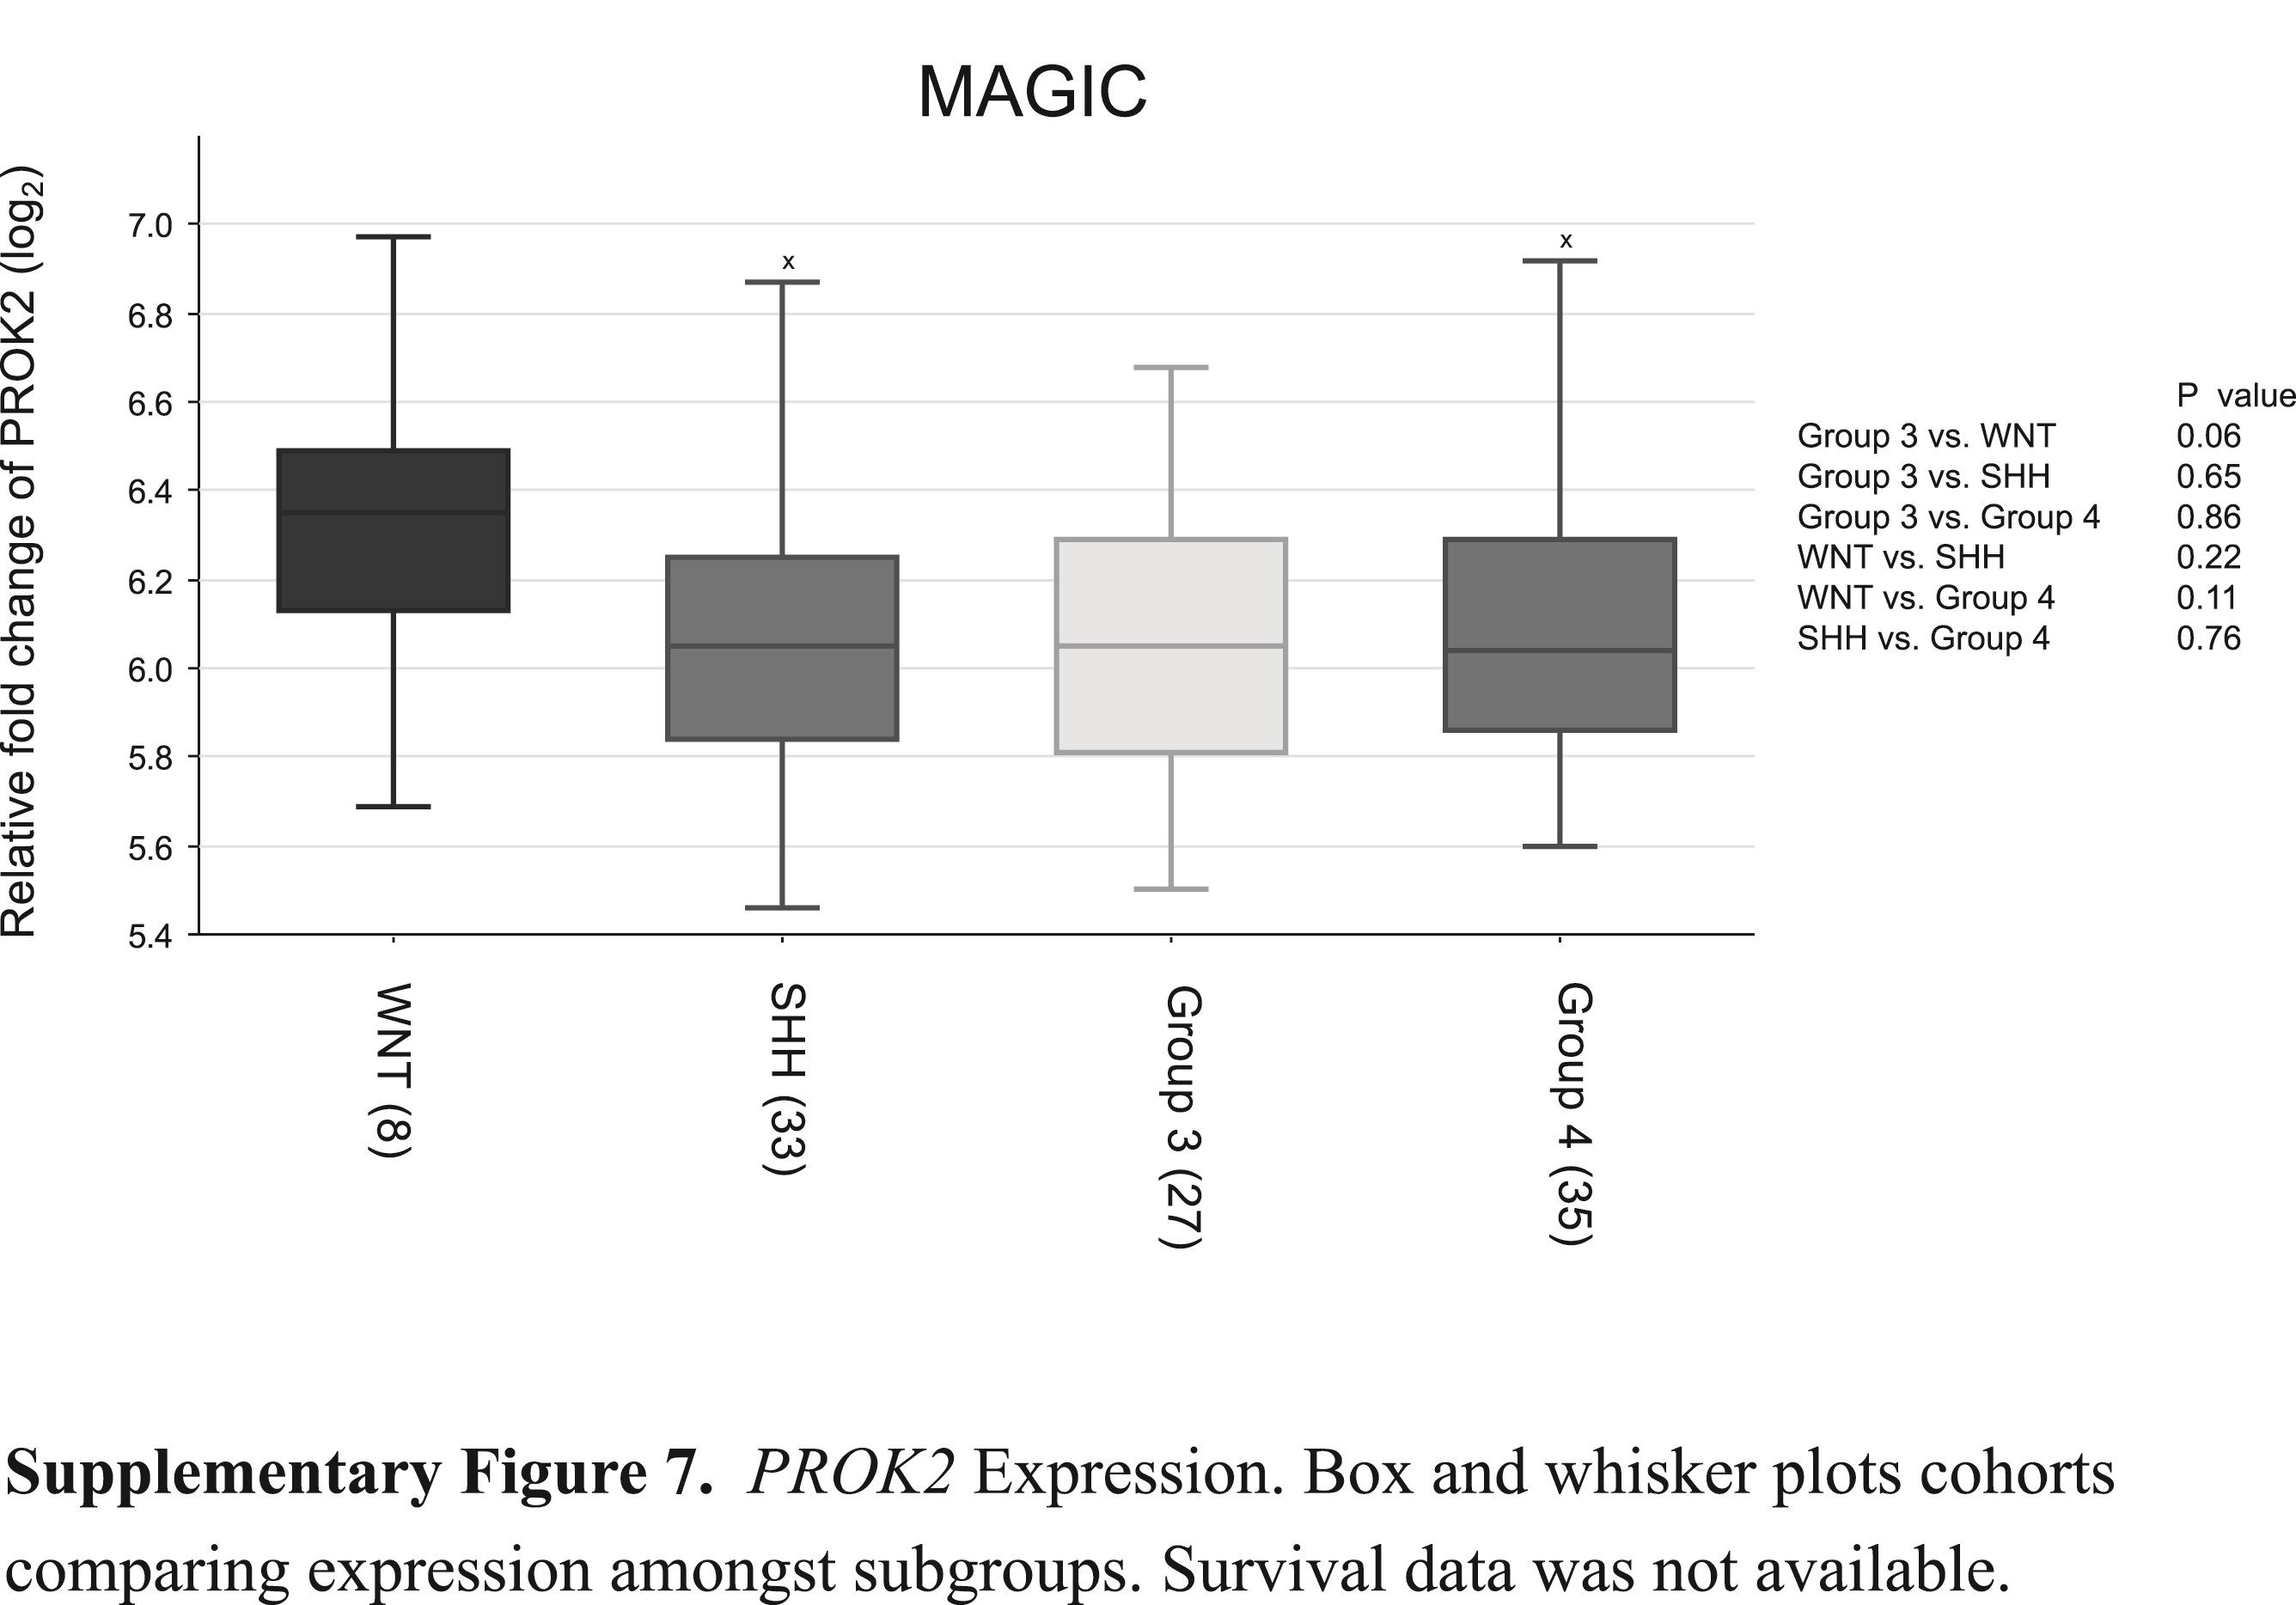
Expression of RNH1, SCG2, AGGF1, and PROK2 was then compared between the subgroups for different patient cohorts to determine their potential clinical significance.18,20 Unlike VEGFA, expression of these genes was not significantly elevated in Group 3 patients (Supplementary Figures 4–7). Survival analysis for all subgroups combined and for Group 3 in isolation demonstrated that increased RNH1 and SCG2 expression and low AGGF1 expression appeared to be associated with decreased survival (Supplementary Figures 4–7).
SW MRI with Ferumoxytol as a Biomarker of Survival
Susceptibility weighted imaging was performed on all animal subjects following administration of ferumoxytol. During review of all SWIs blinded to xenograft type, 3 distinct architectures were noted based on vessel size and pattern of organization. These vascular patterns were categorized as organized, diffuse microvascular (DM), and heterogeneous (Fig. 6A). “Organized” tumors were those with similar size vessels evenly distributed throughout the tumor. “Diffuse microvascular” tumors were those with minimal or no large vessels but with tiny vessels distributed throughout the tumor. “Heterogeneous” tumors were those with a combination of “organized” and “DM” characteristics, often with large vessels located in one area of the tumor. All 5 organized tumors were exclusively found to be D283 (n = 5), DM tumors were both D341 (n = 3) and D425 (n = 3), while heterogeneous tumors had representation from all 3 vascular patterns (D283 n = 2, D341 n = 3, D425 n = 3). When analyzed by SWI category, the median survival of the organized cohort was 47 days, followed by heterogeneous at 22 days, and DM at 16.5 days (Fig. 6B). We conclude that the SWI category is a valid biomarker to predict survival in Group 3 medulloblastoma.
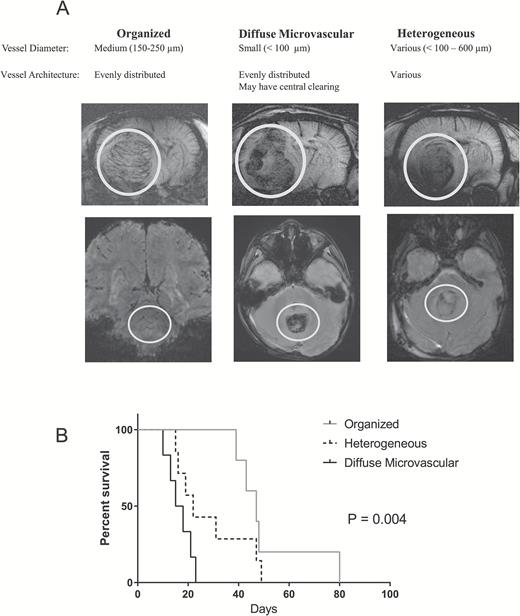
There are 3 categories of MRI vessel patterns in Group 3 medulloblastoma found in both rodent xenograft models and in humans: organized, diffuse microvascular, and heterogeneous. (A) Examples of each category in rodents (top row) as noted on SW MRI using ferumoxytol as an intravascular contrast agent. Examples of each category in patients with Group 3 medulloblastoma (bottom row) as noted on GRE MRI without contrast. White circles highlight tumor. (B) Kaplan–Meier survival curve of intracranial Group 3 xenograft models.
To correlate these preclinical SWI findings with patient data, pre-resection GRE images from 6 Group 3 patients were analyzed to identify whether similar patterns of vascularity were present in humans. Three patient tumors were categorized as organized, 2 as heterogeneous, and 1 as DM (Fig. 6A). The median survival of this group was 3.625 years with only one death in a DM group patient 0.58 years after diagnosis.
Discussion
To our knowledge, we demonstrate for the first time that angiogenesis is a key factor in Group 3 medulloblastoma tumor pathogenesis and survival as demonstrated using both clinical and preclinical data. In several independent cohorts, we found that patient VEGFA mRNA expression was significantly elevated in Group 3 and associated with survival. We also found an excellent association of VEGFA expression induced by our 3 xenografts with tumor vascularity and survival. Interestingly, patient-derived xenograft VEGFA gene expression corresponded with VEGFA protein expression in the rat brain. This suggests that “exogenous” VEGFA induces the production of host VEGFA. Furthermore, of the 5 putative angiogenic genetic drivers found in the study, only VEGFA is currently therapeutically targetable. Additional work is needed to determine (i) whether RNH1, SCG2, AGGF1, and PROK2 can be clinically targeted and (ii) the true clinical significance of these genes in non–Group 3 medulloblastoma.
The widespread use of antivascular agents in recurrent medulloblastoma has been limited due to inconsistent clinical efficacy.33–36 However, patients in those studies were not treated in a subgroup-specific manner. Given the heterogeneity of the pathogenesis of the 4 medulloblastoma subgroups,14,18,37 a “one therapy fits all” treatment paradigm is unlikely to be successful. Indeed, our human data suggest that Group 3 should be the most responsive to anti-VEGFA therapy compared with the other 3 subgroups. We conclude that targeting VEGFA is a rational therapeutic approach for Group 3 medulloblastoma, particularly for those with elevated vascularity on DSC MRI and/or who have DM architecture on SW MRI.
We found that both DSC and SW MRI are valid biomarkers to evaluate Group 3 medulloblastoma vascularity. The use of DSC MRI to evaluate brain tumors has focused mainly on malignant gliomas in adults using gadolinium-based contrast agents (GBCAs).30,38 We previously reported the feasibility of the iron nanoparticle ferumoxytol as a contrast agent for DSC MRI in children with brain tumors, including medulloblastoma.29 The advantages of an iron nanoparticle–based contrast agent for DSC MRI are twofold. Due to their larger size, they do not pass through leaky tumor vessels and therefore provide more accurate rCBV and rCBF values compared with smaller GBCAs that readily leak into tumors.39 Additionally, there is no risk of potential GBCA adverse events such as nephrogenic sclerosing fibrosis.40
Our DCE MRI data did not reveal any clear differences in tumor vasculature permeability between the 3 groups due to a large variance in Ktrans and ve within each group. It is unknown whether this finding was due to a lack of signal-to-noise ratio from our acquisition protocol and/or postprocessing analysis or represents a true similarity between the 3 groups. Given the lack of standardization of DCE MRI among researchers, the relevance of this study’s Ktrans and ve values on drug delivery is unknown. As we previously found in a clinical study of ferumoxytol for DSC MRI and GBCA for DCE MRI, rCBV and rCBF results were more clinically useful than Ktrans and ve results.29 This observation has also been found by other groups.41 DCE MRI has been proven useful in the assessment of permeability within an individual subject before and after treatment,31 but the validity of using it to compare different subjects remains unclear.
Ferumoxytol administration facilitates incredibly high-resolution vessel delineation by SWI. We found that SWI provides a means for in vivo microscopy of intratumoral vessel size and architecture and that these characteristics are associated with survival in Group 3 medulloblastoma. Tumors with diffuse microvascularity were more aggressive than those with a more organized pattern. We hypothesize that this is due to unregulated VEGFA-mediated angiogenesis associated with rapid tumor growth. Although not commonly used in the clinical evaluation of brain tumors, SWI has been useful in assessing the growth of pathological microvasculature in malignant gliomas.42 However, SWI or GRE sequences are not routinely acquired as part of a “brain tumor protocol” at many major institutions in the US and Canada despite the fact that the acquisition time of such sequences is only 4 to 5 minutes. Given the results of this study and the ease with which it is obtained, we expect that SWI/GRE will be used increasingly for the assessment of pediatric medulloblastoma.
Limitations of this work include those inherent to preclinical studies utilizing patient-derived xenografts. However, because all xenografts used were developed at Duke, these were relatively low-passage lines of D283, D341, and D425, three of the mostly widely used cell lines for in vitro and in vivo preclinical medulloblastoma studies in the scientific literature. Because the tumor models used in this study were patient-derived xenografts, we expect the DSC MRI and SW MRI findings to be generalizable to humans. However, given the relatively low number of animals in each xenograft group (n = 6–7), it is possible that the association between tumor vascularity as determined by DSC MRI and survival may be due to chance. Likewise, the number of patients with Group 3 medulloblastoma who had a GRE sequence MRI is relatively small (n = 6); therefore, future research is needed to validate vessel architecture observations in a larger patient cohort. We advocate for the acquisition of GRE or SW images in all patients suspected to have medulloblastomas. Additionally, although the genes RNH1, SCG2, VEGFA, AGGF1, and PROK2 were identified as putative drivers of angiogenesis in Group 3 medulloblastoma, it is likely that numerous others with complex interactions play a role in tumor vessel formation and growth. However, if validated in future functional studies, these may prove to be novel therapeutic targets for Group 3 medulloblastoma.
To our knowledge, we demonstrate for the first time that VEGFA-mediated angiogenesis plays a role in the pathogenesis of Group 3 medulloblastoma. DSC MRI and SW MRI are both rational, clinically relevant biomarkers that accurately reflect tumor vascularity and predict OS. These imaging modalities can be directly translated to clinical use and may be used to direct antivascular therapies for patients harboring tumors with high rCBV and rCBF on DSC MRI and a diffuse microvascular pattern on SW MRI.
Supplementary Material
Supplementary material is available at Neuro-Oncology online.
Funding
This work was supported by the National Institutes of Health (P50CA190991) and the Duke University School of Engineering Chandran Research Award in Molecular Imaging in Neuro-Oncology (E.M.T.); and the Canadian Cancer Society Research Institute, Terry Fox Research Institute, Canadian Institutes of Health Research, National Institutes of Health, Pediatric Brain Tumor Foundation, and the Garron Family Chair in Childhood Cancer Research (M.D.T.). The Preston Robert Tisch Brain Tumor Center biorespository is supported by the Pediatric Brain Tumor Foundation.
Conflict of interest statement. The authors declare no potential conflicts of interest.
Acknowledgments
The authors wish to thank Kendra Congdon, PhD, for manuscript comments and John H. Sampson, MD, PhD, and Peter Fecci, MD, PhD, for the laboratory space to perform histologic analyses.
References
Author notes
Corresponding Author: Eric M. Thompson, MD, Duke University Medical Center, Box 3272, Durham, NC 27710, USA (eric.thompson@duke.edu).
*Co-senior authors.


