


Abstract
There is increasing evidence of the benefit of regular physical exercise in a number of long-term conditions including chronic kidney disease (CKD). In CKD, this evidence has mostly come from studies in end stage patients receiving regular dialysis. There is little evidence in pre-dialysis patients with CKD Stages 4 and 5.
A prospective study compared the benefits of 6 months regular walking in 40 pre-dialysis patients with CKD Stages 4 and 5. Twenty of them were the exercising group and were compared to 20 patients who were continuing with usual physical activity. In addition, the 40 patients were randomized to receive additional oral sodium bicarbonate (target venous bicarbonate 29 mmol/L) or continue with previous sodium bicarbonate treatment (target 24 mmol/L).
Improvements noted after 1 month were sustained to 6 months in the 18 of 20 who completed the exercise study. These included improvements in exercise tolerance (reduced exertion to achieve the same activity), weight loss, improved cardiovascular reactivity, avoiding an increase in blood pressure medication and improvements in quality of health and life and uraemic symptom scores assessed by questionnaire. Sodium bicarbonate supplementation did not produce any significant alterations.
This study provides further support for the broad benefits of aerobic physical exercise in CKD. More studies are needed to understand the mechanisms of these benefits, to study whether resistance exercise will add to the benefit and to evaluate strategies to promote sustained lifestyle changes, that could ensure continued increase in habitual daily physical activity levels.
Introduction
Patients with advanced chronic kidney disease (CKD) typically suffer from weakness and excessive fatigue, which lead to a low level of physical activity and reduced quality of life [ 1 , 2 ]. Renal anaemia contributes to this scenario but correction of anaemia with erythropoeisis-stimulating agents does not fully restore physical functioning [ 3 , 4 ]. Poor physical condition and skeletal muscle wasting are associated with CKD [ 5 , 6 ]. This is due to the combined effects of uraemic acidosis, protein-energy malnutrition and inflammatory cachexia, which lead to and are further aggravated by a sedentary lifestyle [ 7 ]. Together, these factors result in a progressive downward spiral of deconditioning. As well as being a strong cardiovascular risk factor, physical inactivity is associated with increased risk of rapid kidney function decline in CKD [ 8 ].
Patients at all stages of CKD have an increased risk of cardiovascular disease, which is the most common cause of death [ 9 ]. In stages 3 and 4 CKD, the risk of death from a cardiovascular event increases with worsening renal function and is several fold more than the risk of progression to end-stage renal disease [ 10 , 11 ]. In early CKD, traditional cardiovascular risk factors such as age, diabetes, hypertension and dyslipidemia are important [ 12 ]. In more advanced CKD, additional risk factors include chronic systemic inflammation, oxidative stress, vascular calcification, a prothrombotic environment and anaemia [ 13–15 ].
Physical activity is known to have many health benefits in the general population, including positive impacts upon glycaemic control, hypertension, dyslipidemia, chronic systemic inflammation, obesity, muscle wasting and reduced cardiovascular risk [ 16 ]. These benefits are also seen in long-term conditions including coronary heart disease, chronic respiratory disease, diabetes and cancer [ 17–20 ].
There has been relatively little research into the role of exercise training in the management of CKD, although it is recommended in national guidelines including the UK Department of Health National Service Framework for Renal Services [ 21 ]. However, incorporation into clinical services appears to be slow, probably due to lack of consensus as to effective training programmes in CKD, and a dearth of randomized controlled trials proving beneficial effects in this specific population. Most of the work to date has concentrated on dialysis patients [ 22 ]. The role of exercise in earlier stages of CKD has been less studied, but the limited evidence does suggest exercise is beneficial [ 23 ]. The potential benefits for the pre-dialysis population are great because there are many such patients, and there is scope for preventing progression of cardiovascular disease and maintaining general health before the occurrence of extensive tissue damage and development of significant comorbidities.
In order for an exercise programme to be clinically useful, it needs to be practical, cost-effective and sustainable. Ideally, it should be simple enough for the patients to do at home and require no special equipment or skills. Walking is usually the best-accepted form of exercise and is widely recommended for general health. Here, we report a study of 6-months home walking exercise in patients with Stages 4 and 5 pre-dialysis CKD. Uraemic metabolic acidosis is a causative factor in muscle wasting in CKD and may be exacerbated by exercise due to lactic acid generation [ 7 ]. For this reason, we also investigated the putative benefits of minimizing acidosis with additional alkali therapy in half of the subjects.
Materials and methods
Forty patients with CKD Stage 4 or 5 not receiving renal replacement therapy (23 males, median age 58, range 20–83 years) were recruited from nephrology clinics at Leicester General Hospital, Leicester, UK. Exclusion criteria were age <18 years, pregnancy and orthopaedic or cardiovascular disability severely limiting exercise capacity. The study was approved by the UK National Research Ethics Committee, and all patients gave written informed consent to participate.
The first 20 patients recruited were assigned to the intervention group and exercised for 6 months as described below. Twenty other patients continued with normal physical activity (non-exercise controls). In addition, the forty patients were randomly allocated to receive additional oral bicarbonate supplementation (target plasma bicarbonate 29 mmol/L; 10 exercisers, 10 controls) or to continue with usual bicarbonate therapy (target plasma bicarbonate 24 mmol/L; 10 exercisers, 10 controls). Patients otherwise continued under usual clinical care.
All patients underwent an assessment protocol at entry and after a period of 6 months. In addition, 14 of the 20 patients in the exercising group underwent assessments after 1 month. The assessment protocol included the following.
Exercise tolerance
At baseline, patients performed an exercise tolerance test consisting of 30 min walking on a motorized treadmill at a 1% incline while wearing an electronic heart rate monitor. Every 2 min, the patient was asked to self-report their effort level using the Borg Rating of Perceived Exertion (RPE) scale [ 24 ] and the speed of the treadmill was adjusted to maintain a score of 12–14 (somewhat hard). The treadmill speed profile of each individual’s tolerance test was recorded and repeated at subsequent assessment stages, with RPE again recorded every 2 min.
Biochemical/haematological parameters
Resting venous blood samples were obtained for measurement of plasma concentrations of sodium, potassium, bicarbonate, calcium, phosphate, alkaline phosphatase, albumin, haemoglobin, haematocrit, lactate, white blood cell count and platelet count. Estimated glomerular filtration rate (GFR) was calculated by the four-variable Modification of Diet in Renal Disease formula.
Quality of life and health measures
Quality of life and health were assessed with two validated questionnaires, chosen because of the range of domains covered and experience in their use by our research team. The Functional Assessment of Chronic Illness Therapy-Spirituality Scale Quality of Life Tool (FACIT-Sp) [ 25 ] consisting of four domains concerned with physical, social/family, emotional and functional well-being, and the Leicester Uraemic Symptom Score (LUSS) [ 26 ], which assesses the number, frequency, intrusiveness and total impact of 11 uraemic symptoms.
Body composition
Body mass index (BMI) was calculated from weight and height. To measure lean and fat mass, body composition was assessed by dual-energy X-ray absorptiometry (DEXA) (Lunar Prodigy; GE Healthcare, Slough, UK),
Blood pressure and medications
Blood pressure (BP) was assessed in both arms after 10 min rest. The average of three readings from the arm with the higher BP, taken with a validated automated oscillometric device (AND UA-767; A&D Instruments Ltd, Abingdon, UK) was used. Details of the BP medications taken by each patient at baseline and 6 months were extracted from the clinical records.
Cardiovascular evaluation
Central haemodynamics (heart rate, cardiac output, stroke volume and total peripheral resistance) were non-invasively assessed for 10 min in the supine position using the Finometer® (Finapres Medical Systems, Amsterdam, The Netherlands) [ 27 , 28 ]. A finger cuff was attached to the middle finger to continuously measure the underlying digital artery pulse wave, and a second cuff attached to the upper arm to permit calibration to the brachial arterial pressure. Baroreflex sensitivity (BRS, a composite marker of autonomic integrity) [ 27 , 29 , 30 ] was then calculated by cross correlation time-domain analysis of this trace using software provided by the manufacturer. Arterial stiffness was assessed by both pulse wave analysis and pulse wave velocity (both carotid–femoral and carotid–radial) using ECG-gated applanation tonometry (SphygmoCor®; AtCor Medical, Sydney, Australia). Follow-up visits were performed at the same time of day to limit the effect of diurnal variation. Subjects were requested to abstain from caffeine for at least 8 h prior to the visit.
Exercise intervention
Subjects in the exercise intervention group were each provided with a heart rate monitor and given an individualized exercise programme based on a minimum of 30 min walking, five times a week at an RPE of 12–14 and/or achieving the heart rate elicited by this effort level during the treadmill exercise test. Patients recorded the time and RPE level of each exercise session in a diary, and attended the hospital gym twice during the first month and once a month subsequently for diary monitoring and revision of their exercise programme by study staff as necessary. Non-exercise control subjects continued with their usual physical activity and were not required to visit the gym.
Statistical analysis
The RPEs recorded at each time point through the exercise tolerance tests were analysed by paired t -tests. Individual changes in haematological and biochemical parameters, quality of life scores, anthropometric measures, DEXA scanning values, BP readings and cardiovascular assessment values were analysed by comparing values at baseline to those at 1 and 6 months using paired t -tests or Wilcoxon tests as appropriate. For these measurements, the exercising and non-exercising groups were also compared at each time point by either unpaired t -tests or Mann–Whitney tests. A P-value of <0.05 was considered significant. Unless otherwise stated all data are presented as mean ± SEM.
Results
Of the 40 subjects recruited, 18/20 in the exercise group and 14/20 non-exercising controls completed the full 6-month study. Reasons for dropping out were progression to dialysis ( n = 2), change in personal circumstances ( n = 2), and lack of motivation ( n = 4). Details of the subjects who entered and completed the study are shown in Table 1 .
Patient characteristics at baseline a
| Exercise group | Non-exercise group | ||||
| N | 18 | 14 | |||
| Age (years) | Median 61.5, range 50–73 | Median 56.0, range 31–83 | |||
| Gender | 11 males | 8 males | |||
| Randomized to high target bicarbonate | 8 | 6 | |||
| Mean | SEM | Mean | SEM | P | |
| eGFR (mL/min/1.73m 2 ) | 25.3 | 1.86 | 27.1 | 2.2 | NS |
| BMI (kg/m -2 ) at baseline | 27.5 | 1.04 | 29.3 | 1.46 | NS |
| Lean mass (kg) | 46.2 | 2.2 | 48.4 | 3.0 | NS |
| Fat mass (kg) | 27.9 | 2.5 | 31.8 | 3.5 | NS |
NS, Non Significant.
Bicarbonate supplementation
Half of the subjects were randomized to receive extra oral sodium bicarbonate with the aim of achieving a venous bicarbonate of 29 mmol/L. After 1 month, venous bicarbonate in this group had significantly increased (baseline 24.7 ± 0.96, 1 month 27.8 ± 0.70 mmol/L, P = 0.02). This level was maintained at 6 months (27.9 ± 0.46 mmol/L, P = 0.002 versus baseline). The group continuing previously prescribed sodium bicarbonate supplementation (target 24 mmol/L) showed no significant change in venous bicarbonate at 1 or 6 months (baseline 24.4 ± 0.70, 1 month 22.7 ± 1.44, 6 months 25.3 ± 0.50 mmol/L). Sodium bicarbonate supplementation had no significant effect on any of the other parameters here reported. For that reason, unless otherwise stated, pooled data are presented from patients receiving standard and additional bicarbonate. There were no significant clinical adverse effects of additional sodium bicarbonate.
Exercise tolerance/physical activity
Exercise tolerance (individual mean RPE over the whole 30-min test) significantly improved after both 1 (P < 0.001) and 6 (P < 0.001) months of exercise ( Figure 1 ). No significant change in exercise tolerance was seen in the non-exercise control group, except in the final 2 min of the exercise test at which point the RPE score was significantly less than at baseline (P = 0.045).
RPE during an exercise tolerance test before (baseline) and after 1 ( A ) and 6 ( B ) months of walking exercise and after 6 months without exercise ( C ). At initial assessment, subjects exercised on a treadmill at a rate perceived as moderately hard (RPE 12–14). At subsequent assessments, the same exercise profile was undertaken, and the RPE score recorded. Asterisk denotes a significant difference from corresponding baseline time point (P < 0.05) Data are presented as mean ± SEM.
Biochemical/haematological parameters
Apart from changes in venous bicarbonate discussed above, there were only small changes in serum potassium and platelet count over the 6 months of this study in the exercise group and the non-exercising controls ( Table 2 ).
Changes in biochemical data in the exercising and non-exercising patients
| Exercise group | Non-exercise group | |||
| Baseline | 6 months | Baseline | 6 months | |
| Haemoglobin (g/dL) | 12.5 ± 0.3 | 12.9 ± 0.3 | 12.4 ± 0.4 | 12.5 ± 0.3 |
| Leukocyte count (×10 9 /L) | 7.3 ± 0.7 | 6.9 ± 5.6 | 7.4 ± 5.1 | 7.3 ± 0.6 |
| Platelet count (×10 9 /L) | 229 ± 18 | 227 ± 13 | 224 ± 13 | 255 ± 19 a |
| Ferritin (ng/mL) | 108.0 ± 38.1 | 87.8 ± 30.3 | 122.0 ± 56.5 | 101.0 ± 52.5 |
| Sodium (mmol/L) | 140.1 ± 0.5 | 139.2 ± 0.4 | 139.0 ± 0.5 | 139.3 ± 0.7 |
| Potassium (mmol/L) | 4.5 ± 0.1 | 4.7 ± 0.1 a | 4.4 ± 0.2 | 4.9 ± 0.1 a |
| Calcium (adjusted) (mmol/L) | 2.9 ± 0.1 | 2.6 ± 0.1 | 2.5 ± 0.2 | 2.6 ± 0.1 |
| Phosphate (mmol/L) | 1.3 ± 0.05 | 1.2 ± 0.04 | 1.1 ± 0.06 | 1.1 ± 0.04 |
| Alkaline phosphatase (IU/L) | 85.8 ± 4.9 | 81.6 ± 5.3 | 87.6 ± 9.2 | 82.5 ± 7.7 |
| Urea (mmol/L) | 17.4 ± 1.7 | 22.3 ± 8.4 | 13.9 ± 1.7 | 13.2 ± 1.8 |
| Creatinine (μmol/L) | 242.5 ± 24.6 | 244.4 ± 27.9 | 227.7 ± 22.5 | 228.3 ± 23.5 |
| Bicarbonate (mmol/L) | 23.5 ± 0.7 | 26.0 ± 0.6 a | 26.3 ± 0.9 | 27.1 ± 0.6 |
| Albumin (g/L) | 44.0 ± 0.6 | 43.5 ± 0.6 | 42.5 ± 0.7 | 42.7 ± 0.6 |
| Triglycerides (mmol/L) | 17. ± 0.4 | 1.6 ± 0.3 | 2.0 ± 0.4 | 2.1 ± 0.4 |
| Cholesterol (mmol/L) | 4.9 ± 0.4 | 4.8 ± 0.4 | 4.8 ± 0.4 | 4.6 ± 0.3 |
| Parathyroid hormone (pg/mL) | 23.4 ± 4.6 | 27.6 ± 5.1 | 21.6 ± 9.3 | 26.7 ± 10.3 |
A significant change from baseline (P < 0.05).
Quality of life and health measures
General well being was assessed using the FACIT-Sp questionnaire ( Figure 2 ). After 1 month, the exercise group showed an improved score in domains concerned with physical quality of life and health, this was maintained but not further improved after 6 months and furthermore, no improvement was seen in the responses made by the control patients for these domains. However, an improved score was seen in family/social domains at 6 months in both the exercisers and non-exercise controls ( Figure 2 ). Perception of the impact of uraemic symptoms were assessed using the Leicester Uraemic Symptom Score (LUSS; Figure 3 ). The exercising group reported reductions in the frequency, intrusiveness and total impact of their symptoms after 1 month of exercise, and these improvements were maintained at 6 months. No changes were seen in the non-exercising controls.
Changes in FACIT-Sp Quality of Life questionnaire responses after 6 months of exercise ( A and B ) and after a 6-month period of no exercise ( C and D ). Asterisk denotes significant difference to baseline (P < 0.05). In Figures A and C, a lower score relates to improvement, while in Figures B and D, a higher score relates to improvement. Data are presented as mean ± SEM.
Effect of 6 months of exercise ( A ) and 6 months of no exercise ( B ) on perception of uraemic symptoms (from the Leicester Ureamic Symptom Score). Asterisk denotes significant difference to baseline (P < 005). Data are presented as mean ± SEM. A reduced score relates to an improvement.
Body composition
After 1 month of exercise, the patients in the exercise group showed a small but significant reduction in BMI (baseline 27.3 ± 1.2, 1 month 26.8 ± 1.1 kg/m 2 , P = 0.007). This was maintained but not further improved at 6 months (27.5 ± 1.0 kg/m 2 , P = 0.006 versus baseline). Furthermore, this decrease in BMI at both time points was predominately seen in those exercising patients who received additional sodium bicarbonate (P = 0.03 and P = 0.009 versus standard bicarbonate for 1 and 6 months, respectively). The non-exercising controls did not show any change in BMI after 6 months ( Table 3 ).
Changes in BMI (kg/m 2 ) in the exercising and non-exercising patients
| Exercise group | ||||
| Baseline | 1 month | 6 months | ||
| All patients | 27.3 ± 1.2 | 26.8 ± 1.1 a | 26.9 ± 1.0 a | |
| STD | 28.7 ± 1.6 | 28.4 ± 1.4 | 28.8 ± 1.3 | |
| XS | 25.3 ± 1.6 | 24.7 ± 1.5 a | 24.5 ± 1.4 a | |
| Non-exercise group | ||||
| All patients | 29.3 ± 1.4 | Data not collected at 1 month | 28.6 ± 1.3 | |
| STD | 30.3 ± 1.8 | 29.3 ± 1.7 | ||
| XS | 27.8 ± 2.5 | 27.5 ± 2.1 | ||
A significant change from baseline (P < 0.05). Data for non-exercising patients were only collected at baseline and 6 months. STD refers to standard target bicarbonate group; XS refers to high target bicarbonate group.
DEXA assessment showed that this modulation of body composition after 1 month of exercise was mainly due to fat loss. Fat mass reduced by 0.71 ± 0.62 kg (28.5–27.8 kg; P = 0.001) ( Figure 4A ). Lean mass showed a trend to increase by 0.56 ± 0.98 kg (48.5–49.2 kg; P = 0.060) ( Figure 4B ). Body composition was not significantly different at 6 months in either exercising or non-exercising groups, due in part to a return towards baseline in the exercising group. However, when lean body mass (LBM) is expressed as percentage of total body mass and as the LBM/fat mass ratio, small increases were seen after 6 months on additional sodium bicarbonate (baseline 64.0 ± 3.8, 1 month 65.8 ± 4.5%, P = 0.028; baseline 2.3 ± 0.5 to 2.9 ± 0.7 1 month; P = 0.027, respectively).
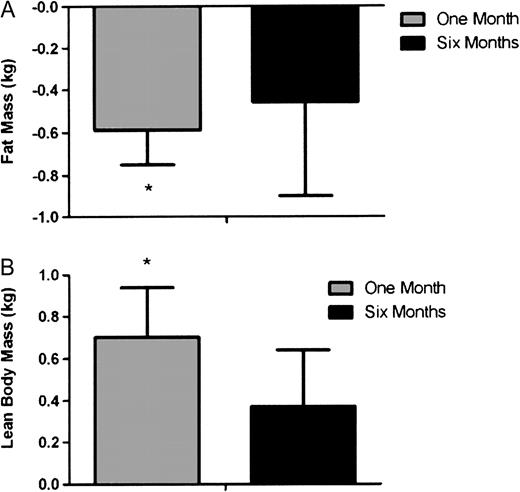
Changes in fat ( A ) and lean ( B ) mass measured by DEXA after 1 and 6 months of exercise. Asterisk denotes significant difference from baseline (P < 0.05) where by definition, baseline is 0. Data are presented as mean ± SEM.
BP and medications
BP was well controlled at baseline 130 ± 3.0/74 ± 1.6 mmHg, with no difference between exercise and non-exercising groups. BP did not change after 1 month of exercise. Over 6 months, BP remained unchanged from baseline in exercisers, while systolic BP decreased in non-exercisers from 135 ± 4.5 to 127 ± 4.0mmHg (P = 0.013). An increase in BP medication was needed during the 6-month study in just 2 of 18 exercising subjects who completed the study, but in 6 of 14 non-exercising controls (P = 0.05).
Cardiovascular reactivity
One non-exercising participant developed a cardiac arrhythmia during the study (atrial flutter with variable block), thus their cardiovascular data were excluded from analysis. Arterial stiffness and BRS were unchanged over all time periods and exercise groups ( Table 4 ). The cardiovascular function of non-exercising subjects changed at 6 months ( Figure 5 ). Stroke volume (all median ± interquartile range) (106 ± 22; 96 ± 35 mL, P = 0.028), cardiac output (7.0 ± 3.6; 6.1 ± 2.7 L/min; P = 0.023) and heart rate (71 ± 22; 63 ± 17 b.p.m.; P = 0.015) decreased, while total peripheral resistance increased (0.84 ± 0.33; 0.92 ± 0.64 dyne.s/cm 5 ; P = 0.041). The cardiovascular function of exercising subjects, assessed by the same parameters, remained unchanged over all time periods.
| Exercise group | Non-exercise group | |||
| Baseline | 6 months | Baseline | 6 months | |
| Arterial stiffness (m/s); mean values ± SD | ||||
| Carotid–femoral | 9.29 ± 2.07 | 9.56 ± 2.35 | 9.91 ± 2.66 | 9.73 ± 2.56 |
| Carotid–radial | 9.68 ± 1.03 | 9.65 ± 1.40 | 9.50 ± 1.25 | 9.76 ± 1.52 |
| Augmentation index | 21.8 ± 7.8 | 23.3 ± 7.4 | 19.9 ± 14.6 | 20.4 ± 17.1 |
| BRS (ms/mmHg); median values (IQR) | 5.82 (4.91) | 6.76 (5.66) | 5.75 (2.65) | 5.88 (6.94) |
IQ, interquartile range.
There were no significant differences between baseline and 6 months values in either group.
| Exercise group | Non-exercise group | |||
| Baseline | 6 months | Baseline | 6 months | |
| Arterial stiffness (m/s); mean values ± SD | ||||
| Carotid–femoral | 9.29 ± 2.07 | 9.56 ± 2.35 | 9.91 ± 2.66 | 9.73 ± 2.56 |
| Carotid–radial | 9.68 ± 1.03 | 9.65 ± 1.40 | 9.50 ± 1.25 | 9.76 ± 1.52 |
| Augmentation index | 21.8 ± 7.8 | 23.3 ± 7.4 | 19.9 ± 14.6 | 20.4 ± 17.1 |
| BRS (ms/mmHg); median values (IQR) | 5.82 (4.91) | 6.76 (5.66) | 5.75 (2.65) | 5.88 (6.94) |
IQ, interquartile range.
There were no significant differences between baseline and 6 months values in either group.
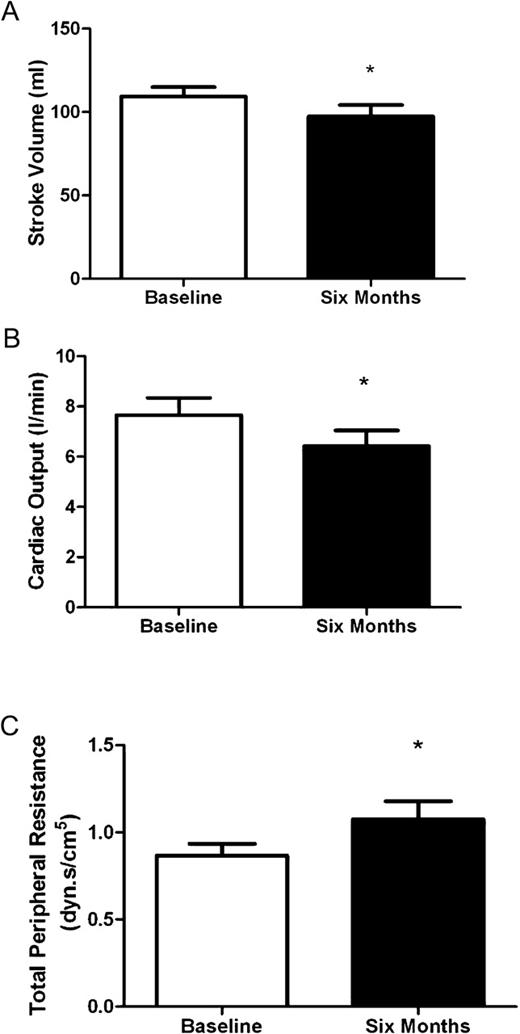
Change in cardiovascular function following a period of 6 months in non-exercising controls. Asterisk denotes significant change from baseline (P < 0.05). Data are presented as mean ± SEM.
Discussion
The benefits of physical exercise are well described in the general population, and in long-term conditions such as chronic obstructive pulmonary disease, which like CKD are associated with progressive deconditioning due to a downward spiral of inactivity and muscle wasting. In CKD, this scenario is further aggravated by the catabolic effects of uraemia and acidosis. The benefits of exercise in kidney disease have been best described in patients on regular haemodialysis undertaking intradialytic aerobic exercise, usually static cycling [ 22 ].
Few data are available on the effects of aerobic exercise in patients with advanced CKD not yet receiving renal replacement therapy. Our study investigated these potential benefits. It had a pragmatic design and could of course not be blinded. Although patients were randomized to receive additional bicarbonate or not, we chose not to randomize patients to exercise. We were concerned to minimize the risk of ‘contamination’, i.e. that patients in the study who met during their regular clinical care as well as for study sessions may influence each others’ exercise patterns. In this small study, such contamination could be a significant confounder, and therefore, we chose a sequential design so that only exercisers, and later non-exercisers, were involved in the study at any one time. Exercisers were prescribed an exercise programme, but no restrictions were placed on them taking more exercise than this if they wished. Non-exercising controls continued their routine care under the supervision of a unit where the benefits of exercise were being widely discussed and a new programme of intradialytic cycling for haemodialysis patients was being established. However, despite these potential confounders, the amount of exercise was significantly different between the two study groups, and benefits of exercise were shown.
Although there are important limitations due to the non-randomized design of the exercise element of the study, there were significant benefits of the exercise regimen: improved exercise tolerance as judged by falling RPE scores for the same achieved exercise and broad improvements in quality of life and health. The quality of life improvements are of interest in view of evidence that the psychological benefits of exercise may be an important contributor to the accompanying physical improvements in health [ 31 ].
The study patients were also randomized to receive additional sodium bicarbonate supplementation. Significant difference in plasma venous bicarbonate was achieved between the two study groups with no adverse effects, but despite this only subtle effects of additional sodium bicarbonate were shown. Patients on additional sodium bicarbonate plus exercise achieved a small but significant reduction in BMI after 1 month, which was maintained at 6 months ( Table 3 ). No change in BMI was observed with exercise or bicarbonate alone. The reason for this is not clear but may be related to more bicarbonate-sensitive parameters such as protein turnover, which remain to be determined. There was a small but statistically significant increase in mean serum potassium in the study population as a whole over the 6 months of the study, despite no significant decrease in eGFR. This increase was mitigated by bicarbonate supplementation; the mean serum potassium did not change in those subjects receiving additional bicarbonate whether or not they were in the exercise group.
Improvements in body composition were observed at 1 month in exercisers (reduced fat mass, trend to increased lean mass) but were not sustained at 6 months. This may reflect an unavoidable decline due to CKD or may be due to patients not progressing or sustaining their exercise regimen in the later stages of the study period. Use of RPE to prescribe target exercise intensity should in theory result in the subject increasing their exercise intensity as their aerobic fitness improves in order to maintain the effort level. Frequency and duration of exercise bouts are other elements of the exercise prescription, which may be more appropriately progressed than intensity in this population. Participants were asked to exercise 5 days a week from the start of the study if possible and to achieve this as soon as possible if they were initially unable to do so, so progressing frequency later in the programme was not practical. Participants were asked to aim for at least 30 min/day, accumulating this in shorter bouts if necessary and were encouraged to progressively increase the duration of each bout throughout the study. No detailed measurements were made of achieved exercise during the study other than through exercise diaries. An examination of these showed that although most did progress the frequency and duration of their programme in the earlier stages, some patients had difficulty in sustaining this progression for the full 6 months, and some had begun to ‘tail off’ their exercise by the end of the study. Despite this, the improvements in quality of life and health and exercise tolerance achieved by 1 month were maintained at 6 months. Difficulty in sustaining exercise programmes is commonly reported in long-term conditions and varying the type of exercise undertaken may help with adherence by alleviating boredom. Further investigation of psychological, educational and other motivational strategies to achieve permanent changes in lifestyle are required if the long-term benefits of exercise in CKD are to be realized.
The cardiovascular evaluations should be interpreted with caution in these small non-randomized cohorts. Nevertheless, BP had fallen at 6 months in non-exercisers compared to exercisers, but this was associated with more increases in BP medication. Stroke volume, cardiac output and heart rate all fell at 6 months in non-exercisers, and total peripheral resistance increased, whereas these data were unchanged in exercisers. The range of values also increased at 6 months. There were no technical reasons for this change in measurements, which may possibly reflect increasing variation in the extent to which exercise regimens were maintained. The changes in haemodynamic variables demonstrated in non-exercisers were characterized by a reduction in cardiac output caused by both reducing stroke volume and heart rate, combined with increasing peripheral vasoconstriction. The increases in antihypertensive therapy were primarily of those that characteristically cause peripheral vasodilation (RAS inhibitors, alpha-blockers, calcium channel blockers), including one participant who received both an increase in calcium channel blocker dose as well as commencing an alpha-blocker. Although limited by small numbers, there was no relationship seen between change in antihypertensive therapy and change in haemodynamic parameters. Thus, these changes in haemodynamic performance do not appear to be caused by the changes in antihypertensive therapy. Overall, walking exercise seems to confer some degree of protection from the deterioration in cardiovascular reactivity observed at 6 months in the non-exercising controls.
Both arterial stiffness and BRS were similar at baseline in exercise and non-exercise groups, and broadly comparable to those previously reported [ 27 , 30 , 32 ]. The wide spread of reported values is likely to reflect the group heterogeneity in both age and renal function. While there is a suggestion of an improvement of autonomic function (BRS) at 6 months in exercisers, this was not statistically significant. Although a gradual deterioration in both arterial stiffness and BRS would be expected over time, demonstration of this would require a larger cohort with longer follow-up.
These data provide a basis for continuing to study the benefits of exercise in CKD. The benefits of aerobic exercise may be limited by uraemic muscle wasting, and an additive role for resistance exercise to increase muscle mass should also be investigated. At least for the parameters described in this small study, there were no demonstrable metabolic benefits, and the cardiovascular improvements following exercise are not clear cut: larger studies are required to clarify the cardioprotective effects. But the measurable benefits on the well being and exercise capacity of patients are sufficient to provide a justification for continuing to define the appropriate exercise regimens and to identify strategies to achieve sustained lifestyle changes which promote exercise for those with CKD in the long term.
This work was supported in part by Kidney Research UK Grant RP33/1/2007. We gratefully acknowledge the technical assistance of Mrs Margaret Baker and Mrs Amanda Gates (University of Nottingham). George Kosmadakis was supported by a grant from the Hellenic Society of Nephrology.
Conflict of interest statement . None declared.


Comments