


Abstract
During DNA recombination and repair, RecA family proteins must promote rapid joining of homologous DNA. Repeated sequences with >100 base pair lengths occupy more than 1% of bacterial genomes; however, commitment to strand exchange was believed to occur after testing ∼20–30 bp. If that were true, pairings between different copies of long repeated sequences would usually become irreversible. Our experiments reveal that in the presence of ATP hydrolysis even 75 bp sequence-matched strand exchange products remain quite reversible. Experiments also indicate that when ATP hydrolysis is present, flanking heterologous dsDNA regions increase the reversibility of sequence matched strand exchange products with lengths up to ∼75 bp. Results of molecular dynamics simulations provide insight into how ATP hydrolysis destabilizes strand exchange products. These results inspired a model that shows how pairings between long repeated sequences could be efficiently rejected even though most homologous pairings form irreversible products.
INTRODUCTION
RecA family proteins are responsible for search and strand exchange of homologous DNAs during double strand break repair in all organisms and during meiotic recombination in eukaryotes (1–4). After a double strand break occurs, the broken double-stranded DNA (dsDNA) is resected, creating ∼1000–2000 nucleotides of single-stranded DNA (ssDNA) attached to a dsDNA tail (5–7). In bacteria, that initiating ssDNA becomes incorporated in an ssDNA-RecA filament that searches for a dsDNA containing a strand that is complementary to the initiating ssDNA (8,9).
The ssDNA-RecA filament tests dsDNA for homology by binding the dsDNA to the filament and attempting to establish Watson–Crick pairing between the initiating ssDNA and one of the strands in the dsDNA (10). If that strand in the dsDNA is complementary to the initiating ssDNA, then the initiating and complementary strands form a heteroduplex dsDNA that is bound to the primary binding site in the RecA monomers (11). Homology recognition is believed to depend on the sensitivity of the Watson-Crick pairing in the heteroduplex to the presence of mismatches (12–14). Some experiments have specifically studied product formation as a function of N, the number of contiguous bp in the dsDNA that match the sequence of corresponding bases in the initiating ssDNA (15–19).
Previous work suggested that once Lprod, the length of the strand exchange product, exceeds ∼20 bp, bacteria are committed to strand exchange (19); however, studies of 21 bp sequences in different strains of Escherichia coli reveal that particular strains have from ∼10 000 to 175 000 unique sequences repeated at least once (20,21). Importantly, most repeated sequences that extend >20 bp actually extend over at least 100 bp (20). These repeats can represent >1% of the genome (20).
In vivo searches are very complicated, but some insight may be gained by considering the unrealistically simple case in which all of the bases in the genome have an equal probability of making contact with the searching filament. If the searching filament contains 1000–2000 nt, it is highly probable that the ssDNA contains at least one 100 nt sequence that is repeated, and that 100 nt sequence would represent ∼5–10% of the length of the searching ssDNA. In that case, if matched 20 bp products commit the system to formation of an irreversible product, then ∼2 to 5% of irreversible products would join different copies of sequences with lengths >100 bp. That fraction is not substantially reduced if 80 bp always commit the system to the formation of irreversible products (20).
It has been speculated that multiple sequence matched contacts between B-form dsDNA and an ssDNA-RecA filament could allow almost all homologous pairings to form irreversible products even though pairings with N < 200 rarely do (22). Previous work has already shown that ssDNA-RecA filaments formed with ATP as the cofactor are much more flexible than filaments formed with ATPγS as the cofactor (23–27). Part of that flexibility may arise from gaps in the coverage of the ssDNA by RecA (23,27), but recent theoretical work suggests that even without gaps in RecA coverage, filaments formed with ATP may make multiple sequence matched contacts with B-form dsDNA (28). Thus, though the structure of ssDNA-RecA filaments formed with ATPγS as the cofactor (11) suggests that multiple simultaneous sequence matched contacts between ssDNA-RecA filaments and B-form dsDNA with the same sequence are not possible, filaments in which the RecA hydrolyses might make multiple contacts that produce separate sequence matched strand exchange products (29). Interestingly, recent work has shown that Rad51 paralogs remodel presynaptic filaments to a flexible, stable conformation that is primed for homology searching and strand exchange (30).
In this work, we provide experimental evidence indicating that ATP hydrolysis provides features that are required by a model that suggests that multiple simultaneous sequence matched contacts between the ssDNA-RecA filament and target dsDNA could promote rejection of pairings between different copies of long repeated sequences even though homologous pairings have a high probability of forming irreversible products. Features required by that model include: destabilizing products with lengths <∼80 bp and stabilizing products with lengths >∼80 bp. Our experiments also indicate that collective interactions between strand exchange products and B-form tails contribute to the instability of <∼80 bp products. The model also requires that pairings that could produce sequence-matched irreversible products frequently do not. Our experimental results indicate that the RecA system also provides this feature, which is consistent with previous in vivo results on strand exchange mediated by a eukaryotic protein of the RecA family (31). In addition to our experimental work, we offer structural insights into the experimentally observed hydrolysis induced instability in the heteroduplex product and use a very abstract and simplified recognition model to show that parameters consistent with our experimental results would allow rejection of most pairings between different copies of repeated sequences with lengths <∼200 bp while still allowing sequence matched regions extending over ∼1000 bp to have a very high probability of creating irreversible products.
MATERIALS AND METHODS
FRET measurements
Samples were prepared by mixing an aliquot of 98 nt ssDNA (final concentration 6 μM in bases) with 2 μM RecA (New England Biolabs) in the presence of 1 mM co-factor (ATP, dATP or ATPγS) and 0.2 μM single-stranded binding protein (SSB) in RecA buffer (70 mM Tris–HCl, 10 mM MgCl2, and 5 mM dithiothreitol, pH 7.6) at 37°C for 10 min. FRET experiments were subsequently performed after adding 0.06 μM labeled dsDNA (final concentration total bases: 12 μM for dsDNA 98 bp, 9 μM for 75 bp, 6 μM for 50 bp, etc.) and rapidly transferring the solution to a quartz cuvette.
The detection of the emission of the fluorescein label was immediately started and followed by using 493-nm excitation during 30 min; the emission was read at 518 nm every one second. The integration was 0.5 s and the band width 2 nm. The sample was kept at all times at 37°C.
All dsDNA samples were prepared by annealing the complementary oligonucleotides from 90 to 40°C with 1°C steps equilibrated for 1 min; the emission at 518 nm was acquired (excitation at 493 nm) at each temperature step. For detailed information about the oligonucleotides, see Supplementary Data.
RESULTS
dsDNA length dependence of product stability probed using fluorescence vs. time curves for dsDNA with N=L
Consistent with previous work, we monitored the progress of strand exchange by observing ΔF, the change in fluorescence that occurs after dsDNA is combined with ssDNA-RecA filaments, as illustrated in Figure 1 (12,32–34). The concentration of reagents was the same for all of the experiments shown in the main body of the paper, and those concentrations are specified in the Materials and Methods section. In these experiments rhodamine and fluorescein labels were attached to the corresponding ends of each strand in the dsDNA targets (Figure 1A). The fluorescein emission is quenched when the two strands are annealed (dsDNA), but when strand exchange occurs, the strands separate. That strand exchange induced separation between the strands in the dsDNA increases the fluorescein emission. Importantly, strand exchange proceeds in the 5′ to 3′ direction, and the labels are attached to the ends of the dsDNA corresponding to the 5′ end of the filament. All the experiments whose results are shown in Figures 1 and 2 were performed with the same 98 nt ssDNA. The sequence of the 98 nt ssDNA is 5′CGGAAAAGTGCATATCCAGCAAAACATCATGAAAATAATGGGTACTGTAAAAGCGGTGCCAGTCGGCATA CTCCGTGGATGACATCCCGGCAAGCATG3′. It corresponds to bases 10184–10281 in Lambda phage sequence (GC content of 38%). Similar results were obtained in experiments that used the 98 nt filament with sequence 5′CGGAAATCACTCCCGGGTATATGAAAGAGACGACCACTGCCAGGGACGAAAGTGCAATGCG GCATACCTCAGTGGCGTGGAGTGCAGGTATACAGATT3′, corresponding to bases 19386–19483 in lambda phage sequence (GC content 54%). The similarity of the results suggests that they are not strongly affected by GC content.
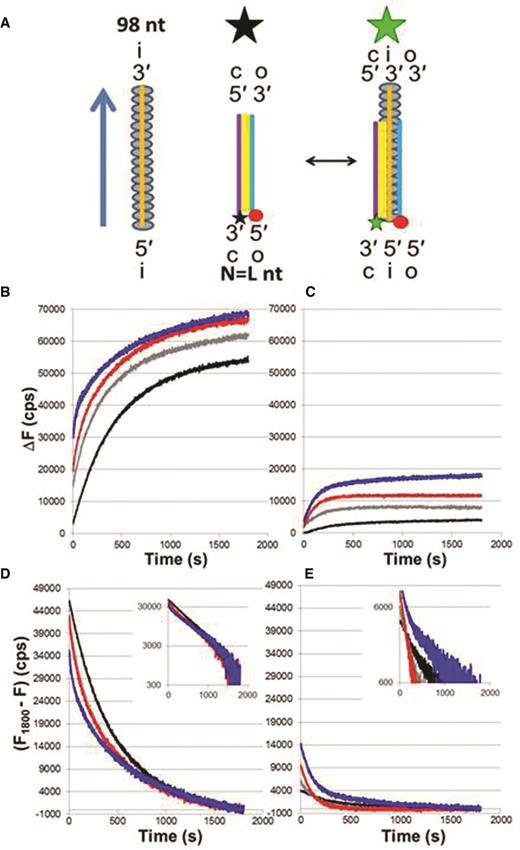
Progression of strand exchange for different N = L dsDNAs. (A) Schematic representation of experiments that measure the fluorescence change due to the separation between the fluorescein (star) labeled complementary strand (purple line) and rhodamine (red circle) labeled outgoing strand (blue line). Base-pairing is indicated in yellow. The initiating strand and the RecA monomers are illustrated by the orange line and grey ovals, respectively. The big black and green stars represent quenched and unquenched fluorescence. (B) ΔF versus time curves for 98 nt filaments and dsDNAs of increasing length in ATPγS showing the change in cps from the initial value measured for a solution containing each dsDNA in the absence of ssDNA-RecA filaments; N = 15 (black), 20 (gray), 50 (red) and 75 (blue) bp. (C) Same as (B) but in the presence of ATP. The y-axis label for Figure 1B also applies to Figure 1C. (D) Each value of the change in fluorescence in ATPγS was subtracted to the final value averaged over the last 10 s; the inset is the same data on a logarithmic y-scale. (E) Same as (D) but in ATP. The y-axis label for Figure 1D also applies to Figure 1E.
. The solid and dashed lines correspond to the same N values, but the dashed lines include tails with M > 20 bp. (E) Same as (D) but the y-axis is in logarithmic scale. The dotted black line shows the in vivo results (17) scaled to match the ΔF1800 values for in vitro results when N = 75 bp. (F) Summary of the ratio of the ΔF1800 values with and without a tail as a function of N. The green, cyan and magenta points correspond to experiments with ATPγS, ATP and dATP as cofactors, respectively, where the square and triangular points represent results for 98 nt and 75 nt filaments, respectively.](https://oup.silverchair-cdn.com/oup/backfile/Content_public/Journal/nar/45/14/10.1093_nar_gkx582/2/m_gkx582fig2.jpeg?Expires=1716342878&Signature=Bxi2e0imGEEizV2jn3cWn268a~Ds8fugt-0S8BCnB76O4pMLMsg5vG1jDqggRyzdVqq7v2wmhZuBpvt1zizL2Z55bA6bYL0XYlD-3nY0iU4g8RNuLI~39erHB9iV0IaLrkjCJ3azjhgo3NSIBlbEdvb02MXPmFiuixtY2Bl1ayI8MSwAHHgTGzmm2A-JdnS9wVL2aYErT7UbItmDXbj8YIIM2mntoDCMHpGSJDR9uDbyv1sFz5ihqOkidvbQAh9iEs91iIQWAf4J9d9IJYwYl9uYz~D7pFuX5g7usgRz7vG45VAaE4B-qhZ3BeT9iVJ3V8px66xh2Y5TN0Yhm2qgjg__&Key-Pair-Id=APKAIE5G5CRDK6RD3PGA)
Effect of heterologous tails on strand exchange. (A) Schematic representation of product formation along the entire matched region of the dsDNA with the heterologous tail. (B) ΔF versus time for 98 nt filaments and dsDNAs: N = 15 bp, M = 0 (black), N =15 + M = 5 (brown), N = 20 bp, M = 0 (gray), N = 20 + M = 30 (pink), N = 50 + M = 0 (red) and N = 50 + M = 25 (orange) in ATPγS. (C) Same as (B) but in the presence of ATP. (D) ΔF1800 versus N for 98 nt filaments in ATPγS (green), ATP (cyan) and dATP (magenta), and Exp[0.13*N](black dotted line). The solid and dashed lines correspond to the same N values, but the dashed lines include tails with M > 20 bp. (E) Same as (D) but the y-axis is in logarithmic scale. The dotted black line shows the in vivo results (17) scaled to match the ΔF1800 values for in vitro results when N = 75 bp. (F) Summary of the ratio of the ΔF1800 values with and without a tail as a function of N. The green, cyan and magenta points correspond to experiments with ATPγS, ATP and dATP as cofactors, respectively, where the square and triangular points represent results for 98 nt and 75 nt filaments, respectively.
In order to investigate hydrolysis dependent effects, we compare results from experiments that use ATP, dATP or ATPγS as the cofactors. In the presence of ATPγS, hydrolysis is negligible. In contrast, hydrolysis is significant when either ATP or dATP is the cofactor. Filaments prepared in ATPγS or dATP show there is a higher affinity of RecA for ssDNA (35), in comparison with ATP (35), and the time course of filament formation is the same in dATP as in ATPγS (36). Thus, if an effect is present when dATP is the cofactor, but absent with ATPγS, then the effect may be due to hydrolysis. If the effect is also present when ATP is the cofactor, it is even more likely that the effect is due to hydrolysis, and unlikely to be an artifact associated with filament quality. Thus, we will perform experiments using each of the three cofactors to try to determine the hydrolysis dependence of various interactions between RecA and DNA.
Figure 1B and C shows graphs of ΔF versus time as a function of N, the number of contiguous sequence matched base pairs in the dsDNA, in the presence of ATPγS and ATP, respectively. For these curves N = L, the total length of the dsDNA; consequently, all of the bases in the dsDNA are sequence matched to the corresponding bases in the 98 nt ssDNA that forms the ssDNA-RecA filament. The time axis zero corresponds to the observation time in the fluorometer, which starts ∼25 s after an aliquot of the labeled dsDNA is added to a solution containing ssDNA-RecA filaments. For rapid reactions, significant product formation can occur during the ∼25 s before we are able to begin our observations. The black, gray, red and blue curves are typical results for N = L = 15, 20, 50 and 75 bp, respectively. The curves for total fluorescence (raw data) are shown in Supplementary Figure S1A and S1B for ATPγS and ATP, respectively.
Typical standard deviations are ∼1500 cps, as shown in Supplementary Figure S1C. Each curve was taken at least three times. The insensitivity of the standard deviation to time suggests that the variation between curves dominantly results from some strand exchange insensitive offset rather than variations in product formation or in the concentration of the reactants.
Figure 1D and E shows the values obtained if each measured fluorescence values at a given time are subtracted from the value averaged over the fluorescence during last ten seconds. Performing this procedure on the measured values in Figure 1B and C or the total fluorescence curves (Supplementary Figure S1A and B) produces exactly the same curves. The insets in Figure 1D and E shows the curves in logarithmic scales. Analogous results for dATP are shown in Supplementary Figure S1D–F.
If the curves were characterized by a single exponential, then the graphs in these insets would be straight lines. Differences between the final values and the asymptotic values as well as errors in the final values will somewhat distort the shape of the logarithmic curves; however, for all curves except for 15 bp dsDNA in ATPγS, the curves differ strongly from straight lines for any choice of asymptotic value and cannot be fit by a single exponential. The curve for 15 bp dsDNA with ATPγS as the cofactor that is shown in Figure 1D is well fit by a bi-exponential (Supplementary Figure S2A–C), but the other curves require at least three exponentials to obtain a reasonable fit (Supplementary Figure S2D–F).
In order to investigate whether the results are collision limited, we conducted the same experiment with one-third of the dsDNA concentration and one-third of the filament concentration (Supplementary Figure S3). The collision rate between the dsDNA and the filaments was reduced by a factor of 9, but if the results are insensitive to the collision rates then the fluorescence values will only be reduced by a factor of 3. The observed ΔF1800 values were reduced by almost exactly one-third indicating that they are insensitive to the collision rates. Thus, results are not strongly influenced by length-dependent differences in diffusion that would not play a role in vivo.
dsDNA length dependence of product stability probed using fluorescence versus time curves for dsDNA with N<L
In vivo long ssDNA-RecA filaments search for homology within Mbp dsDNAs; consequently, in vivo dsDNA regions of accidental homology will be flanked by heterologous regions; however, for the experiments shown in Figure 1 the entire length of the dsDNA was homologous so N = L. Thus, to gain better insight into in vivo reactions we repeated the experiments illustrated in Figure 1 using dsDNA containing N contiguous homologous base pairs attached to M contiguous heterologous bp in a dsDNA with total length L = N + M. Such experiments with heterologous tails are illustrated schematically in Figure 2A. The results of those experiments are shown in Figure 2B (ATPγS) and 2C (ATP) and Supplementary Figure S4A (dATP). Analogous results were obtained in experiments with tails at the 5′ end of the filament.
To understand the influence of the tail, it is useful to compare the results for a sequence that is homologous along its entire length (N = L) to results for the same N bp homologous sequence when it is attached to a heterologous tail (N < L). Importantly, as illustrated in Figure 2A, when we compare results for the same N and different L, we are comparing dsDNAs with the same N bp sequence adjacent to the fluorophores.
The influence of tails on short dsDNA products can be seen by comparing the results for 15 bp dsDNA that is homologous to the ssDNA at the 5′ end of the filament (L = N = 15) to results for 20 bp dsDNA that includes the same 15 bp as well as five mismatched base pairs attached to the end of the dsDNA corresponding to the 3′ end of the initiating ssDNA (L = 20 = N + M = 15 + 5) (Figure 2B and C and Supplementary Figure S4A). If strand exchange is determined exclusively by N, the number of homologous bp, then the two results should be the same, but for all of the cofactors the ΔF values for N = 15 with a 5 bp heterologous tail (brown curve) are much lower than the ΔF results for N = L = 15 (black curve).
One feature of the ΔF versus time curves that we will emphasize is ΔF1800, the ΔF value at 1800 s. For many curves this represents the asymptotic value of ΔF; however, some curves evolve so slowly that they have not yet reached their asymptotic values, so care must be taken in interpreting comparisons of those values.
Figure 2D and E shows the ΔF1800 values as a function of N, the number of contiguous homologous bp in the dsDNA for N up to 75 bp. The solid lines show results for dsDNA that contains only homologous bp (N = L). The dashed lines show results for dsDNA with heterologous tails, N < L, in ATPγS (green), ATP (cyan) and dATP (magenta). The solid green line indicates that when ATPγS is the cofactor, for dsDNA without a heterologous tail, ΔF1800 values increase ∼40% from N = 15 to N = 36, and then reach an asymptotic value. Comparison of the solid and dashed green lines indicates that the presence of a heterologous tail strongly suppressed ΔF1800 when N = 15 and N = 20, but only slightly suppresses ΔF1800 at higher values of N. The transition between the two regimes can clearly be seen in Figure 2E where the ΔF1800 values are plotted on a logarithmic scale. The analogous graphs for the raw fluorescence values are shown in Supplementary Figure S4B and C.
The results in the presence of hydrolysis are significantly different. The solid cyan curve indicates that when ATP is the cofactor, if the dsDNA does not include a heterologous tail, the ΔF1800 values continue to increase with L without ever approaching the values achieved in the presence of ATPγS. The dotted black line in Figure 2E shows the in vivo results scaled to match the ΔF1800 values for in vitro results when N = 75 bp (17). Similar results are obtained in the presence of dATP, except the ΔF1800 values in dATP are consistently slightly higher than the value in ATP.
The dashed cyan line indicates that, when ATP is the cofactor, the presence of a heterologous tail strongly decreases the ΔF1800 values when N < 20. The results in the presence of dATP shown by the dashed magenta line are similar to those obtained when ATP is the cofactor, except that the results for dATP are consistently slightly higher.
The results shown in Figures 1 and 2B–F all involve interactions with 98 nt filaments. To determine whether the influence of heterologous tails and hydrolysis depend strongly on the length of the ssDNA in the filament, we also performed experiments using 75 nt filaments (Figure 3A–C). For dsDNA with N = 50 and N = L = 75 the results are similar to the results for 98 nt filaments, as shown in Figure 2F.
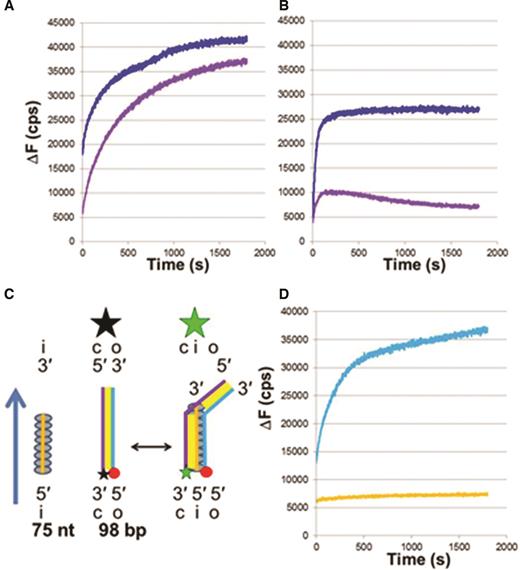
Effect of heterologous tails on strand exchange for shorter filaments or including nicks. (A) ΔF versus time curves for 75 nt filaments in ATPγS where blue and purple curves represent the results for L = 75 and L = 98 bp dsDNA, respectively. (B) Same as (A) but with dATP as the cofactor. (C) Schematic representation of experiments for 75 nt filaments and 98 bp dsDNA. The product is shown extending along the entire length of the filament, leaving a B-form tail at the end. (D) ΔF versus time curves for 98 nt filaments interacting with 98 bp dsDNA with N = 50 in dATP, where a nick separates the homologous region from the heterologous tail. The light blue curve shows the result in the presence of the nick, and the orange curve shows the result for nicked dsDNA which was ligated before the experiment.
It is possible that the heterologous tails influence strand exchange products only because they contribute a free energy penalty when mismatched bases are transferred to the strand exchange product. To test for this possibility, we performed additional experiments (Figure 3A and B) with 98 bp dsDNA that contains 75 bp that are homologous to the 75 nt in the filament, as illustrated in Figure 3C. Those results show that the presence of dsDNA that extends beyond the filament slightly suppresses ΔF in the presence of ATPγS, but if the cofactor is dATP the tail strongly suppresses ΔF. Thus, the suppression due to the tail is not only due to the free energy penalty associated with the strand exchange of mismatched bases.
We performed additional experiments to test whether the mismatch in the helical twist between B-form dsDNA and RecA bound dsDNA is playing a role in reducing ΔF. To test this possibility, we inserted a nick in the rhodamine labeled strand between the homologous and heterologous regions. Figure 3D indicates that if the nick is present, the heterologous tail does not alter ΔF. In contrast, if the experiment is done after the nick is repaired by ligation, the heterologous tail does suppress ΔF. These results are consistent with the helical mismatch between the dsDNA bound to the filament and B-form dsDNA playing a significant role in destabilizing the strand exchange product, but it is possible that some other subtle structural feature of the nick is influencing the result. Importantly, the results confirm that the tail effect shown in Figure 2 is not simply a consequence of the length difference between the dsDNA with the tail and without the tail since the nicked dsDNA with the tail shows the same result as the dsDNA without the tail.
We note that care must be taken in comparing curves for different L and N values since the total fluorescent for different dsDNA strands may vary; however, a detailed study of these fluorescence values for dsDNAs with both labels and the same dsDNAs with fluorescein labeled and unlabeled strands shows that the variation is within our experimental error (Supplementary Figure S5). Moreover, all of the dsDNA molecules considered in Figures 1 and 2 have the same labels attached to the same nucleotides at the ends of the dsDNA molecules. Differences in the fluorescence values of the dsDNA molecules were probed by measuring the total emission of the fluorescein-labeled ssDNA oligonucleotide before and after adding an equal amount of complementary rhodamine or unlabeled ssDNA and equilibrating the temperature to 37°C (Supplementary Figure S5).
Since RecA is an ATPase, the ATP present in the buffer will decrease with time. That decrease could have a significant effect on the measured length dependence of the ΔF1800 values; however, the presence of an ATP regeneration system does not steepen the length dependence of the ΔF1800 values. Thus, the insensitivity of ΔF1800 to dsDNA lengths >∼20 bp that is observed in the presence of ATP hydrolysis is not an artifact associated with ATP depletion (Supplementary Figure S6). Importantly, Figure 2 shows that when ATPγS is the cofactor the ΔF1800 values are very similar for all lengths >∼36 bp, suggesting complete product formation and further supported by the small variation in the quenching efficiency of the different dsDNA molecules (Supplementary Figure S5). Thus, for dsDNA lengths >∼36 bp the ∼ 70 000 cps asymptotic ATPγS fluorescence values well approximate the emission from a sample in which all of the dsDNA is incorporated in a heteroduplex product that remains bound to RecA.
Previous work indicates that for product lengths <∼75 bp, the heteroduplex remains bound to RecA (37); consequently, for dsDNA with L < ∼75 bp, the equilibrium product formation in the presence of hydrolysis can be estimated by dividing the asymptotic fluorescence value by 70 000 cps. Thus, Figure 2 indicates that for 75 bp dsDNA at equilibrium ∼40% of the dsDNA is incorporated in a product when dATP is the cofactor, and ∼30 % is in a product when ATP is the cofactor. Incomplete product formation could indicate product instability or it could indicate that only a fraction of the ssDNA molecules are forming ssDNA-RecA filaments.
A detailed discussion of experiments that probe filament formation is presented in Supplementary Data, including results of gel assays and fluorescence studies (Supplementary Figure S7). Additional information on the quality of the filaments can be obtained from the competitive binding experiments that we discuss in the next section.
dsDNA length dependence of product stability probed using unlabeled competitive binding assessed by fluorescence versus time curves for labeled dsDNA
Competitive binding experiments not only provide information about the quality of the filaments, but they also provide information about bound structures that do not contribute to the fluorescent signal produced by labels at the 5′ end of the dsDNA, as illustrated schematically in Supplementary Figure S4D. Thus, we also conducted competitive binding experiments that combined ssDNA-RecA filaments with labeled dsDNA and unlabeled dsDNA. For the experiments shown in Figure 4 the labeled and unlabeled dsDNAs were identical except for the labels, and the concentration of the labeled dsDNA was always the same as the concentration of the ssDNA-RecA filaments. Only the concentration of the unlabeled competitor varied.
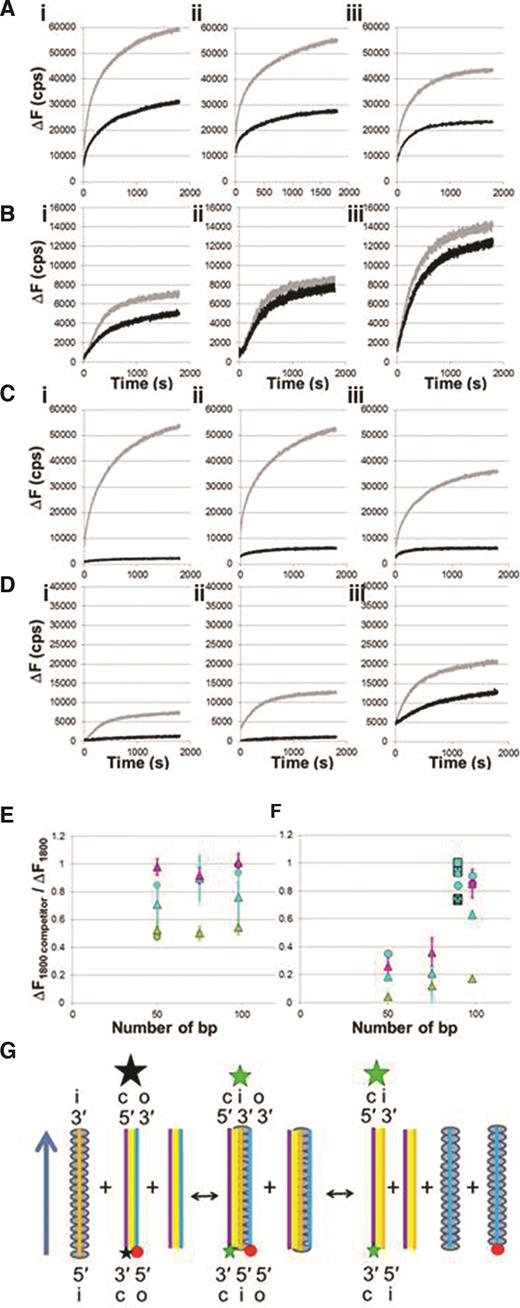
Competition experiments measuring ΔF versus time in the presence or absence of unlabeled dsDNA for various dsDNA lengths. (A) Strand exchange experiments with 98 nt filaments incubated with 50 bp (i), 75 bp (ii) and 98 bp (iii) dsDNAs in ATPγS in the absence (gray) and presence (black) of 1× concentration of identical unlabeled dsDNA; filament : total dsDNA ratio = 1:2. (B) Same as (A) in ATP. (C) Strand exchange experiments with 98 nt filaments and 50 bp (i), 75 bp (ii) and 98 bp (iii) dsDNA in ATPγS in the absence (gray) and presence (black) of 6x concentration of identical unlabeled dsDNA; filament : total dsDNA ratio = 1:7. (D) Same as (C) in ATP. (E) Summary of the ratio of ΔF1800 values in the presence and absence of competition as a function of dsDNA length. The green, cyan and magenta points represent results for ATPγS, ATP and dATP as cofactors, respectively. The triangles and circles correspond to dsDNA samples with the fluorescein label on the complementary and outgoing strands relative to the ssDNA incoming strand, respectively. The squares represent results obtained with internal labels. The asterisk and the cross are nearly superimposed and represent labels on the complementary strand positioned 10 and 36 bp from the 5′ end. The empty square and the square with the plus sign correspond to internal labels on the outgoing strand positioned 10 and 36 bp from the 3′ end. (F) Same as (E) but for 6x concentration of unlabeled dsDNA competitor. (G) Interactions showing that when the heteroduplex cannot unbind from the filament it leads to intermediate three-strand exchange products that only allow for filament recycling if the heteroduplex dsDNA unbinds.
Figure 4A shows results for measurements in the presence of ATPγS. In these experiments, the concentration of labeled and unlabeled dsDNA was the same, so the total dsDNA concentration was twice the concentration of the ssDNA-RecA filaments. Both the labeled and unlabeled dsDNAs began interacting with the ssDNA-RecA filaments at the same time. ΔF versus time curves for 98-nt ssDNA-RecA filaments initially mixed with sequence matched 50 bp dsDNA (i), 75 bp dsDNA (ii) and 98 bp dsDNA (iii) are shown. In all cases, the presence of the competitor reduces the final fluorescence value by ∼50%, consistent with the formation of stable strand exchange products that remain bound to RecA and block interactions with free dsDNA.
We also performed additional experiments where the unlabeled dsDNA was added 5 min before the labeled dsDNA (Supplementary Figure S8A). Those experiments showed suppression of ΔF consistent with the unlabeled dsDNA forming strand exchange products that remain bound to RecA and prevent labeled dsDNA from undergoing strand exchange. Thus, these competition results suggest that if ATPγS is the cofactor, for dsDNA with N >∼50 bp strand exchange forms heteroduplex products that remain bound to RecA. Importantly, when ATPγS is the cofactor the influence of the competitors is similar for 50, 75 and 98 bp dsDNA. Figure 4B is analogous to Figure 4A except that ATP is the cofactor instead of ATPγS. These results indicate that the presence of the competitor (1:1 ratio for unlabeled and labeled dsDNAs) barely shifts the ΔF values. Similar results are obtained in the presence of dATP (Supplementary Figure S8B). If most filaments could not perform strand exchange, but all the filaments that could perform strand exchange created bound heteroduplex dsDNA, then the competitor (1:1 ratio) should have a strong effect, but it does not. Thus, Figure 4B and Supplementary Figure S8B eliminate the possibility that the low ΔF1800 values shown in Figures 1 and 2 result from a dearth of ssDNA-RecA filaments that are capable of performing strand exchange.
One interpretation of the data shown in Figure 4B and Supplementary Figure S8B is that hydrolysis destabilizes the products and causes them to rapidly reverse, leaving most ssDNA-RecA filaments free to interact with labeled dsDNA. If this interpretation is true, larger concentrations of unlabeled competitor will increase the probability that unlabeled dsDNA will remain bound to RecA. At sufficiently high concentrations of unlabeled dsDNA, most of the ssDNA-RecA filaments will form bound heteroduplex products with unlabeled dsDNA. As a result, large concentrations of unlabeled dsDNA should suppress the ΔF signal. Thus, to test whether the results shown in Figure 4B and Supplementary Figure S8B imply that bound heteroduplex products are highly reversible, we performed additional experiments in which the concentration of the unlabeled dsDNA competitor was higher than the concentration of the labeled dsDNA. Figure 4C and D are analogous to Figure 4A and B except the unlabeled dsDNA had 6x the concentration of the labeled dsDNA. In the presence of hydrolysis, the high competitor concentration (6×) has a strong effect on dsDNA with lengths <∼75 bp. In contrast, for 98 bp dsDNA in the presence of hydrolysis even 6x concentration of unlabeled dsDNA only slightly reduces the measured fluorescence values.
Figure 4E and F summarizes the results of the competition experiments. The graphs show the ratio of the ΔF1800 values obtained in the absence of the competitor to the results obtained in the presence of the competitor in ATPγS (green symbols), ATP (cyan symbols) and dATP (magenta symbols). The shape of the markers corresponds to the position of the label with respect to the ends of the initiating strand in the ssDNA-RecA filament. The triangles represent data with the fluorescent labels on the 5′ end relative to the filament, and the circles represent data with the fluorescent labels on the 3′ end relative to the filament. All of the green markers have values of ∼ |$\frac{1}{2}$|. Thus, consistent with the results shown in Figure 1 and Figure 4F in ATPγS strand exchange products remain bound for very long times if the dsDNA contains 50 or more contiguous homologous base pairs.
In contrast, for dsDNA length 50 bp or longer in the presence of hydrolysis the ratio is significantly greater than |$\frac{1}{2}$|. Experiments where the unlabeled dsDNA was added to the filament 5 minutes before the labeled dsDNA show that the presence of the competitor does not significantly alter the ΔF vs. time curves (Supplementary Figure S8A). Again these results are consistent with Figure 1 and suggest that strand exchange products do not remain stably bound to the filament. As a result, most of the original ssDNA-RecA filaments remain free to interact with free dsDNA. Though Figure 4E shows similar results for all of the dsDNA lengths, Figure 4F shows that when the dsDNA length is 90 or 98 bp the competitor reduces the ΔF signal much less than it does when the dsDNA length is 50 bp. That reduced competitor efficiency could result if products produced by 90 or 98 bp dsDNA are even more unstable than the products produce by 50 bp dsDNA, but that explanation is not consistent with the increase in ΔF signal when the dsDNA length increases from 50 to 98 bp.
An alternate explanation is illustrated in Figure 4G which indicates that the competitor might have no effect if the heteroduplex dsDNA unbinds from site I after strand exchange and a new filament was then formed with the free outgoing strand that unbound from site I. This new filament would be free to interact with labeled dsDNA or heteroduplex dsDNA that has unbound from a filament. Moreover, results where the unlabeled dsDNA is added 5 min before the addition of labeled dsDNA suggest that the unbinding of the outgoing strand and formation of new filament are fast events.
Eventually, at equilibrium half of the dsDNA would include fluorescent labels at the ends of both strands and half would include a fluorescent label at the end of one strand. Similarly, half of the filaments would include unlabeled ssDNA while the other half would include rhodamine labeled ssDNA that was originally part of the fluorescently labeled dsDNA. Importantly, for 98 bp dsDNA interacting with 98 nt filaments in dATP, the ΔF1800 value is consistent with half of the fluorescein labeled ssDNA being bound to unlabeled ssDNA and half being bound to rhodamine labeled ssDNA (Figure 5 and Supplementary Figure S5). Figure 5 also shows average ΔF versus time curves for the three cofactors, as well as the standard deviations for each curve. More than 10 measurements contributed to each average curve.
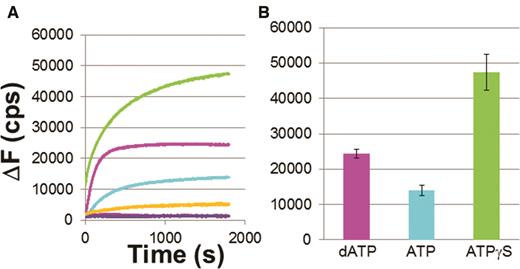
Progression of strand exchange for 98 nt –RecA filaments and 98 bp dsDNA. (A) Average of change in fluorescence for 10 curves in ATPγS (green), dATP (magenta) and ATP (cyan) and standard deviation values for ATPγS (orange), dATP (blue) and ATP (purple). (B) Bar graph for the curves shown in (A).
In sum, the results of the competitive binding experiments suggest that in the presence of ATPγS, product formation is nearly irreversible for dsDNA N > ∼36 bp. In contrast, when ATP or dATP is the cofactor, for dsDNA with lengths <∼75 bp, products remain highly unstable.
In the presence of hydrolysis, for dsDNA longer than ∼80 bp, the majority of the filaments do not have any bound dsDNA and the majority of the dsDNA is not bound to any filament. At equilibrium almost half of the dsDNA consists of two labeled strands (quenched), whereas the other half consists of heteroduplex product dsDNA in which a labeled complementary strand is bound to an unlabeled ssDNA that was originally in an ssDNA-RecA filament.
Probability that sequence matched products reverse before extending to Lprod ∼ 80 bp
In the experiments that we have considered so far, the fluorophores were attached to the end of the dsDNA corresponding to the 5′ end of the filament or the 3′ end of the filament; however, in this section we will discuss additional experiments with fluorescent labels placed at various positions inside the dsDNA (Figure 6A). The labels are attached to T bases at positions 9, 19, 36 and 56 for fluorescein and 11, 20, 38 and 58 for rhodamine. For simplicity, we will define the positions of those labels as d = 10, 20, 36 and 56, respectively. If the entire length of a dsDNA molecule is incorporated in a product, then the fraction of internal fluorescein that is paired with an internal rhodamine will be insensitive to the location of the internal labels. In contrast, if some products do not extend along the entire length of the dsDNA, then the fraction of fluorescein labels paired with rhodamine will depend on the internal label position.
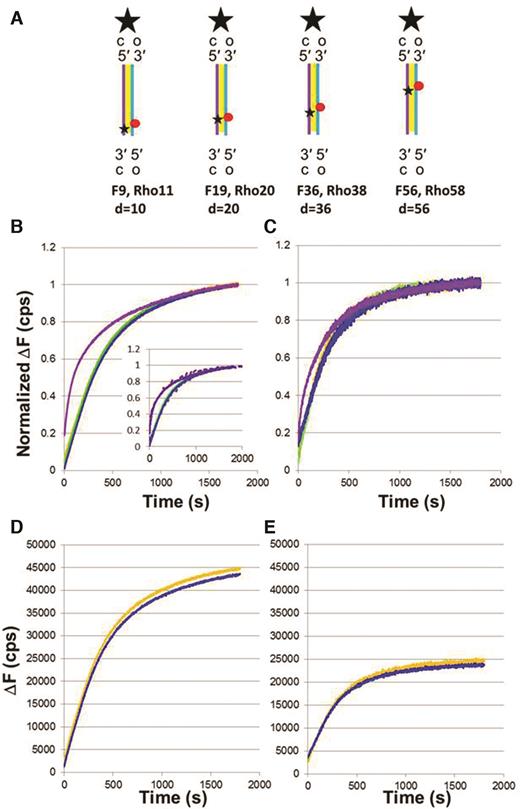
Results with experiments with fluorescent labels at various positions along the dsDNA. (A) Schematic representation of the 90 bp dsDNAs showing the position of the internal labels fluorescein (F) and rhodamine (Rho). (B) Normalized ΔF versus time curves for 98 nt ssDNA-RecA filament, 90 bp dsDNAs with internal labels at position d, and ATP; orange, green, blue, and purple lines correspond to labels d = 10, 20, 36 and 56, respectively. The inset shows the fit obtained with a simplified model (dashed lines); for details, see Supplementary Data. (C) Same as (B) for 75 nt ssDNA-RecA filament. (D) Total fluorescence for 98 nt ssDNA-RecA filament, 90 bp dsDNA containing internal labels at position d, and ATP; orange and blue lines correspond to labels d = 10 (average of five curves) and 36 (average of three curves). (E) Total fluorescence for 75 nt ssDNA-RecA filament, 90 bp dsDNA containing internal labels at position d, and ATP; orange and blue lines correspond to labels d = 10 (average of three curves) and 36 (average of three curves).
Figures 4 and 5 suggest that for 98 bp dsDNA interacting with 98 nt filaments, at long times, the measured emission should be dominated by the fluorescence due to half of the free dsDNA that includes an unquenched fluorescein label on the complementary strand. The remaining half of the free dsDNA molecules will include both fluorophores (quenched), so they do not contribute significantly to the total signal. Thus, we can compare results obtained using different labels by normalizing the fluorescence versus time curves.
Figure 6B and C shows such normalized results. Our results show no statistically significant differences between labels at positions 10, 20 and 36. The similarity of the normalized curves is consistent with the fluorescence for those labels being dominated by the emission from fairly stable heteroduplex products that extend over positions 10, 20 and 36. If those products are unbound heteroduplex dsDNA, those products should also contribute to the emission from the label at d = 56 bp. If those products were the only contribution, the normalized emission from the label at d = 56 bp would match the emission from the other labels, but it does not.
In particular, the normalized curves for the 56 bp dsDNAs have a much larger initial fluorescence value and a much larger initial slope than the curves for the other labels. The difference between the results for the labels at 10, 20 and 36 bp and the label at 56 bp could be explained if some strand exchange products initiate at a position between 36 and 56 bp and then progress in the 5′ to 3′ direction with respect to the filament. Such products would not be detected by the labels at 10, 20 and 36 bp, but would be detected by a label at 56 bp. The normalized curves for 75 nt filaments interacting with 90 bp dsDNA are similar to those for 98 nt filaments, even though these interactions rarely form irreversible products.
Un-normalized fluorescence values also offer information on the distribution of strand exchange products. For example, the fluorescence efficiency for the probes at positions d = 10 and d = 36 are similar (Figure 6D and E), which allows us to compare the un-normalized curves for the labels at the two positions. Comparison of the un-normalized curves for the two labels does not reveal statistically significant differences for either the 98 nt or 75 nt filaments, supporting our suggested interpretation of the normalized curves.
In an attempt to better understand these results, we considered a very simplified model (Supplementary Data) with the following features: (i) The probability of initiating strand exchange is the same at all positions along the dsDNA. (ii) All sequence matched interactions create products that extend to at least 40 bp before reversing, though in reality there would be a distribution of maximum lengths that could involve reversal of products as short as 8 bp. (iii) Hydrolysis-driven unbinding of the heteroduplex from the filament takes place once Lprod extends to ∼80 bp. (iv) The life of strand exchange products attached to the nucleoprotein filament is decreased if strand exchange products are attached to dsDNA that is not yet incorporated in the product and can interact with terminal domains in the RecA monomers in the filament. Simulated fluorescence curves based on this model are shown in the inset of Figure 6B. Given the extreme simplicity of the model, it is remarkable that the major features of the data are captured.
Structure results
Previous work had shown that homology recognition can occur in the absence of ATP hydrolysis (38,39); however, Figure 2 suggests that hydrolysis does play a significant role when homology testing extends beyond 8 bp. In order to investigate possible roles for hydrolysis, we considered the structure of the RecA filament in the presence of hydrolysis using simulation techniques that are similar to those we used to investigate the 8 bp interaction (40).
In the absence of hydrolysis, RecA filaments are periodic helical structures with about 18 bp/helical turns (11). In the searching filament, the ssDNA is bound to the primary binding site, and after strand exchange the heteroduplex is bound to the same primary binding site (11). Both experiments and molecular dynamics simulations indicate that the structure of dsDNA bound to the primary binding site is extremely stable (33,40). The dsDNA is divided into nearly B-form triplets separated by large rises in which protein residues M164 and I199 intercalate (11). This contributes to a large extent to the stabilization of the extended dsDNA structure (40).
The structure of RecA filaments with ADP uniformly bound in the ATP binding site and no bound DNA has been known for a long time (41); however, little information is available on the structure of filaments in which some of the bound ATP has been hydrolyzed to ADP, except that such filaments are highly flexible (23–27). In contrast, previous results (24) and the single molecule data suggest that filaments formed in ATPγS are not very flexible. The flexibility observed in the presence of hydrolysis may indicate the existence of structural perturbations within the filament that may arise from local changes in the monomer-monomer binding modes (28). In what follows, we will call ATP (resp. ADP) interface, the interface between two consecutive monomers in the binding geometry favored by ATP (resp. ADP). How the structure of the dsDNA can adapt to such perturbations is presently unknown.
Figure 7A shows a structure with three DNA strands bound to a filament with ATP bound at 5 consecutive protein interfaces and ADP occupying the remaining ATP binding site (for clarity, the protein filament is not represented here but can be seen in Figure 7B of reference (28)). The ADP is indicated in red and the ATP in green. We obtained this structure by placing the three DNA strands in their known post-strand exchange binding sites and then allowing the structure to relax. After relaxation, we ran molecular dynamics (MD) simulations in a fully solvated environment that allowed the relaxed structure to evolve (Supplementary Data). A similar approach was used to study the evolution of the nucleoprotein filament during the initial 8 bp test (40).
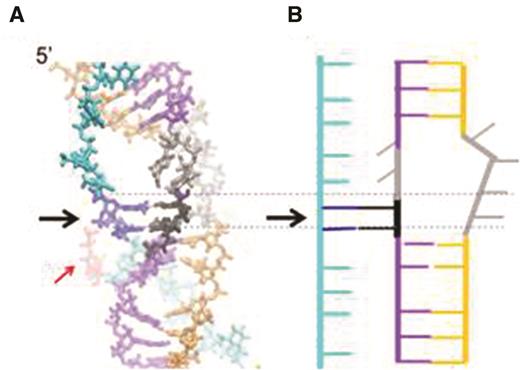
Structure for three dsDNA strands bound to a RecA filament with ATP bound at five consecutive protein interfaces and ADP occupying the remaining ATP binding site. (A) The cyan, purple and orange DNA strands correspond to the outgoing, complementary and initiating strands, respectively. The two black bases are the complementary strand bases that have returned to pair with the outgoing strand bases shown in dark blue. The black arrow points to the region where strand exchange has reversed. The two gray bases in the complementary strand and the two gray bases in the initiating strand are not paired. The ADP is indicated in red. (B) Schematic representation of the structure shown in (A).
Figure 7A shows the fairly stable structure that the DNA strands assume after one hundred ns of MD simulation. In regions further than two monomers from the ADP interface, the DNA structure, which is very similar to the structure in the unperturbed RecA/ATP filament (40), does not show any significant variation along the MD trajectory, but in regions near the ADP interface, the DNA structure shows a noticeable evolution during the 100-ns trajectory. Importantly, rotation of two complementary strand bases results in the formation of Watson–Crick and Hoogsteen interactions between these bases (shown in black) and their original strand exchange partners in the outgoing strand. In the snapshot presented in Figure 7A, the heteroduplex is locally melted near the ADP-bound monomer. In that region, four bases in the initiating strand are unpaired, but only two complementary strand bases are unpaired since the other two complementary strand bases that have lost their interactions with the initiating strand have returned to their original partner bases in the outgoing strand. During the strand exchange process, many ATP molecules get hydrolyzed all along the filament. If the monomers bearing the resulting ADP molecules are sufficiently far away from each other, for example in the case of hydrolysis waves characterized by correlated hydrolysis events (42), then the simulation suggests that local heteroduplex melting and reverse strand exchange would occur near each of those monomers, but that the heteroduplex remains very stable in regions separated from the ADP by a few ATP-bound RecA monomers.
Calculation of the influence of parallel sequence matched products separated by ∼ 180 bp
Importantly, almost all long repeated sequences that need to be rejected by RecA mediated homology recognition extend over less than 1000 bp, and a local test of 20 bp is sufficient to discriminate against accidental homology in vivo; therefore, simultaneous parallel 20 bp homology tests separated by ∼200 bp could discriminate between homologous pairings and pairings between different copies of long repetitive sequences (DCLRS) (22). Such parallel testing of regions that can produce separated sequence matched products occurs along with parallel testing of regions that cannot produce separated sequence matched products (43).
Importantly, we are considering the parallel sequence matched products (44) that are correlated because the formation of one correct metastable strand exchange product positions nearby regions of the dsDNA near locations where they can also establish correct strand exchange products. We will assume that if one sequence matched product reverses it can be rapidly reestablished as long as at least one other sequence matched product remains, so loss of homologous registration requires that all sequence matched products unbind simultaneously. For the correlated products formed by homologous pairing, the probability that all the products will unbind simultaneously depends on Rbound/free, the ratio of the time correct products spend bound to the time that elapses between the formation of correct products. Thus, the probability that a homologous pairing will reverse is of the order of (1/Rbound/free)n, which can be very small even if each individual site has a very low probability of forming an irreversible product. In sum, homologous pairings would almost always produce irreversible products because all of the n highly reversible sequence matched products are unlikely to unbind simultaneously even though each sequence matched product is likely to reverse many times. In contrast, DCLRS only establish one highly reversible sequence matched product that is unlikely to become irreversible. As a result, the correlations between binding sites enhance stringency without sacrificing searching speed.
DISCUSSION
Possible structural origin for the instability of strand exchange products when hydrolysis is present
So far we have not discussed the rate at which strand exchange products reverse. Previous modeling of strand exchange as a kinetic process indicated that if reverse strand exchange progresses iteratively through successive triplets at a rate similar to the forward strand exchange rate, then for long products strand exchange reversal will be much slower than catastrophic reversal of strand exchange products (45). The structural results shown in Figure 7 provide a possible mechanism for such catastrophic reversal and may explain why the increase in product stability as a function of Lprod is so much slower in the presence of hydrolysis than it is in the absence of hydrolysis. In particular, the perturbed filament with mixed ATP/ADP shows that regions of stable heteroduplex product are separated by regions in which the complementary strand bases are paired with their original partners, as well as regions where none of the bases in the three strands are paired. Importantly, the extended unsupported complementary strand backbone connects heteroduplex product regions that are separated by regions in which the heteroduplex is melted. Those melted regions even include complementary strand bases that have undergone reverse strand exchange.
We speculate that collective interactions between melted and unmelted regions of the heteroduplex could make the unmelted heteroduplex regions more unstable. This increased instability due to regions of the complementary strand with unpaired bases may be analogous to the collective interactions that produce a decrease in melting temperature and an increase in stringency when dsDNA is formed with ssDNA that contains periodically spaced abasic sites (46). Those sites divide the dsDNA into groups of Watson–Crick paired bases separated by a region of disrupted stacking that destabilizes the pairing of neighboring bases just as the ADP interfaces divide the paired heteroduplex bases into groups whose pairing is destabilized near the interfaces. In dsDNA formed with abasic sites that divide the dsDNA into groups of four bases, the melting temperature for 35 bp homologous dsDNA was ∼30°C, whereas in the absence of abasic sites the melting temperature for the same sequence was ∼80°C. Thus, the stability increase with length was much smaller if abasic sites were present. Furthermore, the melting was catastrophic in the system with abasic sites, but the melting was local in the system without abasic sites (46).
Outline of the proposed homology recognition system
An increasing body of work suggests that RecA mediated strand exchange can occur on a biologically relevant timescale because almost all mismatched pairings are rejected by a very rapid homology test that considers only ∼8 bp (16,33,40), and may test homology faster (40) than the ∼ 6 bp/second rate characteristic of later stages in strand exchange (42). This first testing stage (Stage 1) is followed by Stage 2 in which the homology test involves ∼9 to 20 contiguous base pairs. In vivo, 8 bp sequences have ∼100 accidental matches within a bacterial genome (20); however, almost no 20 bp sequence has an accidental match. Previous experimental work suggests RecA iteratively tests successive triplets to extend the 8 bp product to ∼ 20 bp (47). Once Lprod >20 bp, the product includes more than one helical turn, and in the presence of hydrolysis the nucleoprotein filament includes at least one ADP interface; therefore, structural features and the in vivo distribution of accidental matches are both compatible with Lprod ∼20 bp representing a boundary between recognition stages.
Modeling suggests that kinetics of iteratively extending homology testing from ∼20 to 80 contiguous base pairs (Stage 3) improves stringency (31) by rejecting mismatched pairings that experiments have shown can pass Stage 2 (33). Stage 3 also provides time to establish multiple sequence matched products separated by ∼180 bp.
Discrimination against DCLRS is possible by establishing several reversible sequence matched products separated by ∼180 bp (Stage 4) while ATP hydrolysis driven unbinding of a heteroduplex product from the filament once Lprod > ∼80 bp finally allows homologous pairings to become irreversible (Stage 5).
Support for the proposed homology recognition system
Figures 1 and 2 consider homology recognition for interactions involving dsDNA with 15 ≤ N ≤ 75 bp. Such sequences can create strand exchange products that contain up to N contiguous sequence matched base pairs. Figures 1 and 2 show that in the presence or absence of hydrolysis, the stability of the heteroduplex bound to the filament increases strongly with Lprod until a plateau is reached at Lprod ∼ 20.
In vivo studies of product formation as a function of N, the number of contiguous sequence matched bp, were unable to detect products with N < 20 bp (8), but the probability of finding products increased exponentially with length as N increased from 20 to ∼ 75 bp (17,18). The dotted black line in Figure 2E shows the in vivo results scaled to match the ΔF1800 values for in vitro results when N = 75 bp. The slope of the in vivo results decreased strongly and abruptly when N ∼ 75 bp, suggesting an important change in the behavior of strand exchange products (17,18).
We propose that in vivo and in vitro sets of data are consistent because the in vivo stringency is governed by the kinetics of extending reversible strand exchange products during Stage 2 and Stage 3, whereas the ΔF1800 values depend on equilibrium binding probabilities. Previous kinetic modeling (45) suggested that when Lprod < 80, adding mismatches to the product drives reverse strand exchange; however, once Lprod > ∼80 ATP hydrolysis makes the product irreversible. Thus, the model explains why the in vivo data shows that product formation is very sensitive to N for N < ∼75 bp, but insensitive to N for larger N.
If pairings that can produce sequence matched products extending over 75 bp always did so, RecA mediated homology recognition could not reject pairings between DCLRS. Figure 6 provides some information on whether or not interactions that can produce 80 bp products always do so, as we will discuss in the following.
If all strand exchange products begin at the 5′ end, fluorescence from labels near the 5′ end will have a higher initial slope and higher final emission value if not all the products reach the 3′ end or the lifetime of the products is shorter than the time required for strand exchange to progress along the filament. In contrast, if all strand exchange products begin at the 5′ end and create long lived products that extend all the way to the 3′ end, then all of the normalized curves would be the same. None of these conditions is consistent with our data; consequently, as discussed above, our results suggest that not all of the strand exchange products begin at the 5′ end.
In vivo, most dsDNA that binds to an ssDNA-RecA filament does not include a double strand break; therefore, it is reasonable to assume that in our in vitro experiments strand exchange can begin at positions other than the 5′ end of the dsDNA. If strand exchange initiation is equally probable at all positions along the dsDNA and all strand exchange processes create long lived products by reaching the 3′ end, then the emission ratio for a label at position d1 to a label at position d2 is d1/d2. Thus, the ratio of the emission from the label at d = 36 bp to the emission from the label at d = 10 bp would be 36/10 = 3.6, but the unnormalized values for the two labels were the same and Figures 1 and 2 suggest that the lifetime difference between 90 – 36 = 54 bp products and 90 – 10 = 80 bp products is not large. Thus, either initiation is distributed highly non-uniformly along the length of the dsDNA or not all products that initiate reach the 3′ end.
The simulation that produced the inset in Figure 6B assumed the fluorescence due to labels d = 10, 20 and 36 is dominated by long lived heteroduplex products that incorporate all or almost all of the dsDNA because partial products with 9 < s < 37 reverse rapidly before reaching the 3′ end. We speculate that the stability of the products is reduced by the presence of B-form tails, as illustrated in Figure 2. Some of the destabilization due to B-form tails may arise because of interactions between those B-form tails and terminal domains in the protein. If these speculations are true, products that initiate between d = 37 and d = 56 reach the 3′ end and stabilize because they are no longer attached to B-form tails that can interact with terminal domains in the RecA proteins (Figure 6B).
Previous work has already shown that ssDNA-RecA filaments formed with ATP as the cofactor are much more flexible than filaments formed with ATPγS as the cofactor (23–27) and that multiple separate sequence matched strand exchange products do form (20). Thus, previous work combined with the results shown in this work indicate that in vivo ssDNA-RecA filaments form multiple separate sequence matched products that are each very short lived. Pairings between DCLRS would only form one such product, so that product is highly likely to reverse. In contrast, homologous pairings will produce several products that are unlikely to all reverse before ATP hydrolysis driven unbinding of the heteroduplex from RecA makes the product irreversible.
The proposed model is summarized in Table 1.
Summary of the proposed model presenting each stage, the interaction involved, and the in vivo influence
| Stage | Interaction | Proposed in vivo influence |
|---|---|---|
| 1 | Homology test of ∼ 8 contiguous bp | Rapid filtering eliminates most mismatched pairings. |
| 2 | Homology test of ∼ 9 to 20 contiguous bp | Eliminates most pairings involving accidental homology. |
| 3 | Homology test of ∼20 to 80 contiguous bp | Improves stringency by rejecting mismatched pairings that pass Stage 2. |
| Provides time to establish multiple sequence matched products separated by ∼ 180 bp. | ||
| 4 | Establishment of several reversible sequence matched products separated by ∼ 180 bp | Allows discrimination against DCLRS. |
| 5 | ATP hydrolysis driven unbinding of a heteroduplex product from the filament once Lprod >∼80 bp | Allows homologous pairings to become irreversible. |
SUPPLEMENTARY DATA
Supplementary Data are available at NAR Online.
ACKNOWLEDGEMENTS
We thank Prof. S.C. Kowalczykowski for helpful discussions and Aya Eldaouk for preliminary experiments previous to this work.
FUNDING
Harvard University funds (to M.P.); ‘Initiative d’Excellence’ program from the French State [‘DYNAMO’, ANR-11-LABX-0011-01 to C.P.]; GENCI-CINES [2016-[x2016077438]]. Funding for open access charge: Harvard University funds (to M.P.).
Conflict of interest statement. None declared.
REFERENCES

Comments