


Abstract
Phages invade microbes, accomplish host lysis and are of vital importance in shaping the community structure of environmental microbiota. More importantly, most phages have very specific hosts; they are thus ideal tools to manipulate environmental microbiota at species-resolution. The main purpose of MVP (Microbe Versus Phage) is to provide a comprehensive catalog of phage–microbe interactions and assist users to select phage(s) that can target (and potentially to manipulate) specific microbes of interest. We first collected 50 782 viral sequences from various sources and clustered them into 33 097 unique viral clusters based on sequence similarity. We then identified 26 572 interactions between 18 608 viral clusters and 9245 prokaryotes (i.e. bacteria and archaea); we established these interactions based on 30 321 evidence entries that we collected from published datasets, public databases and re-analysis of genomic and metagenomic sequences. Based on these interactions, we calculated the host range for each of the phage clusters and accordingly grouped them into subgroups such as ‘species-’, ‘genus-’ and ‘family-’ specific phage clusters. MVP is equipped with a modern, responsive and intuitive interface, and is freely available at: http://mvp.medgenius.info.
INTRODUCTION
It has been increasingly recognized that microbiome can play crucial roles in human health (1–3), diseases (4–10), responses to drugs and treatments (11,12), development (13–15) and many other aspects of human life (16–19). However, due to limited availability of tools that enable researchers to manipulate microbiome, it is often difficult to directly infer causal relationships from the correlated alterations in microbial community structures and host phenotypes (e.g. health statuses) under different conditions (20–23). Experimental procedures such as fecal microbiota transplantation (24,25) and/or the use of germ-free mice (3,26) can be used to identify and validate causal factors, but they are neither easy nor cheap. Furthermore, due to the lack of general purpose tools that could manipulate microbiota at species level, it is difficult to directly pinpoint the causal species.
Phages are known to be key players in microbial communities; they could invade microbes, accomplish host lysis and are of vital importance in shaping the community structure of human and environmental microbiota (27–29). More importantly, phages could provide potential tools for the precision manipulation of environmental microbiota: it is known that phages have rather narrow host ranges, mostly at the species or genes levels (30); they are thus ideal tools to target (and eliminate) specific microbes at species-resolution while avoid potential ‘off-target’ effects. A recent study provided us with a great example for such an application; Yen et. al. successfully reduced Vibrio cholerae infection and colonization in the intestinal tract and prevents cholera-like diarrhea, by orally administrating V. cholera-specific phages in model animals (31).
We thus developed MVP—a microbe-phage interaction database (MVP stands for Microbe Versus Phage), with the main aims being to provide researchers with a comprehensive catalog of phage–microbe interactions and assist them to select phage(s) that can target (and potentially to manipulate) specific microbes of interest.
In addition to experimental methods, microbe–phage interactions can be identified by taking advantage of the large-scale genomic- and metagenomic sequencing efforts. For example, it is known that many phages insert their genomes into that of their hosts; the integrated phages are known as prophages (32,33). Many computational tools exist and are able to identify prophages from complete prokaryotic genomes and/or assembled metagenomic contigs (34–36). In addition, CRISPR spacer sequences can also be used to infer host–phage interactions (37,38), although their short lengths (usually 24–50 bp) in nature make it difficult to reliably determine their source phages (27,37).
In this study, we obtained in total 50 782 viral sequences from various sources and assembled them into 33 097 unique viral clusters. We identified 26 572 interactions between 18 608 viral clusters and 9245 prokaryotes, and calculated the host range for each of the phage clusters accordingly. We presented these data and related information in an online database MVP (Microbe Versus Phage); we designed MVP to be a modern website with a responsive and intuitive interface, and incorporated many widgets (i.e. functional elements of a web page that serve specific purposes) that enables users to effortlessly explore all contents and find what they are interested in.
DATA GENERATION
Viral sequences and clustering them into viral clusters
We obtained viral sequences from the following four sources.
First, we downloaded all available viral sequences from the NCBI viral genomes resource (39).
Second, we identified putative prophage sequences from complete bacterial and archaeal genomes downloaded from the NCBI prokaryotic reference genome database (40) and EMBL proGenomes database (41).
Third, we identified putative prophage sequences from assembled metagenomic sequences derived from the human gut. We included in the current version of MVP two human gut metagenomic datasets containing 124 (1) and 1267 (42) human fecal samples respectively that we downloaded from the EBI metagenomic database (43). Prophage identification was carried out using a phage_finder (34) tool v2.1 (last updated: 26 Oct 26 2011) with default parameters.
Last, we included viral and prophage sequences from several published datasets (44,45), including those from a ‘Uncovering Earth's virome’ project, and the International Committee on Taxonomy of Viruses (https://talk.ictvonline.org; ICTV). Worth to mention is the recent work by Roux et al.; by using a virus/prophage identification tool VirSorter that they developed (36), they identified in total 12 498 high-confidence viral genomes by scanning the publicly available bacterial and archaeal genomic sequences. These newly identified viral sequences were either prophages or un-incorporated viral sequences that were previously annotated as plasmids (45).
In total we collected 50 782 viral sequences from these sources. We next used a cd-hit-est program (46) to cluster them into clusters based on sequence similarities. As previously suggested (27), the following options of cd-hit-est were used: -c 0.95 and -aS 0.85. The ‘-c’ option specifies the sequence identity threshold and is calculated as the number of identical nucleotides in alignment divided by the full length of the shorter sequence, while the ‘-aS’ option specifies alignment coverage threshold and is defined as the proportion of shorter sequence covered by the alignment. Sequences in alignments with measurements above these thresholds are clustered; the longest sequences in a cluster is chosen as representative of the cluster. Please note that the much relaxed parameter ‘–aS 0.85’ for clustering may not be used as a general-purpose threshold for viral studies because it could result in very inclusive cluster, but it suits our purpose nicely: with MVP we aimed to facilitate users to select phages that can specifically target a bacterium, therefore any phages with (putative) broad host-ranges should be marked and removed from the candidate list. A further relaxed threshold of ‘-c 0.8 –aS 0.85’ was also tested and resulted in ∼3% few clusters, suggesting that the viral clusters we obtained in this study were relatively stable.
In sum, we obtained 33 097 clusters from the 50 782 viral sequences.
We checked the overlap in phages from different sources. We found only a small proportion (∼19.5%) of phages were covered by multiple evidence (i.e. the same prophage sequence can be identified from multiple (meta-) genomic sequences); even lower proportion (∼9%) of the total phage clusters were covered by multiple data-sources. However, within a data source, the phage overlap ratios vary significantly; more importantly, they seem to correlate with the number of samples taken from the same niche environment (Table 1). For example, 57.4% of the identified phages are covered multiple times in the ‘Uncovering Earth's virome’ (44), which collected over 3000 samples around the world; this ratio is followed by 18.67% in the human gut, which in total ∼1700 samples were used to identified the phages (1,42). Conversely, the overlap ratio in the EMBL proGenomes database is only ∼0.6%, mainly due to the fact that only ‘representative’ genomes were presented in the dataset we used and the ‘redundant’ genomes were excluded (41). Thus the low overlap ratios in some data sources are mainly because of the diverse environments from which the genomes were sampled. These results further confirmed that phages indeed could have very narrow host range.
Overlaps in phages within data-sources
| Data source | # clusters | % overlap * | Notes |
|---|---|---|---|
| ‘Earth's virome’ project (44) | 5412 | 57.4% | Over 3000 samples were sequenced; most are environmental samples |
| Predicted prophages in human gut (1,42) | 1505 | 18.67% | ∼1700 fecal samples from two gut metagenomic studies (1,42) |
| Predicted viral and prophage sequences from complete and draft genomes (36) | 7117 | 18.07% | |
| Predicted prophages from NCBI complete genomes (40) | 6964 | 15.4% | All available complete prokaryotic genomes (as of May 2017) |
| NCBI reference viral genome database (39) | 776 | 0.64% | |
| Predicted prophages from EMBL proGenomes database (41) | 3275 | 0.61% | Representative complete prokaryotic genomes (as of May 2017) |
| ICTV | 668 | 0 | Data obtained from the International Committee on Taxonomy of Viruses (https://talk.ictvonline.org; ICTV) |
* within each data-source, the overlap ratio is defined as proportion of phage clusters containing multiple sequences from the data source, out of the total phage clusters containing any number of sequences from the same data source.
| Data source | # clusters | % overlap * | Notes |
|---|---|---|---|
| ‘Earth's virome’ project (44) | 5412 | 57.4% | Over 3000 samples were sequenced; most are environmental samples |
| Predicted prophages in human gut (1,42) | 1505 | 18.67% | ∼1700 fecal samples from two gut metagenomic studies (1,42) |
| Predicted viral and prophage sequences from complete and draft genomes (36) | 7117 | 18.07% | |
| Predicted prophages from NCBI complete genomes (40) | 6964 | 15.4% | All available complete prokaryotic genomes (as of May 2017) |
| NCBI reference viral genome database (39) | 776 | 0.64% | |
| Predicted prophages from EMBL proGenomes database (41) | 3275 | 0.61% | Representative complete prokaryotic genomes (as of May 2017) |
| ICTV | 668 | 0 | Data obtained from the International Committee on Taxonomy of Viruses (https://talk.ictvonline.org; ICTV) |
* within each data-source, the overlap ratio is defined as proportion of phage clusters containing multiple sequences from the data source, out of the total phage clusters containing any number of sequences from the same data source.
Interactions between viral clusters and microbes
In this study we focused on prokaryotes (i.e. bacteria and archaea), and used prokaryotes and microbes interchangeably, although the latter can also include eukaryotic microbes. We also used viral- and phage- clusters interchangeably, under the circumstances that a virus invades a prokaryotic microbe.
We inferred interactions between viral-/phage- clusters and microbes from the following four sources.
First, we established phage-host relationships by extracting the ‘host’ fields from the annotation files downloaded from the NCBI reference viral genome database (39).
Second, we could easily establish the phage-host relationships for prophages identified in reference prokaryotic genomes.
Third, for prophages identified from assembled metagenomic contigs, their host information are not readily available. Therefore for each of the identified prophages, we first extracted the two flanking sequences from the contig, and submitted them as queries for BLAST searches (47) against prokaryotic reference genomes. We required that each flanking sequence should be at least 200 bp in size and at least 50 bp apart from the putative prophage. Predicted phages with flanking sequences shorter than 250 bp on either sides were discarded. We filtered out BLAST hits that had sequence similarity less than 0.95 or covered <80% of the query sequences. If there was only one hit left for a query, we used the corresponding species of the hit sequence as the putative host. For queries that matched multiple hits above the thresholds, we calculated the last common ancestor (LCA) of all hits in the NCBI taxonomic database using an in-house Perl script; we kept LCAs that had taxonomic ranking of genus or species according to the NCBI taxonomy database (40). Metagenomic sequences are a mixture of multiple species and are often highly fragmented. In addition, lateral gene transfers frequently occur and contribute significantly to the expansion of gene repertoire in prokaryotes (48). Together these factors make it technically challenging to accurately assemble metagenomic sequences (49–51). Therefore to reduce possible false-positive results, at the end we only kept the host–phage relationships if the identified hosts met the two following criteria: (i) both flanking sequences should match to some reference genomes, and (ii) the taxonomy ranks of the BLAST hits of the two flanking sequences should be the same.
To determine the error rate in host species identification using metagenomic data, we run the following simulations: we took randomly two fragments from a host genome, searched them against the NCBI prokaryotic sequence database using BLAST (47), and run the above analysis pipeline to determine the their species identity. We did this ten times for each of the complete prokaryotic genomes. At the species level, we obtained an overall accuracy rate of 95% with ∼90% sensitivity. However, when we removed the ‘source’ genome (i.e. the genome from which the two fragments were taken) from the analysis, the overall accuracy rate dropped to ∼79% at the species level with ∼50% sensitivity (i.e. about half of the queries were removed because of no significant BLAST hits in the genome, or the species assignment was ambiguous).
Last, we also obtained phage-host associations from published datasets (44,45) and databases such as the International Committee on Taxonomy of Viruses (ICTV; https://talk.ictvonline.org).
In total, we identified 30 321 host–phage associations, corresponding to 26 572 unique interactions between 18 608 viral clusters and 9245 prokaryotes. We summarized in Figure 1 the distribution of the 9245 prokaryotic hosts across the bacterial and archaeal phylogeny at the genus level and their associated phage clusters.
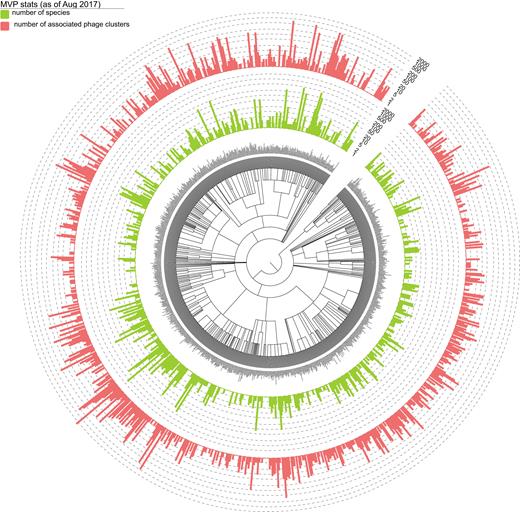
Distribution of the 9245 prokaryotic hosts across the bacterial and archaeal phylogeny at the genus level according to NCBI taxonomy and their associated phage clusters. For each bacterial and archaeal genus-level group, the number daughter species collected in MVP and the corresponding number of associated virial clusters (unique count) are indicated with light-green and red bars. Bacterial and archaeal species that are not collected in MVP are not shown. Bar heights are log-transformed. The tree and the datasets were visualized using Evolview, an online visualization and management tool for customized and annotated phylogenetic trees (55). An interactive version of the tree can be found at: http://www.evolgenius.info/evolview/#shared/mvp2017_stats/462.
We also check the overlap of prokaryotic hosts among different data sources. We found that 44.35% of the hosts were found in at least two data sources. We summarized in Table 2 the overlaps between each data source with all others.
Overlaps in host prokaryotes
| Data source | # hosts | % overlap with other data sources* |
|---|---|---|
| ICTV | 11 | 100% |
| ‘Earth's virome’ project (44) | 1247 | 79.4% |
| Predicted prophages from EMBL proGenomes database (41) | 2549 | 78.6% |
| Predicted prophages from NCBI complete genomes (40) | 4398 | 68.18% |
| Predicted prophages in human gut (1,42) | 210 | 67.61% |
| NCBI reference viral genome database (39) | 282 | 56.73% |
| Predicted viral and prophage sequences from complete and draft genomes (36) | 6388 | 56.6% |
* the overlap ratio is defined as proportion of hosts in a data source that could also found in any of the other data sources.
| Data source | # hosts | % overlap with other data sources* |
|---|---|---|
| ICTV | 11 | 100% |
| ‘Earth's virome’ project (44) | 1247 | 79.4% |
| Predicted prophages from EMBL proGenomes database (41) | 2549 | 78.6% |
| Predicted prophages from NCBI complete genomes (40) | 4398 | 68.18% |
| Predicted prophages in human gut (1,42) | 210 | 67.61% |
| NCBI reference viral genome database (39) | 282 | 56.73% |
| Predicted viral and prophage sequences from complete and draft genomes (36) | 6388 | 56.6% |
* the overlap ratio is defined as proportion of hosts in a data source that could also found in any of the other data sources.
In addition, 61.09% hosts associate with multiple phage clusters.
Calculation of host ranges of phage clusters
One of the main aim of MVP is to provide researchers with a list of phages that can specifically target certain bacteria of interests while avoid any ‘off-target’ effects. To achieve this, we calculated the host range for each of the phage clusters collected in MVP. For a phage cluster that infects only one host, we defined the host range as the taxonomic rank of the host in the NCBI taxonomy database; for a cluster that infects multiple hosts, we defined the host range as the taxonomic rank of the LCA of all its hosts in the NCBI taxonomic database.
As shown in Figure 2, we found that more than 99% phage clusters have host range at the ‘species’ or ‘genus’ levels. Excluding those with only one host (Figure 2A), or considering phage clusters with certain numbers of hosts (Figure 2B), the results remained largely the same, i.e. more than 90% of the remaining clusters have host range at the ‘species’ or ‘genus’ levels. These results are consistent with previous findings that phages often have very narrow host range (30), and further confirmed the high-quality of our data.
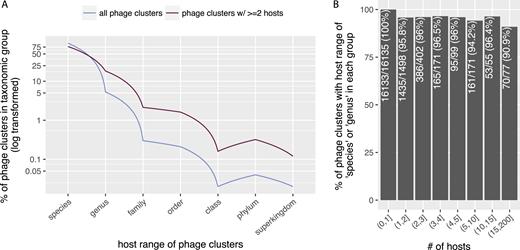
Most phage clusters have rather narrow host ranges. For phage clusters with at least two hosts, their host ranges were calculated as the LCAs in the NCBI taxonomic database (see ‘Data Generation’ for more details). (A) X-axis: host range of phage clusters, Y-axis: percentage of phage clusters (out of total) with their LCAs in the taxonomic groups. The Y-axis has been log-transformed. (B) X-axis: number of hosts (i.e. phage clusters were grouped into bins according to the numbers of hosts they have); ‘(5,10)’ specifies a subgroup in which phage clusters have >5 and ≤10 hosts. Y-axis, percentage of phage clusters (in each bin) that have host ranges at the ‘species’ or ‘genus’ levels in each subgroup.
WEB INTERFACE OF MVP
We provided MVP with a modern, responsive and intuitive interface. As explained in Figure 3, the design of the web pages, especially the use of a few powerful search widgets would allow users to easily find what they are interested in.
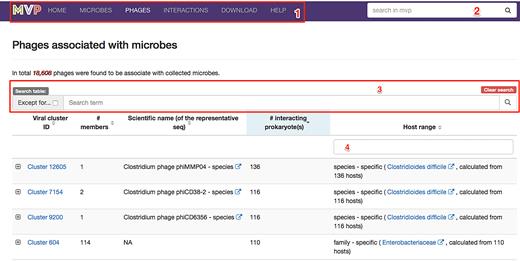
A screenshot of the ‘Phages’ page; highlighted are built-in widgets (i.e. functional elements of a web page that serve specific purposes) that enables users to easily find what they are interested. (1) a navigation toolbar that floats on top of the page, allowing users to access our data in pre-organized categories (i.e. ‘microbes’, ‘phages’ and ‘interactions’ and etc.); (2) a global search widget that enables uses to search for microbes and virial clusters with any information, including the taxonomy IDs, scientific names and taxonomic ranks, and then redirect to the corresponding page that the users choose; (3) a set of widgets allowing users to search for (or filter out when the ‘Except for…’ checkbox is selected) the contents of the table below (a list of phages in MVP in this case) with any keywords; (4) a widget allowing users to filter for phage clusters according to the values in the column of ‘Host range’.
We also incorporated into MVP a powerful network visualization tool that allows users to interactively visualize, interact and explore phage-host associations collected in our database. Please consult the Interactions page (http://mvp.medgenius.info/interactions) for details; shown in Figure 4 is a screenshot of the interaction network.
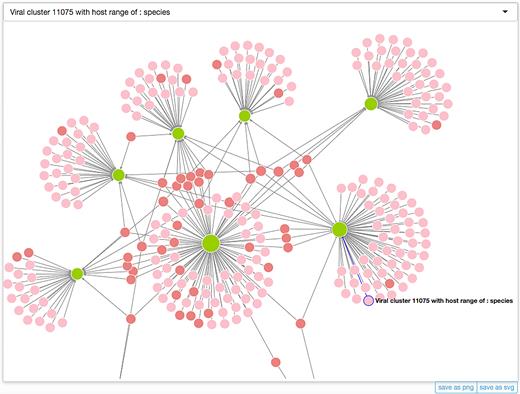
A screenshot of the interaction network (only partial) visualized with our built-in visualization tool. Microbes and phage clusters are visualized as light green and pink/reddish circles, respectively, with their sizes (diameters) being propositional to the numbers of the interacting partners (including also those that may not be shown in the visualization). Two colors, namely pink and reddish are used for phages, in order to distinguish those that infect only one host (pink) from those that infect multiple hosts (reddish). Click the text-labels next to the circles, users will be redirect the page for the corresponding microbe or phage cluster. In addition to the canvas, two additional widgets are also provided. The first is the selector at the top of the canvas, from which users can browse or search for a node of interests, select it from the drop-down menu and highlight it and bring it into the middle of the canvas. The other includes two buttons that can be used to export the visualization to an external file in either SVG or PNG format. For more information please consult the Interactions page (http://mvp.medgenius.info/interactions).
DATA ACCESS
All data are freely accessible to all academic users. This work is licensed under a Creative Commons Attribution 3.0 Unported License (CC BY 3.0). Users can download combined data from the ‘DOWNLOAD’ page. Users can also download data for individual viral clusters from the ‘PHAGES’ page.
FUTURE DIRECTIONS
During the development of MVP we came across numerous resources and tools that would make our database more complete and better. Also due to limitations of current methods, we wish to thoroughly test and benchmark existing tools/analysis pipeline before we include their results into MVP. Therefore our plans for the near future will include: (i) to use more tools, especially those that were recently developed for the identification of prophage and viral sequences, including virFinder (52), PHASTER (35) and VirSorter (36); (ii) to include more metagenomics datasets from the EBI Metagenomic database (43), (iii) to infer and include putative host–phage interactions from CRISPR-spacer sequences; the latter can also be used to infer bacterial-/archaeal- resistance to phages, and is a vitally important player in the phage-host interaction network and (iv) to compile sets of microbes according to their niche environments (i.e. soil or human gut), and re-calculate host-ranges for phage clusters that could interact with them. Finally, it has been shown that virus and their host genomes often share certain similar genomic features such as oligonucleotide frequency patterns (53,54). We will thus also include such measurements for the phage–host interactions in MVP calculated from existing tools such as VirHostMatcher (54).
FUNDING
National Natural Science Foundation of China [31770132, 81572050 to Z.L.].
Conflict of interest statement. None declared.
REFERENCES
Author notes
These authors contributed equally to the paper as first authors.

Comments