


Codon substitution models have traditionally attempted to uncover signatures of adaptation within protein-coding genes by contrasting the rates of synonymous and non-synonymous substitutions. Another modeling approach, known as the mutation–selection framework, attempts to explicitly account for selective patterns at the amino acid level, with some approaches allowing for heterogeneity in these patterns across codon sites. Under such a model, substitutions at a given position occur at the neutral or nearly neutral rate when they are synonymous, or when they correspond to replacements between amino acids of similar fitness; substitutions from high to low (low to high) fitness amino acids have comparatively low (high) rates. Here, we study the use of such a mutation–selection framework as a null model for the detection of adaptation. Following previous works in this direction, we include a deviation parameter that has the effect of capturing the surplus, or deficit, in non-synonymous rates, relative to what would be expected under a mutation–selection modeling framework that includes a Dirichlet process approach to account for across-codon-site variation in amino acid fitness profiles. We use simulations, along with a few real data sets, to study the behavior of the approach, and find it to have good power with a low false-positive rate. Altogether, we emphasize the potential of recent mutation–selection models in the detection of adaptation, calling for further model refinements as well as large-scale applications.
Introduction
There has long been a great interest in characterizing the selective regimes involved in the evolution of protein-coding genes. Much of the focus has been on whether traces of molecular adaptation can be detected through the use of phylogenetic statistical methods, including likelihood-based models of codon substitution. The central idea of some of the most well-known codon substitution models is to estimate the ratio of the non-synonymous over the synonymous substitution rates, denoted dN/dS. Assuming no selection acting on synonymous mutations, a dN/dS greater than 1 indicates that non-synonymous substitutions accumulate more rapidly than expected in the absence of selection on them. Such a result is considered a typical signature of an adaptive process, and is indeed usually qualified as positive selection.
However, positive selection is rarely detected using such simple models. This is because adaptation most often operates on a background of strong purifying selection, against mutations that would disrupt conformational stability or other fundamental biochemical and cellular requirements. As a result, even in the presence of some adaptation, the overall of a protein is typically well below 1.
Hoping to increase statistical power, several variants of these codon models have been developed, most of which rely on the original idea of detecting a value of ω that would exceed 1. These variants, however, operate at a more fine-grained level—typically, at the level of individual branches (Yang and Nielsen 1998), sites (Nielsen and Yang 1998; Yang et al. 2000; Yang and Swanson 2002; Yang et al. 2005), or their combination (Yang and Nielsen 2002; Guindon et al., 2004; Zhang et al. 2005; Pond et al. 2011)—in the hope that positive selection is sufficiently concentrated, either in space or in time, to be detected in this more local fashion.
With this in mind, an important strategy has been to attempt to capture the modulations of ω along the sequence (Nielsen and Yang 1998; Yang et al. 2000; Yang and Swanson 2002; Yang et al. 2005). Technically, these site models assume that the codon sites along the gene sequence are composed of a mixture of several categories of sites, being either under negative selection (), in a neutral regime (ω = 1), or under positive selection (). The proportion of sites for which is typically estimated by maximum likelihood (e.g., as with the M8 model in Yang et al. 2000), and the model is tested against a null model without sites under positive selection (e.g., the M7 model in Yang et al. 2000).
When applied to genome-wide empirical data, site models uncover a number of interesting candidate genes under adaptation (Kosiol et al. 2008). On the other hand, these genes represent only a small fraction of the proteome (around 5%), and the fraction of sites inferred to be under positive selection among detected genes is also typically small (around 10%). This is in sharp contrast with alternative methods for measuring selection, comparing patterns of synonymous and non-synonymous polymorphism and divergence (McDonald and Kreitman 1991; Sawyer and Hartl 1992; Keightley and Eyre-Walker 2007; Eyre-Walker and Keightley 2009; Keightley and Eyre-Walker 2010; Galtier 2016), which tend to infer that a large fraction of non-synonymous substitutions might be adaptive (Sawyer et al. 2003; Halligan et al. 2010). A possible cause for the lack of power of site models could be that adaptive processes, rather than being intensely concentrated on a small number of sites, are more diluted over a larger number of positions across a functional region of a protein. In addition, even at the level of a single site, only a small subset of possible amino acid-changing mutations are likely to be adaptive at any given instant, whereas all other possible non-synonymous mutations at that site might still be highly deleterious, and thus subject to strong purifying selection.
Branch-site models represent a second strategy (Yang and Nielsen 2002; Zhang et al. 2005; Pond et al. 2011). Their motivation is to test for the presence of a short episode of adaptive evolution along a particular branch of a phylogenetic tree. These models are based on contrasting the patterns of synonymous and non-synonymous substitution rates along the branch of interest with those of the background provided by the remaining branches of the tree.
Branch-site models have uncovered many cases of putative episodes of adaptive evolution on some branches (Clark et al. 2003; Sawyer et al. 2004, 2005; Kosiol et al. 2008). By design, however, they have to assume that no adaptive regime operates along most of the tree (which can thus be taken as a meaningful neutral background) and are therefore inherently driven toward the detection of rare and isolated spikes of adaptive evolution. They are much less helpful in the case of proteins that are constantly under adaptation over very long evolutionary periods. In such situations, the putative episodes detected by branch-site models would merely be the emerging part of the iceberg—essentially, the branches over which adaptation has been strongest—revealing but a small fraction of the true extent of adaptation undergone by these proteins.
Under these mutation–selection models with constant fitness landscapes, the long-term evolutionary process is such that the protein-coding gene essentially fluctuates at the mutation–selection balance, maintaining itself around the optimum defined by the fitness landscape. We refer to this as a nearly neutral regime, since most mutations are deleterious (having a negative ) and are purified away by selection, whereas the mutations that reach fixation, the substitutions, are typically either mildly deleterious or mildly advantageous, being neutral on average (having ). As a result, the dN/dS induced by the modeling of purifying selection, which we refer to herein as ω0, is predicted to be in the 0–1 range (Halpern and Bruno 1998; Spielman and Wilke 2015). The extreme cases are also noteworthy: if, for some reason, all 20 amino acid have a very similar fitness, then , whereas if the fitness landscape is greatly dominated by a single amino acid, then .
Importantly, however, even if they capture only purifying selection, mutation–selection models with a constant fitness landscape nevertheless imply that, at mutation–selection equilibrium, some of the non-synonymous mutations (and half of the non-synonymous substitutions, owing to the time-reversibility of the Markov process; Yang and Nielsen 2008) are still characterized by a positive selection coefficient (). This connects to a more general point: that one should not identify purifying and adaptive evolutionary regimes with and (Mustonen and Lässig 2009). The distinction between purifying selection versus ongoing adaptation should primarily be seen as a more global question, not linked to the selection coefficients attached to specific mutations or substitutions, but instead, relating to the evolutionary regime followed by the protein under study: fundamentally, whether the protein of interest is at equilibrium under a fixed fitness landscape, or whether it is constantly challenged by changing ecological conditions or ongoing evolutionary Red-Queens, such that it is evolving under a constantly fluctuating fitness landscape. If the fitness landscape changes at a very high rate, and with sufficient amplitude, this may lead to situations where . However, one can readily imagine less extreme Red-Queen regimes that would remain unapparent to current dN/dS models. For instance, building on a mutation–selection framework with a site-heterogeneous amino acid fitness landscape assuming multiplicative fitness across codon sites, suppose a process where, at an average rate of 1 per Myr, a position of the protein is taken at random, and the amino acid fitness profile at that position is mildly changed. Each round of such a Red-Queen process mildly changes a profile at a different position, and each time for a potentially specific amino acid target. If the rate of the Red-Queen were to be reduced to 0, the protein-coding gene would be evolving in the nearly-neutral regime specified by Equation (2), typically inducing a dN/dS well below 1 (Spielman and Wilke 2015), as described above. In contrast, with the Red-Queen active, the protein sequence is tracking a constantly moving fitness optimum. Even in this regime, however, most non-synonymous mutations still tend to move the sequence away from the target and are therefore deleterious. However, since the protein sequence is always lagging behind the moving target defined by the amino acid profiles, while accepting substitutions preferentially in the direction of this target, substitutions are on average adaptive. This results in a net increase in the rate of non-synonymous substitutions, and thus a higher overall dN/dS, even if it is still well below 1. Only when the Red-Queen operates at an extremely high rate, drastically perturbating the fitness landscape as fast or faster than substitutions occur, would we observe a dN/dS greater than 1.
In their current form (Halpern and Bruno 1998; Rodrigue et al. 2010b; Tamuri et al. 2012, 2014), site-heterogeneous mutation–selection models have been constructed under the assumption of multiplicative fitness across sites. In reality, it is suspected that epistasis represents an important feature of protein evolution (Lunzer et al. 2010; Ashenberg et al. 2013; McCandlish et al. 2013; Weinreich and Knies 2013; Gong and Bloom 2014). One consequence of epistatic interactions is to change the fitness landscape experienced by each site, as the sequence at other interacting sites changes over time. Thus, like Red-Queen adaptive regimes, epistasis also results in a fluctuating fitness landscape at each site. However, and unlike in the case of most ecological or intra-genomic Red-Queens, which unfold at a relatively high rate, these fluctuations are slow (reviewed by Bazykin 2015). Furthermore, under epistasis, fluctuations at a given site are such that the fitness landscape at that site tends to change so as to stabilize the fitness of the current state, a phenomenon referred to as entrenchment (Shah et al. 2015), or evolutionary Stokes shift (Pollock et al. 2012). Also, whereas it has been pointed out that when a deleterious mutation becomes fixed in the protein, it may be subsequently compensated by clusters of mutations becoming fixed at interacting sites, so as to restore the fitness (Cutler 2000), at mutation–selection balance, such a strongly deleterious mutation would unlikely to be fixed in the first place, precisely because it is strongly deleterious; thus, such clusters would be rare. For these reasons, and in contrast to Red-Queen situations, epistatic interactions will tend to result in a decrease of the dN/dS, compared with the expectation under the nearly neutral null model with plain multiplicative fitness across sites. This reasoning has been put to use for estimating the contribution of epistasis in protein evolution (McCandlish et al. 2013), although without relying on explicit mutation–selection models.
New Approaches
An interesting idea suggested by all these observations is that, in order to study molecular evolutionary regimes at protein-coding genes, one could try to detect deviations in dN/dS, relative to that induced by the nearly neutral regime. Doing so represents a fundamental change in perspective, which places the emphasis on the adoption a more adequate null model of neutrality against which to conduct statistical tests. Using a more realistic null model of what happens in the absence of on-going adaptation should result in a higher sensitivity of the test.
Significant upward deviation of from 1 then signals that there are too many non-synonymous substitutions, compared with the null expectation under the nearly-neutral regime, potentially due to the presence of ongoing Red-Queen-like adaptation. Significant downward deviation of signals a deficit in non-synonymous substitutions, perhaps due to the presence of epistatic effects.
It is noteworthy that the overall dN/dS of the model given in 3 will be the dN/dS induced by the modeling of purifying selection (which we have denoted ω0) multiplied by the deviation parameter (denoted ), written symbolically as . Re-writing this into highlights the interpretation of as measure of deviation in the overall from what would be expected under the nearly neutral regime of the mutation–selection model, ω0. The standard application of codon substitution models is in fact a special case of this viewpoint, where ; in other words, with standard codon models, the (nearly-)neutral regime is one that assigns the same fitness to each amino acid, for all sites. However, Kimura emphasized that this is not the intended meaning of neutrality, stating (Kimura 1983, p. 53): “The neutral theory does not assert that all [original emphasis] amino acids are equivalent at a certain site, only that the majority of evolutionary changes concern those mutant that are equivalent.” The misconstrued concept of neutrality of classical codon models may explain their lack of sensitivity, which would be only partially compensated for by focusing the detection of adaption on specific sites and/or specific branches. In contrast, by explicitly accounting for the background of strong purifying selection, such as in Equation (3), should capture very modest shifts in fitness landscapes, even if these shifts are distributed across several different positions, and are evenly distributed over the branches of the phylogeny. Specifically, a signature of molecular adaptation would not need to be pronounced to the point of producing to be detected, but instead only requiring .
Bloom (2016) has very recently introduced an analogous framework in a maximum likelihood context. In his main approach, values are built from experimentally derived site-specific amino acid profiles; site-specific ML inference of is performed, along with single-observation likelihood ratio tests at each of the sites. However, most of currently available protein-coding DNA data are not amenable to experimental construction of amino acid profiles, and there remains an interest for random-effects models that include a deviation parameter in the context of a joint probabilistic inference.
We perform simulations under the mutation–selection construct of the nearly-neutral regime, along with simulations of Red-Queen adaptive regimes, and protein-structure-based epistatic regimes, to study the above models. We show that, when combined with the Dirichlet process capturing across-site amino acid fitness heterogeneity, is able to detect the evolutionary regimes of the simulations in accordance with the above predictions. Applying the approach to a few empirical cases suggests that, for the purpose of detecting adaptation in protein coding sequences, it may provide a promising alternative to current codon models.
Results and Discussion
Simulated Data
We simulated protein-coding sequence data under a mutation–selection-based approach at the scale of placental mammals, as explained in the “Materials and Methods” section. Among other values, these simulations require amino acid profiles to be defined. Three different sets of site-specific amino acid fitness profiles were explored, as inferred from three arbitrarily chosen real protein-coding sequence alignments under a model based on Equation (2) (Rodrigue et al. 2010b), again at the mammalian scale, for the following genes: SAMHD1, TRIM5α, and BRCA1. We refer to these simulations as those of the nearly neutral regime. We also simulated data taking the nearly-neutral regime parameter values as a starting point, but making small changes to the amino acid profiles along the branches of the phylogenetic tree; these are the Red-Queen adaptive regime simulations. And, finally, we simulated a contact map and statistical potential to further modulate non-synonymous rates of a nearly neutral setting, with a model similar to that in Robinson et al. (2003); these are referred to as the epistatic regime simulations (see “Materials and Methods” for details on simulations).
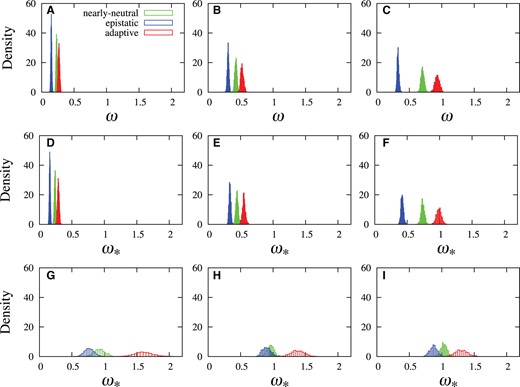
Posterior distributions of ω (for MG model, panels A, B, and C) and (for MutSelYN model in D, E, and F, and MutSelDP in G, H, and I) using three different sets of amino acid profiles (those obtained from SAMHD1 in left panels, those obtained from TRIM5α in middle panels, and those obtained from BRCA1 in right panels). Three simulation conditions were used: the nearly neutral regime (green), an adaptive regime (red) and an epistatic regime (blue).
Among the top three panels of figure 1, only in panel C does ω approach 1; this panel shows the simulations based on the posterior mean amino acid profiles inferred from the BRCA1 data set. Indeed, the posterior mean ω obtained on the real BRCA1 data set with the MG model is about 0.8 (table 1, first column), whereas the posterior mean ω obtained from simulations using profiles “trained” from that data set are close, but mildly below, in this case at about 0.7 (fig. 1C, green histogram). When using the BRCA1 profiles as a starting point, and activating the Red-Queen adaptive process, the distribution of ω (fig. 1C, red histogram) shifts to the right to the point of slightly over-stepping 1 in this instance. On the other hand, when simulating using the other two sets of amino acid profiles, obtained from data sets that lead to comparatively lower ω values under the plain MG model (with posterior means of about 0.3 and 0.45, respectively, for SAMHD1 and TRIM5α, see table 1, first column), the distributions of ω are always well below 1 (fig. 1A and B). With the nearly neutral regime simulations, the values of ω are again found to be close (with posterior means at 0.23 and 0.43, respectively, for these example SAMHD1 and TRIM5α simulations) to the values obtained on the true data (at 0.31 and 0.45, respectively, table 1, first column).
Posterior Means and 95% Credibility Intervals, in Parentheses, of ω (with the MG model) and (with MutSelYN and MutSelDP models) on Six Mammalian Genes is shown in square brackets.
| Data | MG | MutSelYN | MutSelDP |
|---|---|---|---|
| S1pr1-67-325 | 0.049 (0.042, 0.055) | 0.058 (0.051, 0.065) | 0.681 (0.538, 0.857) [0.001] |
| Rbp3-54-412 | 0.190 (0.177, 0.203) | 0.193 (0.181, 0.206) | 0.726 (0.654, 0.806) [0.000] |
| Vwf-62-392 | 0.205 (0.188, 0.220) | 0.212 (0.199, 0.226) | 0.960 (0.865, 1.063) [0.220] |
| Samhd1-67-543 | 0.309 (0.288, 0.332) | 0.324 (0.300, 0.348) | 1.731 (1.542, 1.935) [1.000] |
| Trim5α-68-363 | 0.454 (0.426, 0.484) | 0.468 (0.439, 0.498) | 1.240 (1.128, 1.355) [1.000] |
| Brca1-64-941 | 0.783 (0.750, 0.817) | 0.802 (0.770, 0.837) | 1.188 (1.123, 1.257) [1.000] |
Note.—With the MutSelDP model, the posterior probability is shown in square brackets.
The three panels of the middle row in figure 1D–F show the posterior distributions of under the site-homogeneous formulation of Yang and Nielsen (2008), referred to herein as MutSelYN; this is essentially the model written in Equation (3), but with all sites having the same amino acid fitness profile. As had been previously noted (Yang and Nielsen 2008), these distributions hardly differ from those of the panels above. We believe these and other previous attempts at combining a modeling of purifying selection with a scalar parameter on non-synonymous rates were simply not suitably capturing the overall form of the sequence fitness landscape. In this particular case, the explanation is straightforward: amino acid profiles are not global quantities, but highly variable across different coding positions, such that a global approach is likely very far from reflecting a realistic fitness landscape.
Finally, the bottom three panels of figure 1G–I show the posterior distributions of when invoked with the Dirichlet process controlling across-site heterogeneity in amino acid profiles, referred to as MutSelDP. These distributions have greater variance than those of the upper panels, since they are based on a much richer underlying model, and their locations are clearly very different than those of the panels above. In the three cases, the nearly neutral regime simulations lead to distributions that clearly straddle 1 (in green), indicating that the approach recovers well the actual simulation conditions. The adaptive Red-Queen simulations lead to distributions that clearly surpass 1 (red), indicating that the approach clearly recognizes the presence of an adaptive regime. The epistatic simulations show a tendency to lead to distributions of below 1 (blue), again suggesting that the approach can detect the presence of such an effect.
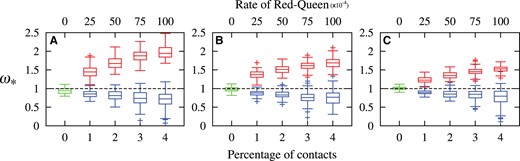
Summary of posterior means of 100 replicates for each boxplot. Results for simulations under the nearly-neutral regime are in green, whereas results for four different degrees of epistatic regimes (with increasing percentage of possible pairwise amino acids being in contact) are in blue, and results of four different rates of the Red-Queen are in red. Simulations were based on three initial sets of amino acid profiles, taken from SAMHD1 in A, TRIM5α in B, and BRCA1 in C.
Most simulations conducted under nearly-neutral conditions have posterior means close to 1 (fig. 2, green boxplots). Looking more closely at each of the distributions, we find that 87 of the 100 nearly neutral replicates using the SAMHD1 amino acid profiles included 1 in their posterior 95% credibility interval of . All 13 cases that did not include 1 were below it. For nearly neutral simulations with TRIM5α amino acid profiles, 95 of the 100 replicates included 1 in their posterior 95% credibility interval, with only 1 of the 5 error cases being above 1. For the nearly neutral simulations with the BRCA1 profiles, 97 of 100 replicates included 1 in their posterior 95% credibility interval of ; of the three replicates that did not, one had a 95% credibility interval below 1, and two are above 1. Overall, these results generally indicate a well-behaved system, although there appears to be a bias toward under-estimation of the value of . More work is required to investigate this mild bias.
We next note from figure 2 that the posterior mean value of tends to increase when the rate of the Red-Queen increases (red boxplots), i.e., when amino acid profiles change more rapidly along the branches of the tree, the detected deviation is indeed greater. Only 16 replicates of the 1,200 simulations under the adaptive regimes had 95% credibility intervals of that included 1, and these were all amongst the slowest setting of the Red-Queen. In all other cases, the credible intervals were above 1. This is in spite of the model’s under-estimation of , revealed by the results from the nearly neutral simulations, which is likely still the case in these Red-Queen simulations. Altogether, these results suggests that uncovering genes with high posterior probability support for provides a powerful test for the presence of ongoing, Red-Queen-like adaptation in protein coding sequences, while having a tendency to be conservative.
We also ran CODEML from the PAML package (Yang 2007) with several of the classic site models on these adaptive regimes simulations. Applied to the SAMHD1-based simulations, even with the most intense Red-Queen rate, none the site models detected any traces of adaptation (i.e., the likelihood was not significantly improved by including a class with ). Applied to the BRCA1-based simulations, on the other hand, site models in CODEML can detect on average 5% of sites at the lowest rate of the Red-Queen, and this climbs to 11% of sites at the highest rate of the Red-Queen. The TRIM5α-based simulations exhibit an intermediate behavior, going from 2% to 9% across the range of Red-Queen rates explored. That site models can readily detect adaptive regimes in some cases and not others can be understood from the fact that the BRCA1-based simulations start from a model that already induces a relatively high non-synonymous rate; it does not take very much for the Red-Queen to push ω beyond 1 at certain sites, whereas the SAMHD1-based simulations start out from a point that induces low non-synonymous rates, such that there is a long way to go for the Red-Queen to attain . Still, detecting 11% of sites as being under an adaptive regime is very inaccurate, since 100% of sites are in fact under a mild (on average) adaptive regime.
Figure 2 also shows that epistatic effects tend to lead to (blue boxplots), although in some cases (7 out of 1,200 replicates) it does surpass 1 with a posterior probability greater than 0.99. We are still unsure as to why a few epistatic simulations result in , but we suspect that the greater variance in the results across replicates as the extent of epistasis increases comes from the fact that a higher degree of epistasis requires one to simulate more contacts within the contact map protein structure representation; there are many more possible contact maps when 4% of each possible pair of amino acid positions are in contact than when only one 1% of pairs are. Given the random simulation of contact maps and statistical potentials, these simulations are not necessarily representative of epistasis at large. Rather, they show that, in principle, epistasis can occasionally lead to an , but that it’s overall tendency will be to produce .
Empirical Data
As example applications, six empirical data sets, corresponding to 6 genes sampled in placental mammals (S1Pr1, RBP3, VWF, TRIM5α, SAMHD1, and BRCA1) were analyzed with the models of interest herein (table 1). The MG model leads to posterior distributions of ω that are well below 1, with in all cases. As noted on the simulations, the MutSelYN model has little impact, and leads to values that hardly differ from the ω of the MG model. The MutSelDP model with is able to detect a signal of adaptive evolution in the TRIM5α, SAMHD1, and BRCA1 genes, which all lead to posterior distributions of beyond 1; as shown in table 1, their posterior probability of being greater than 1 is essentially 1 in these three cases. Interestingly, TRIM5α and SAMHD1 are known to be involved in the immune response against retroviruses in primates (Lee and KewalRamani 2004; Laguette et al. 2012; Zheng et al. 2012). In the case of BRCA1, a Red-Queen-like evolutionary regime is also suspected, possibly due to antagonistic selection between mother and offspring (Crespi and Summers 2004). The other three data sets (VWF, RPB, and S1PR1) either have below 1, or include 1 in its 95% credibility interval.
When analyzed with the site models, only the TRIM5α, SAMHD1, and BRCA1 data sets show evidence of adaptive evolution. Thus, in the present case, site-models would detect the same protein-coding genes as being under adaptation as would MutSelDP. On the other and, for the three proteins thus selected, the M8 model estimates that 13%, 8%, and 11% of sites, respectively, for TRIM5α, SAMHD1, and BRCA1, are under adaptive evolution. Given that these percentages are around the same as those found with site models in some of the most extreme Red-Queen adaptive simulations applied to 100% of sites, it seems plausible that a large proportion of adaptive evolution may remain undetected by the classical approaches.
Conclusions and Future Work
Here, we introduce a codon model framework relying on a fine-grained mechanistic model of the nearly neutral regime acting on protein coding sequences. A deviation parameter, , is introduced, such that upward deviations of away from 1 of are suggestive of the presence of an ongoing Red-Queen-like adaptive regime (diversifying selection). Technically, this codon framework can be used as a test for the presence of adaptation, by uncovering genes such that the posterior probability that is sufficiently high. Being based on a more realistic null model of neutrality, our approach has the potential to be more powerful than classic codon models. This is particularly apparent in simulation conditions where adaptation occurs on a background of strong purifying selection (table 2).
Number of Replicates among sets of 100 Where (and )
| Samhd1-67-543 | Trim5α-68-363 | Brca1-64-941 | |
|---|---|---|---|
| Nearly-neutral | 0 (0) | 1 (0) | 2 (0) |
| Epistatic | |||
| 1 | 0 (0) | 0 (0) | 0 (0) |
| 2 | 0 (0) | 0 (0) | 0 (0) |
| 3 | 0 (0) | 0 (0) | 3 (3) |
| 4 | 0 (0) | 3 (3) | 1 (1) |
| Adaptive | |||
| 25 | 95 (89) | 97 (95) | 96 (85) |
| 50 | 100 (100) | 100 (100) | 100 (100) |
| 75 | 100 (100) | 100 (100) | 100 (100) |
| 100 | 100 (100) | 100 (100) | 100 (100) |
More generally, the simulations performed here suggest that, if conducted at a 95% posterior probability threshold, the resulting test has a good power (with only 16 out of 1,200 true positive cases, i.e., about 1.3%, missed by the test), while having a good control of the rate of false positives (<1% on genes evolving under a pure nearly-neutral regime or when epistatic interactions are explicitly accounted for in the simulation model). Indeed, results under the pure nearly neutral simulations indicate a tendency to under-estimate . The Dirichlet process may not always capture the distribution of amino acid profiles across sites sufficiently well, which would most likely lead it to an under-estimate of the intensity of purifying selection, or, in other words, an over-estimate of ω0. One modeling avenue to explore this issue would be to extend the base distribution of the Dirichlet process, perhaps so as to be a mixture itself.
It will also be important to investigate many more simulation conditions, such as varying a relative effective population size over the branches of the tree, introducing codon usage bias, or context-dependent mutation rates, in order to better understand the possible reasons for results where . Moreover, combining these simulation complexities together, or even just combining the different simulation conditions explored herein, would be revealing; given our results, one can readily imagine that a sort of tug-of-war between adaptive Red-Queen-like regimes across certain sites, and epistatic interactions across certain sites, such that, for instance, . One would thus be mislead into thinking that the evolutionary regime is a nearly neutral one.
Another extension from this point would be to combine the heterogeneous modeling ideas of site models to the new parameter within the MutSelDP. Indeed, Rodrigue (2008) discussed the idea of a model that combined two independent Dirichlet processes: one to account for heterogeneous amino acid profiles across sites, and another to account for heterogeneous parameters across sites. Note that such a modeling framework differs from the site-specific ML of Bloom (2016). In any case, approaches to heterogeneous modeling of within a rich mutation–selection framework seem much more accessible than explicitly accounting for the features we introduced within the simulation conditions (Robinson et al. 2003; Blanquart and Lartillot 2008; Rodrigue et al. 2009), and would enable a powerful analysis. The present work could act as a stepping-stone toward a re-appraisal of evolutionary regimes discernible from interspecific molecular data.
Materials and Methods
Data
We used six protein-coding genes at the scale of placental mammals: Rbp3-54-412: retinol-binding protein 3 (former IRBP gene), 54 taxa; S1pr1-67-325: sphingosine-1-phosphate receptor 1, 67 taxa; Vwf-62-392: von Willebrand factor, 62 taxa; Brca1-64-941: breast cancer 1, 64 taxa; Trim5α-68-363: tripartite motif-containing protein 5, 68 taxa; a virus restriction factor; Samhd1-67-543: SAM domain and HD domain-containing protein, 67 taxa; cellular enzyme responsible for blocking retroviral replication.
For Samhd1, Trim5α, placental mammalian sequences were retrieved from GenBank, translated and aligned using Muscle (Edgar 2004). The protein alignment was used as a template to align the nucleotide sequences whereas respecting the coding structure. Finally, the sequences were filtered using Gblocks (Castresana 2000), with the default options. For all other datasets, the alignments were obtained from Lartillot and Delsuc (2012).
Simulations
We simulated the evolution of sequences of length N = 300 codons, along a pre-specified tree, with 38 tips. The simulation model is parameterized by a nucleotide mutation process and a fitness landscape defined at the protein level (the model assumes no selection on synonymous variants). Three alternative models of the fitness landscape were considered:
The overall simulation process is Markovian. The events can be either a point substitution (to any one of all possible single-nucleotide mutants away from the current sequence, except those resulting in a premature stop codon) or, in the case of the fluctuating fitness regime, a modulation of the fitness parameters at any of the fluctuating sites (i.e., a transition undergone by the hidden state at that site). Given the current sequence at time t, and given the hidden states at all fluctuating sites, the rate associated to each possible event is calculated. In the case of substitution events, these rates are given by the mutation rate multiplied by the fixation factor, which itself depends on the fitness of the final and the initial sequence variant (Halpern and Bruno 1998). Note that, in the presence of epistasis, the fitness of each single-mutant depends on the sequence at all other positions. The total rate Rtot, summed over all possible events at time t, is calculated, and the time until the next event is randomly drawn from an exponential distribution of rate Rtot. Then, the exact nature of the next event is chosen with a probability equal to the relative rate of this event (from the mutation rate, for synonymous mutations, or from the product of the mutation rate and the fixation factor, for non-synonymous cases). Whenever the waiting time to the next event exceeds the amount of time remaining until the next branching event along the phylogenetic tree, the simulation process is started with the current state, independently along each of the two daughter branches. The procedure is started at a time T = 100 time units before the root (so as to ensure that the process has reached stationarity before starting from the root) and is propagated forward in time down to all tips of the tree.
Priors and Implementation
We used the same priors as in previous works (Lartillot et al. 2013; Rodrigue and Lartillot 2014):
Branch lengths are i.i.d. exponential of rate λ, itself exponential of rate 0.1.
We use a Dirichlet process over amino-acid fitness profiles, with base distribution a Dirichlet(αi), where the αi are i.i.d. exponential of rate 1.
The granularity parameter of the Dirichlet process is exponential of rate 0.1 (mean 10).
Nucleotide exchangeability parameters and nucleotide frequency parameters are each flat Dirichlets.
Non-synonymous rate factors ω and are ratios of two exponential random variables (Huelsenbeck et al. 2006).
The use of PhyloBayes-MPI with the mutation–selection model is explained within the online manual, and activating the parameter is done by adding the option -freeomega to the command. To obtain the plain MG model, the options -freeomega and -catfix uniform are applied, whereas to obtain the MutSelYN model, the options -freeomega, -rigidbaseprior, and -ncat 1 are applied. For simulated data, inferences based on MCMC calculations were conducted under fixed tree topology, as originally used for the simulations, and were run for 1,100 cycles, discarding the first 100 as burn-in. Note that each cycle itself includes hundreds of Gibbs and Metropolis-Hastings updates within PhyloBayes-MPI. Real data analyses were run with 5,500 cycles (500 as burn-in), treating the topology (with uniform priors) as a nuisance variable of the inference. Source code is freely available within the PhyloBayes-MPI package, distributed at www.phylobayes.org.
Acknowledgments
We thank Jesse Bloom and an anonymous reviewer for constructive comments on the manuscript. This work was supported by the Natural Sciences and Engineering Research Council of Canada (NR), by a start-up fund from Carleton University (NR), and by the French National Research Agency, Grant ANR-10-BINF-01-01 “Ancestrome” (NL).
References
Author notes
Associate editor: Tal Pupko
