-
PDF
- Split View
-
Views
-
Cite
Cite
G. Gürkan, N. Jackson, L. V. E. Koopmans, C. D. Fassnacht, A. Berciano Alba, Measuring gravitational lens time delays using low-resolution radio monitoring observations, Monthly Notices of the Royal Astronomical Society, Volume 441, Issue 1, 11 June 2014, Pages 127–135, https://doi.org/10.1093/mnras/stu557
Close - Share Icon Share
Abstract
Obtaining lensing time-delay measurements requires long-term monitoring campaigns with a high enough resolution (<1 arcsec) to separate the multiple images. In the radio, a limited number of high-resolution interferometer arrays make these observations difficult to schedule. To overcome this problem, we propose a technique for measuring gravitational time delays which relies on monitoring the total flux density with low-resolution but high-sensitivity radio telescopes to follow the variation of the brighter image. This is then used to trigger high-resolution observations in optimal numbers which then reveal the variation in the fainter image. We present simulations to assess the efficiency of this method together with a pilot project observing radio lens systems with the Westerbork Synthesis Radio Telescope to trigger Very Large Array observations. This new method is promising for measuring time delays because it uses relatively small amounts of time on high-resolution telescopes. This will be important because instruments that have high sensitivity but limited resolution, together with an optimum usage of follow-up high-resolution observations from appropriate radio telescopes may in the future be useful for gravitational lensing time-delay measurements by means of this new method.
1 INTRODUCTION
The strong gravitational lensing effect occurs when light from a background source (a galaxy or a quasar) is deflected by the gravitational field of an intervening mass, such as a galaxy or cluster of galaxies, forming multiple images of the background source (Schneider, Ehlers & Falco 1992; Kochanek 2006). This phenomenon is widely used in astrophysics and cosmology as a tool because it provides information about mass distributions in the lensing object (e.g. Kochanek 1991; Koopmans & Treu 2002; Barnabè & Koopmans 2007) as well as magnified views of the sources (e.g. Marshall et al. 2007; Jackson 2011).
Refsdal (1964) demonstrated that lensing time delays can be used to measure cosmological distances, in particular the Hubble constant H0. This can be done if the background source is variable by measuring time delays between variations of the images, thereby deducing an absolute distance scale provided the redshifts of the source and lens, and the mass model of the lens potential, can be determined. The time delay in a lens system scales with the size of the Universe and inversely with H0; in a given system, it also depends on other cosmological parameters such as the matter density Ωm and dark energy density ΩΛ, although this dependence is relatively weak. Consequently, large-scale time-delay studies in future may allow these parameters to be determined as well (Dobke et al. 2009; Suyu et al. 2010, 2013). It is worthwhile to note that these parameters affect the H0 determination at a relatively low level, and in principle gravitational lensing is therefore a useful one-step method for H0 determination on cosmological scales. A number of groups are currently carrying out monitoring campaigns to determine time delays for lenses in the optical (e.g. Eigenbrod et al. 2005; Kochanek et al. 2006; Vuissoz et al. 2007; Fohlmeister et al. 2008; Vuissoz et al. 2008; Courbin et al. 2011; Rathna Kumar et al. 2013; Tewes et al. 2013). Measured time delays by means of these projects generally suggest 63 < H0 < 82 km s−1Mpc−1. See e.g. Jackson (2007) and Freedman & Madore (2010) for more general reviews of measurements of the Hubble constant.
A difficulty with obtaining lensing time-delay measurements is that it requires monitoring campaigns of months to years with a high enough resolution (<1|${\rm \,arcsec}$|) to separate the multiple images. The four-image lens system B1608+656 (Myers et al. 1995; Snellen et al. 1995), for instance, required observations for multiple seasons with the Very Large Array (VLA). After almost three years’ monitoring of B1608+656, the accuracy of the time delays improved by factors of 2–3 due to an increase of the flux density of the background source by 25 per cent (Fassnacht et al. 1999, 2002).
To minimize the problems mentioned above, we propose a new method for gravitational lens time-delay measurements. In asymmetric double image and long-axis quadruple image lens systems, we can take advantage of the fact that the brighter image(s) varies first and dominates the total flux. This method builds on a suggestion by Geiger & Schneider (1996) who proposed using low-resolution observations only. Low-resolution but high-sensitivity observations are used which are sufficient to recognize the variation of the brighter image. Afterwards, observations with a high-resolution interferometer array are triggered to see the variation of the fainter images. In order to assess the efficiency of our technique, we performed cross-correlation simulations using the Pelt dispersion statistic (Pelt et al. 1996a) and artificial light curves. We also used the Pelt dispersion statistic to evaluate the results of our pilot project.
This paper is organized as follows. A description of our proposed technique, together with results from simulations performed to assess its efficiency, are presented in Section 2. As a pilot project, a flux monitoring campaign was carried out with the Westerbork Synthesis Radio Telescope (WSRT) at 5 GHz including 39 epochs of observations. VLA observations at 5 GHz giving 1 arcsec resolution were triggered to resolve the images of the system B1030+074 which showed a possible variability feature during the flux monitoring. These results are shown in Sections 3 and 4. Finally, in Section 5, we discuss this technique and the results.
2 A METHOD FOR TIME-DELAY MEASUREMENTS
There are only ∼20 gravitational lens systems which have time-delay measurements among which five lens systems have radio light curves and 17 lenses have optical light curves. The main reason for this is that there are fewer radio lenses that show significant variation. It should also be noted that lensing time-delay measurements require long-time monitoring campaigns with a high-resolution (|${<}1{\rm \,arcsec}$|) telescope to separate the images of a lensed source. In the radio, the VLA, Multi-Element Radio Linked Interferometer Network (MERLIN), the Very Long Baseline Array (VLBA) and Low-frequency Array (LOFAR; van Haarlem et al. 2013) are the only interferometer arrays that are capable of regular imaging with the required resolution (Biggs et al. 2001; Fassnacht et al. 2002).
Geiger & Schneider (1996) proposed a ‘light-curve reconstruction’ method for the determination of time delays in gravitational lens systems. They suggested that it is possible to reconstruct the light curves of the individual images using a single dish total flux monitoring by assuming values for the time delay and the magnification ratio. However, the evaluation of the effects of different parameters on the method (e.g. magnification ratio, observing period) showed that additional interferometric observations are necessary in order to achieve significant results. For this reason, they concluded that a few additional interferometric observations are necessary. The true time-delay value can then be determined by checking the consistency of the reconstructed light curves utilizing the flux density ratio of the images by way of additional interferometric observations.
Here, we propose a technique which has similar features to the method used by Geiger & Schneider (1996). This technique which proposes using observations of both low- and high-resolution radio interferometer arrays, is observationally more complicated, but minimizes the required time of high-resolution observations. We focus on observations at radio frequencies as the radio fluxes of lensed images are not affected by microlensing produced by stars in the lens galaxy (e.g. Chang & Refsdal 1979; Irwin et al. 1989; Wambsganss, Paczynski & Schneider 1990), the presence of dust (e.g. Elíasdóttir et al. 2006), or the confusion between the lens galaxy and the lensed images. We note that extrinsic effects can affect radio light curves of objects that are close to the galaxy disc (Koopmans & de Bruyn 2000; Koopmans et al. 2003). By contrast, optical lenses may suffer from all these problems. Among radio lenses, asymmetric double image and long-axis quadruple image lenses are particularly interesting because the brighter image shows the intrinsic variation first on the lensed source flux and after a time the fainter component(s) varies. In the case of long-axis quadruples, three close images act like a brighter image and the time delay between three components is much smaller than the delay between the faint image and the bright component. Undertaking total flux monitoring gives us the variation of the brighter component, which dominates the total flux. It is therefore possible to use low-resolution but highly sensitive radio observations for total flux monitoring. Once a light curve shows signs of variation in the total flux of the lens, high-resolution observations can be triggered at the time that the fainter component is expected to vary. Then, a reasonable period of followup using the high-resolution monitoring should allow us to recover a time delay assuming that H0 is close to 70 km s−1 Mpc−1 (∼20–50 per cent) and that a reasonable model for the lens galaxy's mass profile is in hand (Koopmans et al. 2006, 2009; Auger et al. 2010; although there is a degeneracy that couples the mass density profile and time delays and this affects the derived H0). At present, monitoring telescopes need to be in the Northern hemisphere because of the availability of the VLA or MERLIN for followup, but this will change in the future with the advent of the Square Kilometre Array (SKA).
2.1 The Pelt dispersion statistic
For the technique presented here, the detectability of a time delay depends on a large number of parameters. These can be divided into parameters associated with the source, namely the flux ratio of the lensed images and the difference between the brightest and faintest part of the light curve in any definite feature (the amplitude of variation), and those associated with the observations: the timing of the sequence of triggered observations, the time interval between two consecutive flux measurements (the sampling frequency), number of epochs, errors in the flux measurement and the noise level of both the low-resolution and high-resolution triggered observations.
2.2 Light curve simulations
There are two potential problems with the monitoring approach we propose here. The first is that the total light curve contains flux from both components, thus affecting the measured time delay because the delay analysis effectively compares the total flux density with the fainter image flux density, rather than the brighter image with the fainter. This problem becomes worse for a lower flux ratio, for which the contamination of the total light curve is worse, and for shorter time delays, for which the time-scale of variability and the time delay may be similar. The second problem is that a triggering strategy must be chosen which is optimally adjusted, in number and separation of samples, to achieve the best result for the time delay without using large numbers of triggered observations.
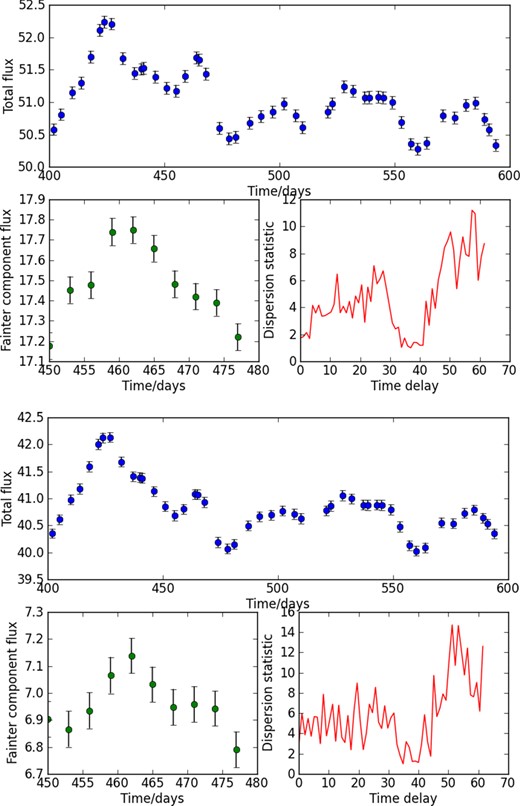
A full analysis of this problem is beyond the scope of this paper, because both the magnitude of the blending problem and the decision on triggering parameters depend on the particular quasar light curve as well as the intrinsic flux ratio. However, for an illustrative example, we consider the light curve of the image A fluxes of the four-image lens system B1608+656 (Fassnacht et al. 1999) as a template. This is used because it is a well-sampled light curve with a definite peak feature. We then assume a time delay, and simulate triggered observations which compare the total-flux light curve with a smaller number of observations of the fainter component. The resulting total light curve, faint object light curve, and Pelt statistic are presented in Fig. 1 for some representative cases, and assuming a time delay of 36 d.
Simulations of time-delay recovery from two-image lenses, with flux ratios 2.0 (top panel) and 5.0 (bottom panel). The light curve of CLASS B1608+656A (Fassnacht et al. 1999) has been used, and the errors scaled so that the observation of the weaker component of the 5:1 lens has an error of 1 per cent. In each panel, the top sub-panel shows the total light curve from the two components, assuming a 36 d time delay, and the bottom-left sub-panel shows the reconstructed faint-image light curve, adding extra Gaussian noise to the data points. The bottom-right panel shows the Pelt dispersion statistic, scaled such that Dmin = 1. Note that in both cases, the main minimum is at approximately the correct value, with an error of a few days in each case. There is a secondary minimum at close to zero lag, corresponding to the influence of the fainter component on the total light curve. In the two cases, the correct time delays are recovered with errors of about 1 and 2.5 d for the two cases, although this excludes a small number (∼5 per cent) of catastrophic errors.
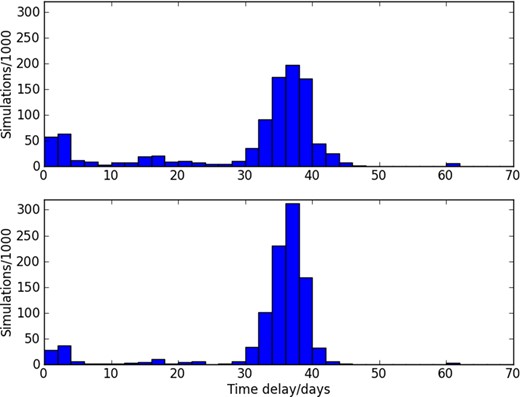
As expected, the major effects on the ability to recover a good time delay are the characteristic amplitude of variation of the quasar, as a multiple of the error on the observations; and the cadence of monitoring. Experiments with different sampling of the delayed peak at 420–430 d in the total light curve show that 10 observations, 3 d apart give an rms error in the time delay of about half that of three observations, 10 d apart. For this light curve, at least 5–8 observations are needed in order to measure the time delay, and diminishing returns set in after this. The effect of blending of the light curves in the total flux monitoring can also be seen in Fig. 1. For this light curve, the effect of the fainter component on the total light curve begins to cause a secondary minimum in the Pelt spectrum, and significant numbers of catastrophic errors in the resultant time delay, once the component flux ratio is about 3 or less. Fig. 2 shows the effect on the recovered time delay as the flux ratio is lowered; for a 2:1 flux ratio there is a significant increase in the number of catastrophic errors. Again, these results are indicative only and will be different for any particular light curve.
Recovered time delays for the 1608+656 light curve, with a true 36 d time delay, but assuming a 2:1 (top) and 5:1 (bottom) flux ratio between the two components, together with a 1 per cent measurement error on the triggered observations of the fainter component (see Fig. 1). 1000 trials were conducted in each case. Note the increased number of catastrophic errors in the 2:1 case.
For the preliminary observations presentedin later sections, the triggering strategy adopted was simply to trigger further observations as soon as a variation was seen. However, in any further observations, simulations of this sort can and should be used to decide whether the features seen in the total light curve give a good case for collection of triggered observations. A further constraint which can be incorporated in the analysis is the intrinsic ratio of the two components, if this has previously been determined during monitoring campaigns during which the object has not varied.
3 WSRT 5 GHz MONITORING AND DATA REDUCTION
An initial test of this method was made using eight radio lenses from the Cosmic Lens All-Sky Survey (CLASS) survey of gravitational lenses (Browne et al. 2003; Myers et al. 2003).
3.1 Observations and data reduction
Total flux monitoring of eight radio lens systems (including the highest flux-ratio double systems available in the CLASS survey) was conducted using the WSRT, using observations with enough nominal sensitivity to measure variations in flux density at the ∼1 per cent level. Table 1 shows the observed lens systems and flux calibrators used in the observations. 5 GHz snapshot observations with 8 × 20 MHz bandwidth channels and 3.7 arcsec resolution were collected over 39 epochs, with a separation of 2 d between epochs, from 2007 July to 16 October. Each source was observed for 10 min in each snapshot.
The table shows the features of the target lenses. The lenses are selected among double or long-axis quadruple CLASS lenses with the highest flux ratios. D and Q refer to Double lenses (two-image lenses) and Quadruple lenses (four-image lenses), respectively. Separation between the images of the sources are given in column 3. Column 4 gives the flux density of the component which varies first. Column 5 gives the flux density of the delayed component and column 6 the time delay if H0 = 70 km s−1 Mpc−1 (assuming an isothermal mass profile for the lens galaxy). The calibrator sources used during the total flux monitoring can be seen in column 7.
| Object . | Type . | Separation . | Flux . | Flux . | Likely . | Phase . | References . |
|---|---|---|---|---|---|---|---|
| . | . | (arcsec) . | brighter . | fainter . | delay . | calibrators . | . |
| . | . | . | image . | image . | . | . | . |
| . | . | . | (mJy) . | (mJy) . | (d) . | . | . |
| CLASS B0445+123 | D | 1.2 | 25 | 4 | 30 | 3C138 | Argo et al. (2003) |
| CLASS B0631+519 | D | 1.2 | 34 | 5 | 15 | 3C147 | York et al. (2005) |
| CLASS B0850+054 | D | 0.7 | 55 | 9 | 18 | J0907+037 | Biggs et al. (2003) |
| CLASS B0739+366 | D | 0.6 | 27 | 5 | 10 | J0736+331 | Marlow et al. (2001) |
| JVAS B1030+074 | D | 1.6 | 200 | 13 | 110 | J1015+089 | Xanthopoulos et al. (1998) |
| CLASS B1152+199 | D | 1.6 | 50 | 18 | 30 | J1142+185 | Myers et al. (1999) |
| JVAS B1422+231 | Q | 1.2 | 500 | 5 | 25 | J1429+218 | Patnaik et al. (1992) |
| CLASS B2319+051 | D | 1.4 | 56 | 11 | 25 | J2398+034 | Rusin et al. (2001) |
The data were reduced using the National Radio Astronomy Observatory (NRAO) Astronomical Image Processing Software (aips) package. 3C147, a steep-spectrum source (Zhang et al. 1991), was used as an absolute flux calibrator for all epochs; when this source was not observable, the steep-spectrum source 3C138 was used instead. During epochs 11, 21, 31, 36 and 37 neither calibrator was observed. Therefore, observations of these epochs were excluded from the analysis. It is worth noting that bootstrapping the flux from other sources in the field could not be performed because it does not yield robust results when using WSRT snapshots. The reason is that the WSRT is a linear array with a poor snapshot point spread function. Each source in each epoch was inspected separately by eye to flag bad points within aips using the tasks listr, uvfnd and uvplt on each IF and Stokes parameter separately. The data of epochs 8, 27 and 34 were of poor quality and much of the data had to be removed, so these epochs were also not used for the light curves. Calibration was performed in the standard way by a Parseltongue script which runs aips tasks to determine amplitude and phase solutions for the data.
3.2 Radio fluxes
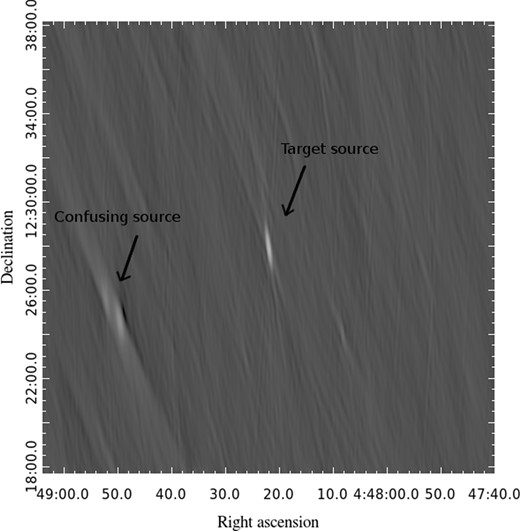
After the calibration process, integrated flux densities of the target sources and the calibrators were derived by fitting a point-source model to the calibrated (u,|$ v $|) data within the Caltech Difference Mapping (difmap) software package (Shepherd 1997). The major problem with the analysis is that the WSRT, being a linear array, produces a fan beam which is thin and highly elongated. External sources may be included by the beam, depending on the hour angle of the observation and the orientation of the target and contaminating sources, which may lead to a change in measured flux of a target source. Fig. 3 shows an example image of B0445+123 where a neighbouring source is included in the beam. In order to assess this effect NRAO VLA Sky Survey (NVSS) maps (Condon et al. 1998) were obtained for each source. For each observation, we checked whether there are neighbouring sources that are likely to be included in the flux measurement by the orientation of the beam. We included possible confusing sources in the fitting models to subtract their effects from the fluxes measured. Further analysis was carried out to examine other possible effects such as varying the flux of contaminating sources in the models, changing the range of baselines included, and modelling the lenses as two points instead of one. These investigations showed that the NVSS sources can affect the measured fluxes. Thus, it will affect the measured scatter in the light curves. Table 2 shows the results for the scatter measured in the light curves of the sources. In this process, the NVSS sources were considered in the fitting models. Excluding short baselines in the fitting models also slightly improved our results. The chosen baselines are shown in Table 2. Fluxes of the NVSS sources were fixed and the lens was modelled as one point source, both of which provided better results.
The image presents an example for the case of a confusing source included by the beam. In the image of B0445+123, a confusing source can be seen to the southeast of the lens system. The image has been made by adding multiple epochs together to get enough UV coverage to be able to make the image.
The table shows the rms scatters measured in the light curves of all sources. The units are in mJy.
| Source . | Scatter . | Relative . | UV range . | Excluded . |
|---|---|---|---|---|
| . | . | scatter (%) . | kilo-wavelength . | epochs . |
| B0445+123 | 2.62 | 7.5 | 8–1000 | – |
| B0631+519 | 0.91 | 1.5 | 13.9–1000 | – |
| B0739+366 | 0.80 | 4.0 | 0.0–1000 | 5 |
| B0850+054 | 8.69 | 17.4 | 0.0–1000 | 13, 18, 20, 23, 24, 25, 30, 32 |
| B1030+074 | 12.08 | 5.0 | 0.9–4 | 17 |
| B1152+199 | 5.88 | 11.7 | 0.1–2 | – |
| B1422+231 | 27.39 | 4.1 | 0–1.5 | 3, 14, 19, 24 |
| B2319+051 | 1.23 | 2.5 | 1–20 | 12, 13, 17, 20 |
| 3C138 | 80.22 | 2.0 | 0.9–1000 | – |
| 3C147 | 13.15 | 0.2 | 10–1000 | – |
| J0736+336 | 9.928 | 1.2 | 0.8–10 | – |
| J0907+037 | 8.41 | 4.6 | 10–20 | 5, 13, 17, 24, 25, 30, 32 |
| J1015+089 | 9.53 | 3.7 | 0.8–4 | 17 |
| J1142+185 | 6.73 | 3.6 | 1.5–10 | – |
| J1429+218 | 6.32 | 2.4 | 10–13 | 7, 33, 35 |
| J2338+034 | 6.41 | 1.1 | 10–20 | 12, 13, 17, 20 |
The difmap software generally produces small estimates of the error, equivalent to the thermal noise in the maps which is expected to correspond to a measurement error on each point-source flux of σ ∼ 0.1 mJy. The actual scatter in the light curves is larger than this. When we examined the light curve of 3C138, calibrated using 3C147, we found an rms scatter of approximately 1 per cent (in quadrature), and we therefore adopt this as an additional error corresponding to the best case of systematic errors in the calibration. The formal errors given by the difmap are underestimated, since the errors are likely to be dominated by external sources intruding into the beam. These, at approximately 2 per cent, dominate the overall errors, and we therefore take 2 per cent as the error on the source flux of each measurement. It is worth noting that this is likely an overestimate for the objects that do not have a significant effect of confusing sources (e.g. B2319+051).
3.3 Light-curve production
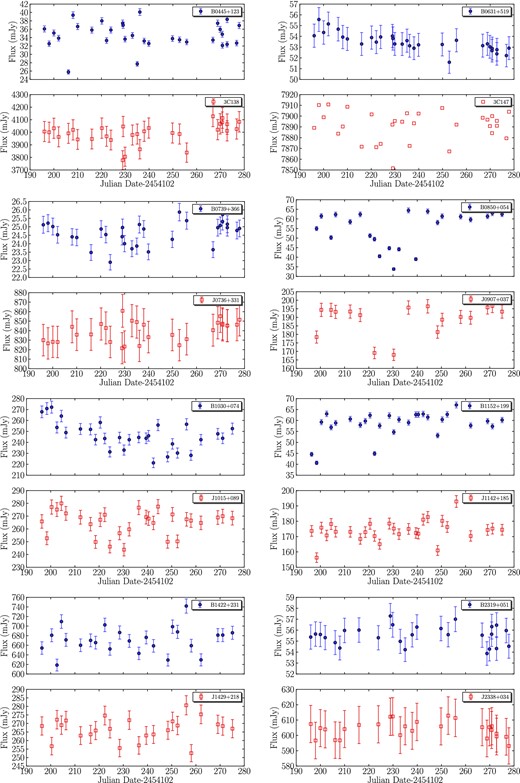
Light curves of both the sources and their calibrators are shown in Fig. 4. The light curves of most calibrators remain close to constant, although some of the calibrators are not steep-spectrum sources and may show intrinsic variability. A few epochs showed a significant scatter around the mean flux density, and in many cases this could be traced back to a high level of flagged data. These epochs were also removed from subsequent analysis. Examination of Fig. 4 shows that most sources, as well as calibrators, did not show obvious variability. Significant scatter is apparent in some sources, up to 5 per cent in some cases, much greater than the estimated errors and unlikely to be due to intrinsic variability because of the short time-scales. Among those sources whose light curve is reasonably smooth, B1030+074 (Jackson, Xanthopoulos & Browne 2000) and B0631+519 showed possible variability features during the total flux monitoring. In the case of B0631+519, although the errors are uncertain, improvements in χ2 of about a factor of 2 (from 0.5 to 0.2) are obtainable by use of a straight-line fit instead of a constant flux density. This suggests that the flux density of B0631+519 varied over the monitoring period.
The WSRT light curves of the target sources (blue filled circles) with their calibrators (red open squares) plotted separately. Fluxes in the light curves were produced using the UV ranges shown in Table 2 and NVSS sources removed from the field. Most of the calibrators’ light curves are close to constant. (This is also checked by fitting a constant line through the calibrator fluxes and calculating the reduced χ2.) The target sources B0631+519 and B1030+074 show a variability feature during the WSRT monitoring. Some objects, in particular B0850+054, had a high level of corrupted data almost all over the epochs and show a correspondingly greater level of scatter in their light curves. 3C147 is used as a flux calibrator and so the light curve of this source does not have errors.
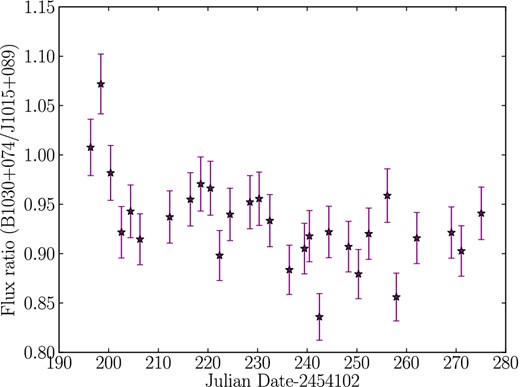
In the case of B1030+074, the situation is less clear as a variation is also apparent in the calibrator. Investigation using a Pearson statistic yields no evidence for significant correlated variation between 1030+074 and its calibrator. We conservatively assume that part of the variation in B1030+074 is due to instrumental effects which show up in both sources, and so Fig. 5 shows the light curve of B1030+074 with the calibrator variation divided out. This is a well-known technique to re-normalize the light curves (e.g. Koopmans et al. 2000). A least-squares fit to this divided curve still shows a significant reduction in χ2 for a linear fit with a gradient, compared to that with a constant flux; the reduced χ2 value decreases from 2.83 to 2.14.
Integrated flux densities of B1030+074, divided by its calibrator J1015+089. Note the decrease in the flux of the target during the period of flux monitoring.
4 VLA 5 GHz MONITORING AND DATA REDUCTION
During the total flux monitoring only B1030+074 and B0631+519 target sources showed a possible variability feature in their light curves. As soon as the variability feature was seen in the first 13 epochs (∼220 d), VLA observations were triggered only for B1030+074 at nine epochs (separated by 10 d) between 2007 October 5 and 2008 January 3. The VLA observing period was chosen to be around the time that we expect the fainter component to vary, provided that H0 is between 50 and 100 km s−1 Mpc−1 and that the lens galaxy's mass profile is not too far from isothermal (Koopmans et al. 2006, 2009; Barnabè et al. 2011). Because B0631+519 is a smaller-separation system, the variation which occurred late in the observing session could not be followed up with the VLA.
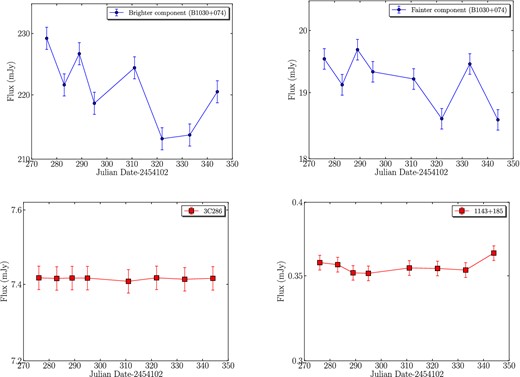
For each epoch, the data were collected at 5 GHz using 2 IFs each with 50 MHz bandwidth. The array completed a move from the extended A-configuration to B-configuration during this time, so the observations were conducted using B-configuration, which has a resolution of 1.2 arcsec, just sufficient to separate, and measure the flux densities of the two components of B1030+074 which are 1.6 arcsec apart (Xanthopoulos et al. 1998). 3C286 was used as a primary amplitude calibrator and 1143+185, a compact source that does not vary (Fassnacht & Taylor 2001), was used as a secondary calibrator to improve errors in the absolute flux calibration for each epoch. 1015+089 and 1014+088 were used as phase calibrators in different epochs. In each epoch, the target source was observed first, followed by the phase calibrator, secondary flux calibrator and primary flux calibrator, respectively.
The NRAO aips package was used for initial editing and all of the calibration processes. Before gain calibration, the data were manually inspected, and if necessary flagged. The first epoch had large scatter in the visibility amplitudes and it was not used for the subsequent analysis.
During the observations, the Expanded Very Large Array (EVLA) antennas were included. The mismatch between the bandpass response functions of VLA and EVLA antennas can lead to closure errors.1 These errors were removed at the beginning of the analysis using the observations of 3C286 as a baseline calibrator. These baseline calibration results were applied to the data during the subsequent gain calibration process for all epochs. Calibration proceeded by obtaining amplitude and phase solutions for each antenna and applying these to the data. Finally, imaging of the target source B1030+074 and self-calibration was carried out manually for each epoch.
4.1 Light-curve production
VLA light curves for the triggered observations of the B1030+074 and the flux calibrators. The first top plot: the brighter component. The second plot: the fainter component shows a declining trend. For comparison, the bottom two figures show the light curves of the two calibrators 3C286 (assumed to have a constant flux density) and the flux calibrator 1143+185, which is a non-variable compact source.
4.2 Analysis of the light curves and time-delay estimation
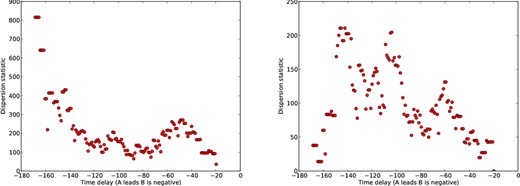
Using the VLA and WSRT light curves together, we calculated values for the Pelt statistic as a function of time delay. The results are shown in Fig. 7. We cannot extract an unambiguous time delay, because of a number of circumstances including a lack of a clear peak in the flux density variation, and the relatively high scatter in the follow-up observations, which may be due to difficulties in the amplitude calibration owing to the VLA/EVLA changeover which was happening during the observations. The results do show a wide minimum in the possible time delay. If we assume a known flux density ratio between the two components, this rules out very long time delays but otherwise does not improve the constraints significantly. In theory, knowing the intrinsic flux density ratio should allow a time-delay determination only if a monotonic decline was observed in the source, but this would require higher signal-to-noise than is available in the observations reported here. The predicted time delay of ∼110 d (Xanthopoulos et al. 1998), expected if H0 = 70 km s−1 Mpc−1, is consistent with the data.
Inferred Pelt dispersion statistic for the WSRT and VLA observations of B1030+074. Left: assuming that the intrinsic flux ratio is known to be 13 (e.g. Xanthopoulos et al. 1998). Right: with no assumption about the intrinsic flux ratio. It is worth noting that the dispersion statistic at the extreme left-hand end of the plot (<160 d) is based on the overlap of very few points.
5 CONCLUSIONS
In this work, we have proposed an alternative method for gravitational lens time-delay measurements. This technique does not rely only on high-resolution observations which are typically required for lensing time-delay measurements. It primarily uses low-resolution observations and this enables us to utilize high-resolution observations at an optimum level.
The efficiency of this technique, defined as the number of high-resolution observations that it requires, was evaluated by performing cross-correlation simulations using the Pelt dispersion statistic. Our results show that, for typical light curves, the true time delay can be covered with five-to-eight high-resolution observations, an order of magnitude fewer than required in traditional approaches. As a pilot project, we used the WSRT to perform total flux monitoring for eight radio lens systems and triggered VLA observations for the one object, B1030+074, that showed variability during the total flux monitoring. For this object, the expected trend of decreasing flux density with time was not seen convincingly in the fainter component's light curve. Analysis of the possible time delay concluded that a wide range of time delays are consistent with the available data.
Despite the lack of a clear result on an initial trial, this new method is potentially useful because it predominantly uses time on low-resolution telescopes. This is important because new, highly sensitive but low-resolution instruments are under construction such as the Meer Karoo Array Telescope (MeerKAT; an rms noise level of ∼7 |$\mu$|Jy beam−1 in 24 h with 500 MHz) and ASKAP (an rms noise level of ∼ 37 |$\mu$|Jy beam−1 in an hour with 300 MHz). Since these arrays are not linear, confusion due to neighbouring sources will not be a big problem. Such instruments, together with a modest amount of high-resolution observational followup, may in future be useful for gravitational lensing time-delay measurements by means of this new method.
We would like to thank Ian Browne for his useful comments and discussions. The WSR is operated by the ASTRON (Netherlands Institute for Radio Astronomy) with support from the Netherlands Foundation for Scientific Research (NWO). We thank Michiel Brentjens for support during the WSRT observations. The VLA is operated by the US NRAO, which is a facility of the National Science Foundation operated under cooperative agreement by Associated Universities, Inc.


